CGIL
CGIL (General Coordination of Labor Immigration)
Since October 2020, residence permits for work and investment purposes have demonstrated minor fluctuations within a stable scenario, with a monthly average of approximately 2,000 grants. This average is 500 permits lower than the pre-pandemic period (Graph 1).
In the month of May, the nationalities that obtained the highest number of permits were from China, the United States, and the Philippines. Regarding occupational groups, immigrant workers were primarily engaged in medium-level technical activities and occupations in the sciences and arts (Graph 2).
Among skilled workers, the Chinese emerged as one of the prominent nationalities. Additionally, only Indians and Mexicans represented the Global South, as the majority of highly skilled labor force predominantly originated from the Global North (Graph 3).
GRAPH 1
Number of work permits for labor and investment purposes, by month of registration - Brazil, 2019-2021

Source: OBMigra (2021), based on data from the General Coordination of Labor Immigration/Ministry of Justice and Public Security.
GRAPH 2
Number of permits granted, by occupational group - Brazil, May/2021

Source: OBMigra (2021), based on data from the General Coordination of Labor Immigration/Ministry of Justice and Public Security.
GRAPH 3
Number of permits granted to skilled workers, by main countries, Brazil, May 2021.

Source: OBMigra (2021), based on data from the General Coordination of Labor Immigration/Ministry of Justice and Public Security.
CTPS/RAIS/NOVO CAGED
Harmonized database Work and Social Security Card (CTPS)/Annual Report of Social Information (RAIS)/New General Register of Employed and Unemployed Persons (CAGED)
Although job creation for immigrant labor has remained positive, it has experienced negative fluctuations over the past three months. This downward trend has been observed since October 2020, which marked the peak in the historical series that began in January 2019 (Graph 4).
In relation to the main nationalities moving into the formal labor market, the general picture has not changed, with Haitians and Venezuelans standing out and the latter benefiting from the larger number of jobs created (Graph 5).
The South Region remained in first place regarding the creation of jobs for immigrant labor in the formal market, accounting for 76.3% of the vacancies, followed by the North Region, which accounted for 26.6% (Graph 6).
GRAPH 4
Jobs created for immigrants, by month - Brazil, 2019-2021

Source: OBMigra (2021), based on data from the harmonized database RAIS-CTPS-CAGED and the Digital System of Tax, Social Security and Labor Obligations (eSocial)..
GRAPH 5
Movements of migrant workers in the formal labor market, by main countries - Brazil, April 2021

Source: OBMigra (2021), based on data from the harmonized database RAIS-CTPS-CAGED and the Digital System of Tax, Social Security and Labor Obligations (eSocial).
GRAPH 6
Proportion of formal jobs created for immigrants (%), acoording to Region - April 2021

Source: OBMigra (2021), based on data from the harmonized database RAIS-CTPS-CAGED and the Digital System of Tax, Social Security and Labor Obligations (eSocial).
SISMIGRA
SisMigra (National Migration Registry System)
The number of residence permits in May showed a slight increase in relation to the previous month, although it remains at levels well below those observed before the SARS-COV-2 pandemic (Graph 7).
The main eligibility grounds for residence in May were the regularization of Venezuelan migration (273), humanitarian admission (279), Mercosur residents (209), and family reunification (286), which mostly supported immigrants whose nationalities originated in the Southern Hemisphere (Graph 8).
In terms of the nationalities involved in immigration to Brazil, Venezuelans and Haitians emerged as the primary highlights, constituting 62.9% of the total regularizations (Map 1).
GRAPH 7
Number of immigrant registrations, by month of registration - Brazil, 2019/2021

Source: OBMigra (2021), based on data from the Brazilian Federal Police, National Migration Registry System (SISMIGRA).
GRAPH 8
Total number of registrations, according to eligibility grounds - May 2021

Source: OBMigra (2021), based on data from the Brazilian Federal Police, National Migration Registry System (SISMIGRA).
MAP 1
Number of immigrant registrations, by main countries of birth, May 2021.
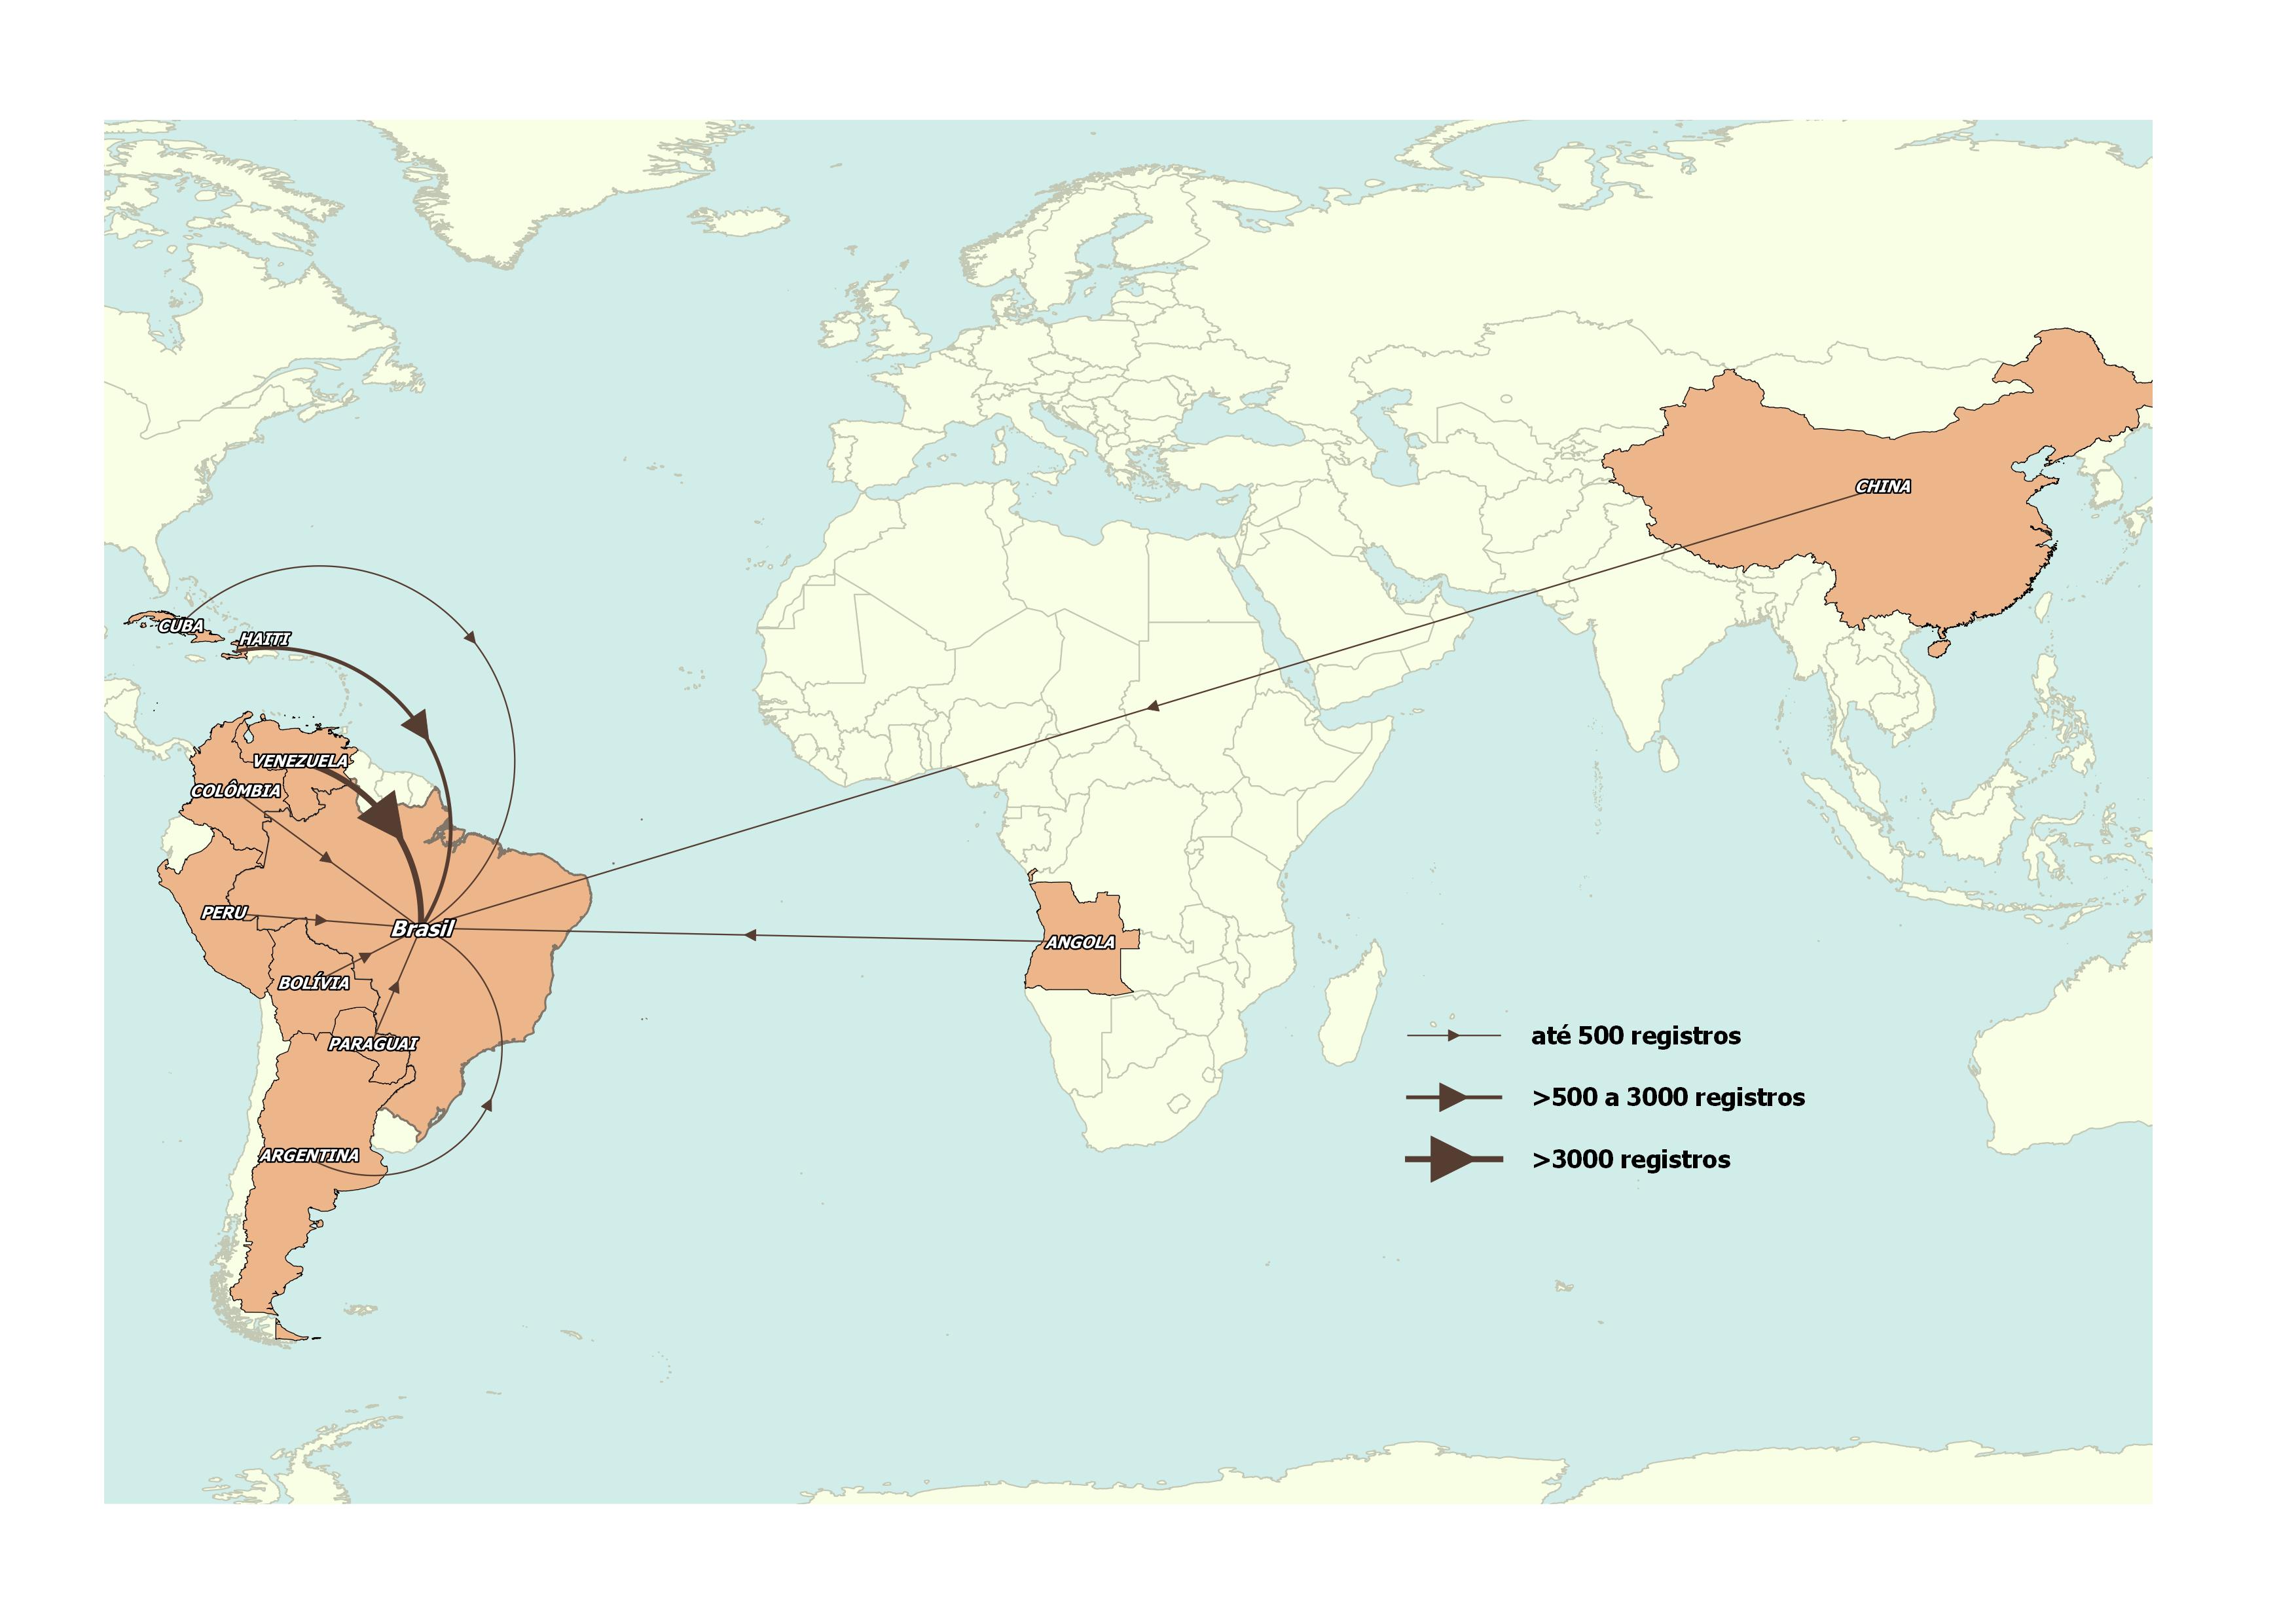
Source: OBMigra (2021), based on data from the Brazilian Federal Police, National Migration Registry System (SISMIGRA).
STI
STI (International Traffic System)
Except for tourists and immigrants with temporary visas, all other categories experienced negative balances in the movement through Brazilian border crossings. The ongoing restrictions on international physical mobility, particularly concerning Brazil, imposed by several countries due to the COVID-19 pandemic, continue to affect the flow of people to and from the country (Graph 9).
Even in this scenario of barriers to mobility, people from the United States and the Philippines stood out among the main nationalities that crossed our borders (Graph 10).
GRAPH 9
Cross-border movements, by month of registration, Brazil 2019/2021

Source: OBMigra (2021), based on data from the Brazilian Federal Police, STI
GRAPH 10
Cross-border entry into and exit from Brazilian territory, by main nationality countries - Brazil, May 2021

Source: OBMigra (2021), based on data from the Brazilian Federal Police, International Traffic System (STI).
STI-MAR
STI-MAR (International Traffic System - Warning and Restrictions Module)
The number of applications for the recognition of refugee status has remained stable, averaging around a thousand applications per month throughout 2021. Pacaraima/RR has emerged as the primary entry point for applicants, primarily due to the political, economic, and social crisis in Venezuela. However, with the closure of land borders, especially those adjacent to Venezuelan territory, the entry of this group has significantly decreased (Graph 11).
On Map 2, it is evident that these restrictions have caused Angolans, Indians, and Chinese to surpass Cubans and Haitians regarding the volume of applications for the second consecutive month. It is worth noting that for the latter two nationalities, the primary strategy for entering the country was through land borders.
Despite the constrained circumstances, Pacaraima/RR continues to be the primary city for receiving applications, followed by Guarulhos, which benefited from the opening of the air border (Graph 12).
GRAPH 11
Number of asylum claims, by month of registration - Brazil, 2019-2021

Source: OBMigra (2021), based on data from the International Traffic System - Warning and Restrictions Module.
GRAPH 12
Number of asylum claims, according to main municipalities - Brazil, May 2021

Source: OBMigra (2021), based on data from the International Traffic System - Warning and Restrictions Module.
MAP 2
Number of asylum claims, by main countries of nationality, May 2021
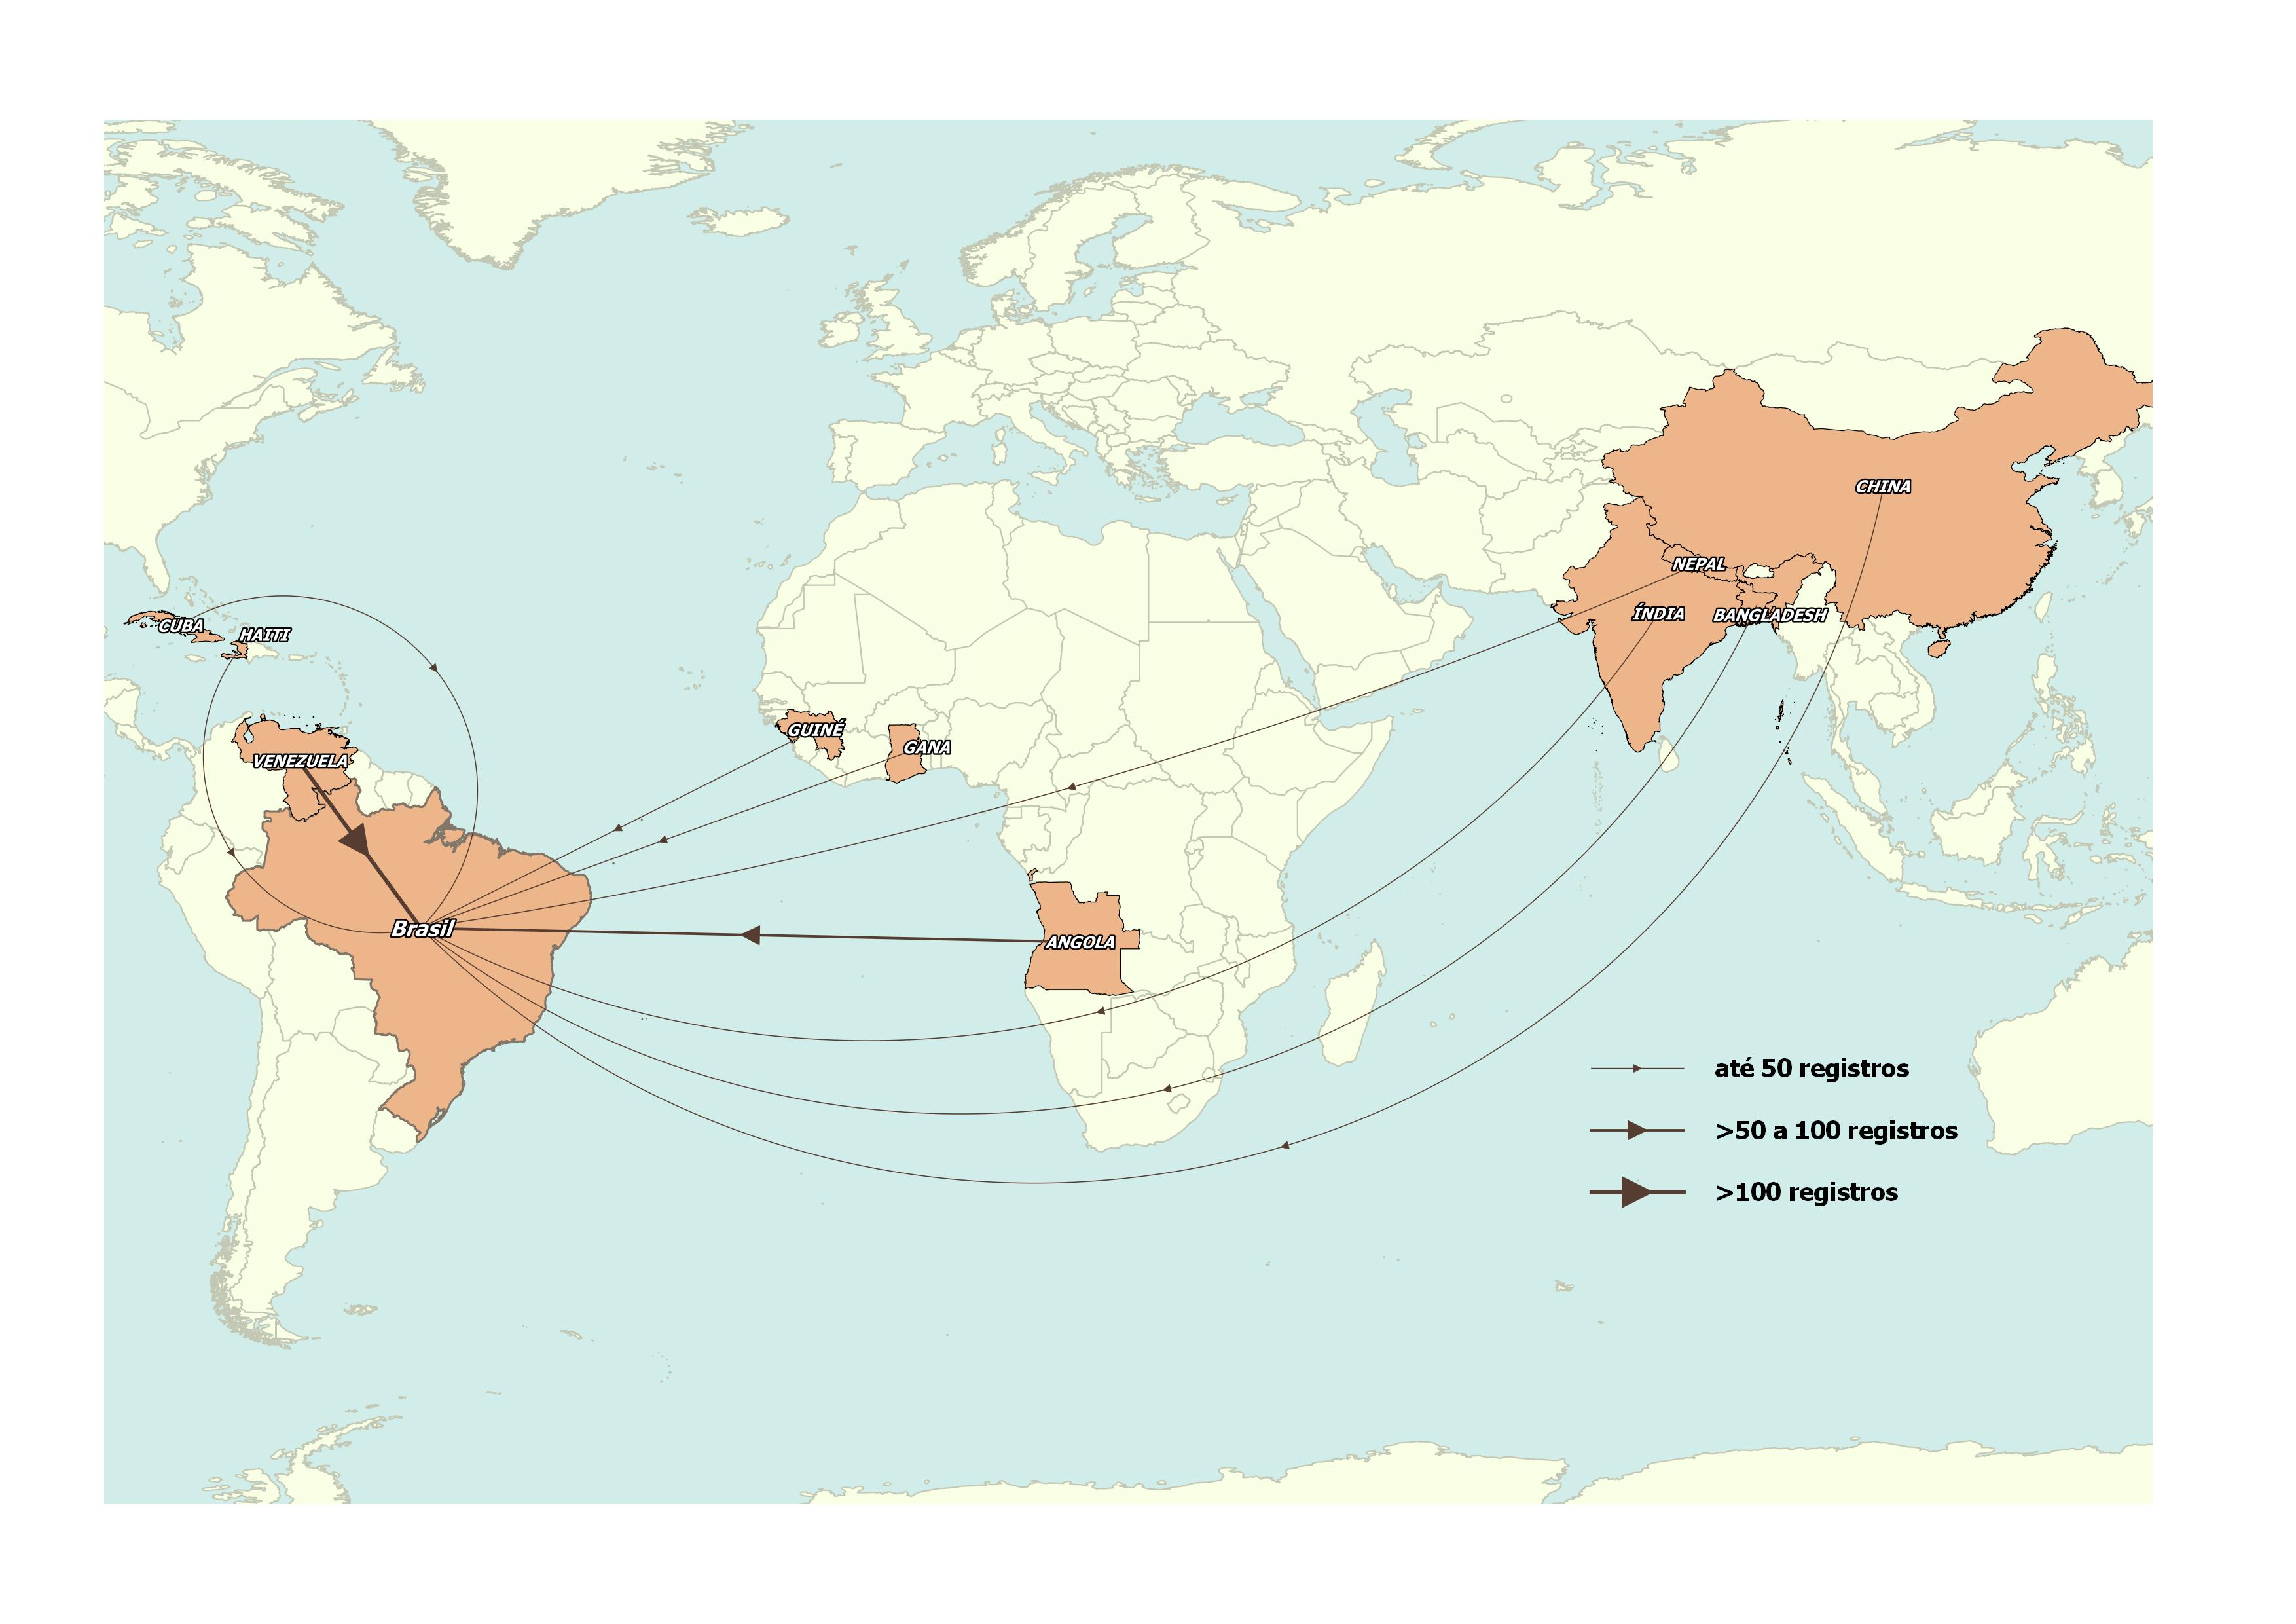
Source: OBMigra (2021), based on data from the International Traffic System - Warning and Restrictions Module.
COMO CITAR
The reproduction of this text and the data contained therein is permitted, provided that proper citation of the source is included. Reproduction for commercial use is prohibited.
How to cite this text:
| CAVALCANTI, L; OLIVEIRA, T; FURTADO, A; DICK, P; QUINTINO, F; MACEDO, M. Acompanhamento de fluxo e empregabilidade dos imigrantes no Brasil: Relatório Mensal do OBMigra Ano 2, Número 5, maio de 2021/ Observatório das Migrações Internacionais; Brasília, DF: OBMigra, 2021. Available at: https://portaldeimigracao.mj.gov.br/pt/dados/relatorios-mensais |