CGIL
CGIL (General Coordination of Labor Immigration)
The number of residence permits for work and investment purposes experienced a significant recovery compared to the previous month (68.9%) and also showed an increase compared to November 2020 (14.7%). However, given the historical fluctuations in this indicator over the analyzed years, it is necessary to wait for the coming months to determine the future trend (Graph 1).
The positive result in November was primarily driven by the permits granted to Filipinos, Italians, and Chinese, with a notable contribution from workers with higher levels of education (Graph 2).
Among skilled immigrant workers, Chinese immigrants stood out as the main nationality (Graph 3).
GRAPH 1
Number of work permits for labor and investment purposes, by month of registration - Brazil, 2019-2021

Source: OBMigra (2021), based on data from the General Coordination of Labor Immigration - CGIL.
GRAPH 2
Number of residence permits granted for work and investment purposes, by occupational groups - Brazil, November 2021

Source: General Coordination of Labor Immigration/Ministry of Justice and Public Security, November 2021.
GRAPH 3
Number of work permits granted to skilled workers, by main countries - Brazil, November 2021

Source: General Coordination of Labor Immigration/Ministry of Justice and Public Security, November 2021.
CTPS/RAIS/NOVO CAGED
Harmonized database Work and Social Security Card (CTPS)/Annual Report of Social Information (RAIS)/New General Register of Employed and Unemployed Persons (CAGED)
October marked the end of a four-month streak of formal job losses for immigrants. The trend in job creation for immigrant workers had been declining since November 2020 (Graph 4), indicating a loss of dynamism in this segment. It will be crucial to monitor the upcoming months to determine whether there will be a genuine recovery in job creation for immigrants.
The dynamism observed in the month was primarily driven by the positive results achieved by Venezuelans (Graph 5). Furthermore, the creation of jobs was well diversified across various industries and occupational groups.
The increase in the number of job vacancies for immigrant workers primarily occurred in the Southern states, São Paulo, and to a lesser extent, in Rio de Janeiro, Roraima, and Amazonas (Map 1).
GRAPH 4
Jobs created for immigrants, by month - Brazil, 2019/2021

Source: OBMigra (2021), based on data from the harmonized database RAIS-CTPS-CAGED and the Digital System of Tax, Social Security and Labor Obligations (eSocial).
GRAPH 5
Movements of migrant workers in the formal labor market, by month, sex, and main countries - Brazil, October 2021.
Source: OBMigra (October 2021), based on data from the Ministry of Economy, Harmonized database RAIS-CTPS-CAGED.
MAP 1
Number of jobs created for immigrants, according to Federation Unit, October 2021.
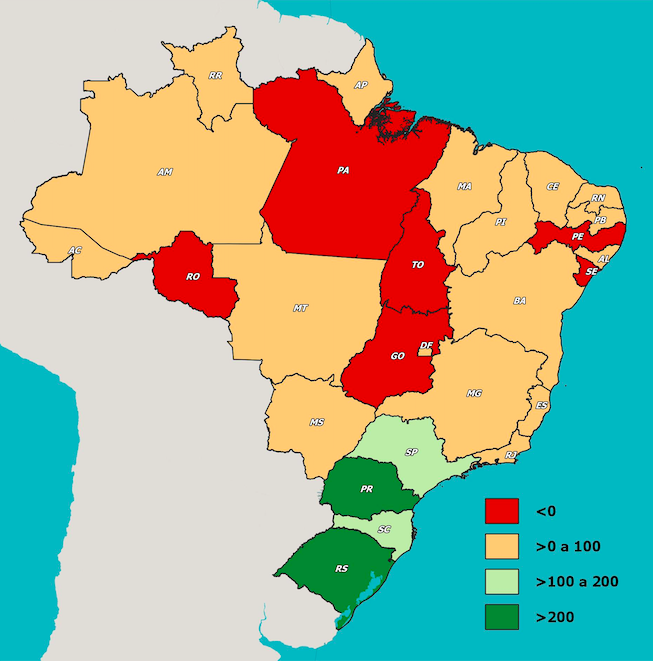
Source: OBMigra (October 2021), based on data from the Ministry of Economy, Harmonized database RAIS-CTPS-CAGED.
SISMIGRA
SisMigra (National Migration Registry System)
The number of residence registrations in November reached the highest value in the entire historical series, which started in January 2019, with a 144.7% increase in the twelve-month variation and a slight 6.2% fluctuation compared to the previous month (Graph 6).
The most frequently used eligibility ground was number 273, based on Brazilian Inter-ministerial Ordinance No. 9, which provides for humanitarian admissions, especially for Venezuelans. Other frequently used eligibility grounds were 209 (reception of immigrants from member countries of the Mercosur Residence Agreement) and 286 (family reunification) (Graph 7).
Venezuelans accounted for 76.4% of the residence registrations made in November (Map 2).
GRAPH 6
Number of immigrant registrations, by month of registration - Brazil, 2019-2021

Source: OBMigra (2021), based on data from the Brazilian Federal Police, National Migration Registry System (SISMIGRA).
GRAPH 7
Total number of registrations, according to eligibility grounds, Brazil, November 2021

Source: OBMigra (November 2021), based on data from the Brazilian Federal Police, National Migration Registry System (SISMIGRA).
MAP 2
Number of immigrant registrations, according to Federation Units, November 2021.
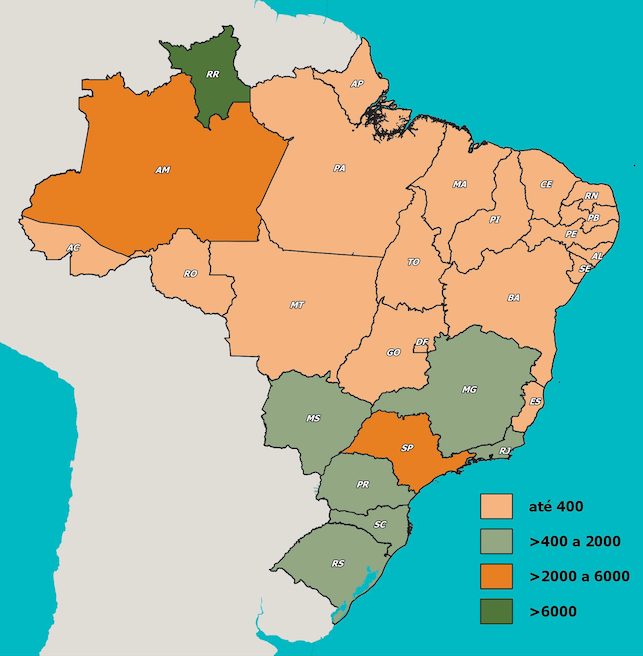
Source: OBMigra (November 2021), based on data from the Brazilian Federal Police, National Migration Registry System (SISMIGRA).
STI
STI (International Traffic System)
Cross-border movements of people have been gradually increasing since April of this year, with the number of exit movements surpassing the number of entry movements, resulting in a negative balance of over 205,000 (Graph 8).
The negative performance in cross-border movements was primarily driven by the continued exit movements of Brazilians, suggesting a possible resurgence of emigration (Graph 9).
GRAPH 8
Cross-border movements, by month of registration, Brazil 2019/2021

Source: OBMigra (2021), based on data from the Brazilian Federal Police, STI.
GRAPH 9
Cross-border entries and exits from Brazilian territory, according to classification typologies - Brazil, November 2021

Source: OBMigra (November 2021), based on data from the Brazilian Federal Police, International Traffic System (STI).
STI-MAR
STI-MAR (International Traffic System - Warning and Restrictions Module)
In November, the number of applications for recognition of refugee status returned to levels close to those observed in the pre-pandemic period, with a significant variation of 214.1% in the year-on-year comparison and 63.1% in relation to the previous month. Barring any potential intercurrences, the trend suggests that in the coming months the numbers will continue to rise and approach the levels seen in 2019 (Graph 10).
For the first time in the historical series starting in January 2019, the age group under 15 years old, comprising children and adolescents, represented the highest number of requests for recognition of refugee status. This significant information emphasizes the importance of monitoring by migration authorities and regional entities to address the potential vulnerability of these individuals. It indicates the need for targeted public policies to ensure proper reception and support for this specific population (Graph 11).
As observed in the residence records, Venezuelans significantly impacted the pattern of requests, particularly in refugee applications, accounting for a substantial proportion of 87.1% (Map 3).
GRAPH 10
Number of asylum claims, by month of registration - Brazil, 2019-2021

Source: OBMigra (2021), based on data from the International Traffic System - Warning and Restrictions Module.
GRAPH 11
Number of applications for recognition of refugee status, by month and age groups - Brazil, November/2021

Source: OBMigra (November 2021), based on data from Brazilian Federal Police, and the International Traffic System - Warning and Restrictions Module.
MAP 3
Number of applications for recognition of refugee status, by country of nationality - Brazil, 2019-2021

Source: OBMigra (November 2021), based on data from Brazilian Federal Police, and the International Traffic System - Warning and Restrictions Module.
COMO CITAR
The reproduction of this text and the data contained therein is permitted, provided that proper citation of the source is included. Reproduction for commercial use is prohibited.
How to cite this text:
| CAVALCANTI, L; OLIVEIRA, T; FURTADO, A; DICK, P; QUINTINO, F; GUIMARÃES, B. Acompanhamento de fluxo e empregabilidade dos imigrantes no Brasil: Relatório Mensal do OBMigra Ano 2, Número 11, novembro de 2021/ Observatório das Migrações Internacionais; Brasília, DF: OBMigra, 2021. Available at: https://portaldeimigracao.mj.gov.br/pt/dados/relatorios-mensais |