CGIL
CGIL (General Coordination of Labor Immigration)
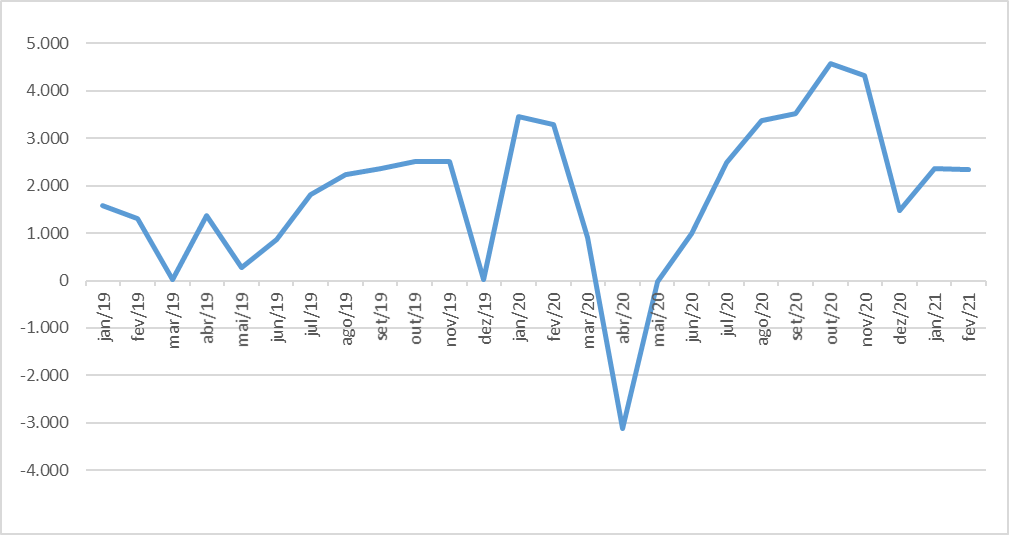
The number of residence permits for work and investment purposes has shown consecutive monthly increases, surpassing even the number of approvals from a year ago (Graph 1). However, it is crucial to await the trend in the upcoming months to determine whether this indicates a sustained growth in the number of permits. It should be noted that although there was a peak in July 2020, marking the highest point in the historical series that began in 2019, it was followed by a subsequent decline in the number of approvals.
The residence permits granted targeted mainly workers who fell into the medium-level professional occupational groups, and sciences and arts (Graph 2).
Among skilled workers, the number of permits followed a pattern similar to that of grants in general. Chinese and Japanese immigrants are the main nationalities of this skilled workforce (Graph 3).
GRAPH 1
Number of work permits for labor and investment purposes, by month of registration - Brazil, 2019-2021
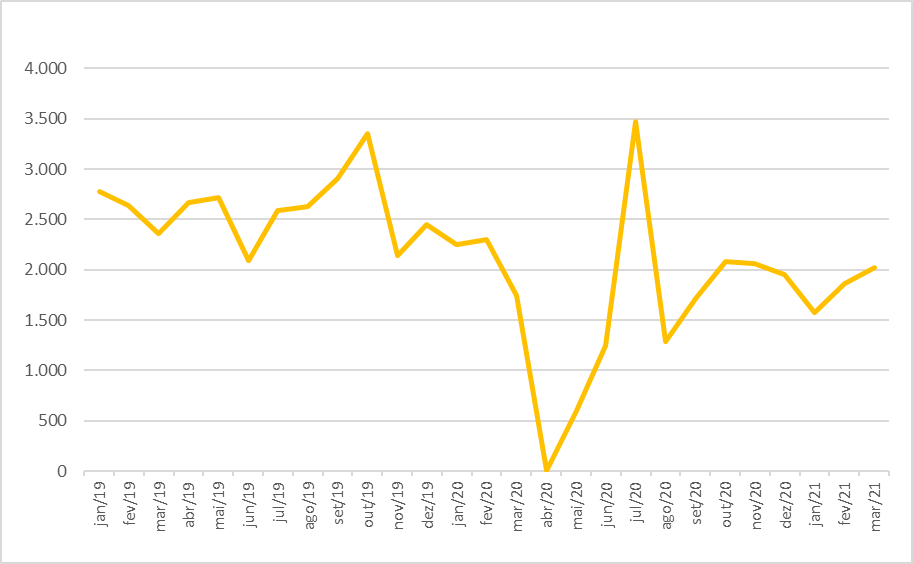
Source: OBMigra (2021), based on data from the General Coordination of Labor Immigration - CGIL.
GRAPH 2
Number of permits granted, by occupational group - Brazil, March/2021
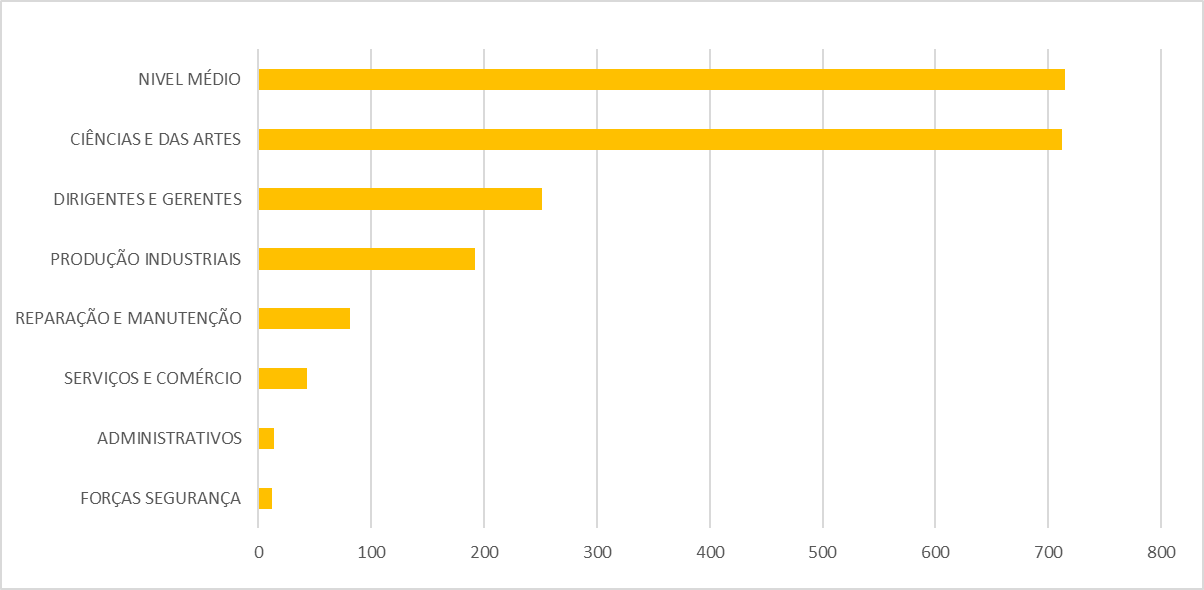
Source: OBMigra (2021), based on data from the General Coordination of Labor Immigration - CGIL.
GRAPH 3
Number of permits granted for skilled workers, by occupational group - Brazil, March/2021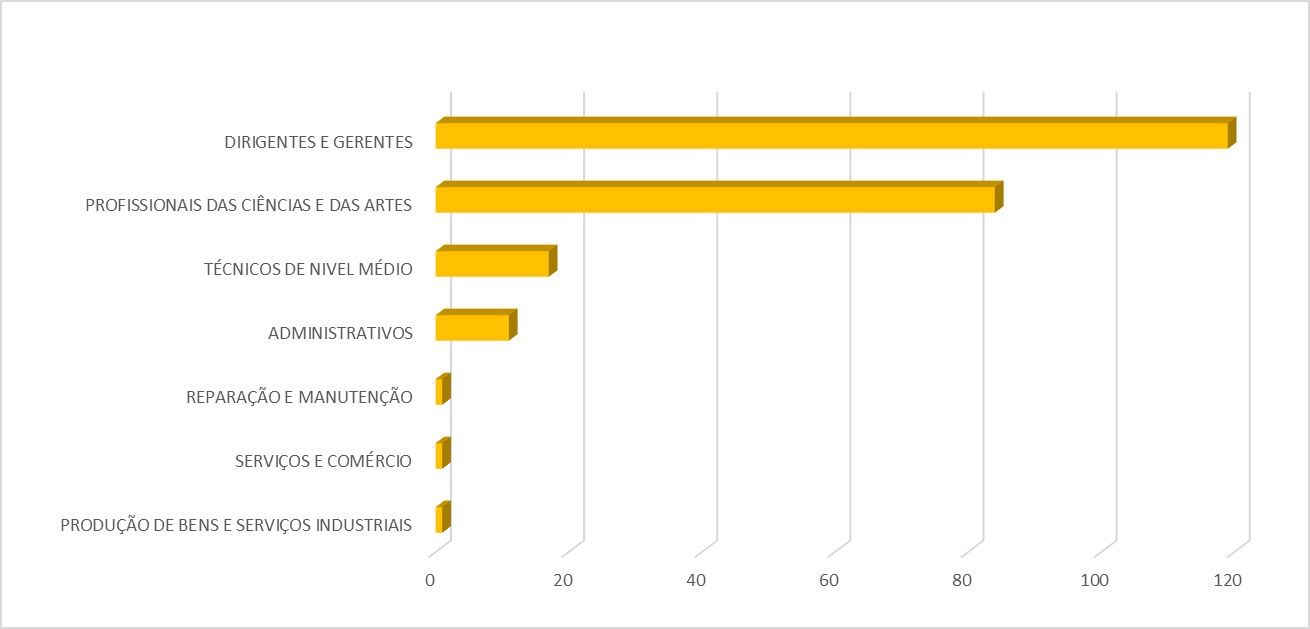
Source: OBMigra (2021), based on data from the General Coordination of Labor Immigration - CGIL.
CTPS/RAIS/NOVO CAGED
Harmonized database Work and Social Security Card (CTPS)/Annual Report of Social Information (RAIS)/New General Register of Employed and Unemployed Persons (CAGED)
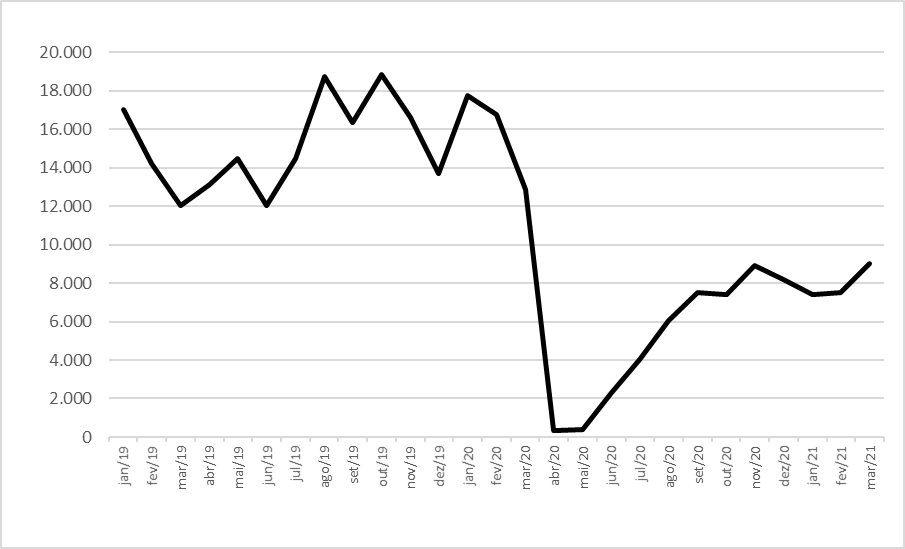
In terms of both monthly (4.0%) and annual (4.8%) comparisons, the movement of the immigrant labor force in February remained relatively stable, as depicted in Graph 4. It is worth noting that the number of jobs created during this period was slightly lower than that of January 2021.
Haitians, Venezuelans and Paraguayans remained the main nationalities in the formal labor market. It is worth noting that although the movement of Paraguayan workers has been smaller than that observed among Venezuelans, more vacancies were generated for the neighbors on the southern border (Graph 5).
In Graph 6, it is possible to observe that the cities of São Paulo/SP, Cascavel/PR and Chapecó/SC were the ones that most created jobs for immigrant labor.
GRAPH 4
Jobs created for immigrants, by month - Brazil, 2019/2020
Source: OBMigra (2020), based on data from the harmonized database RAIS-CTPS-CAGED and the Digital System of Tax, Social Security and Labor Obligations (eSocial).
GRAPH 5
Movements of migrant workers in the formal labor market, by main countries - Brazil, February 202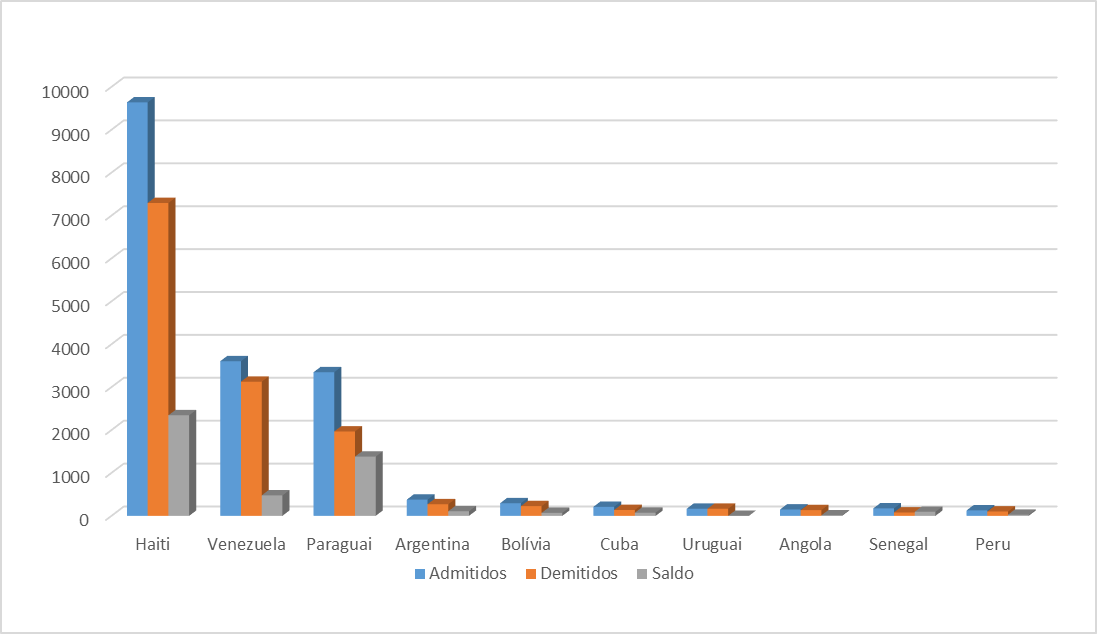
Source: OBMigra (2020), based on data from the harmonized database RAIS-CTPS-CAGED and the Digital System of Tax, Social Security and Labor Obligations (eSocial).
GRAPH 6
Movements of migrant workers in the formal labor market, by major cities - February 2021
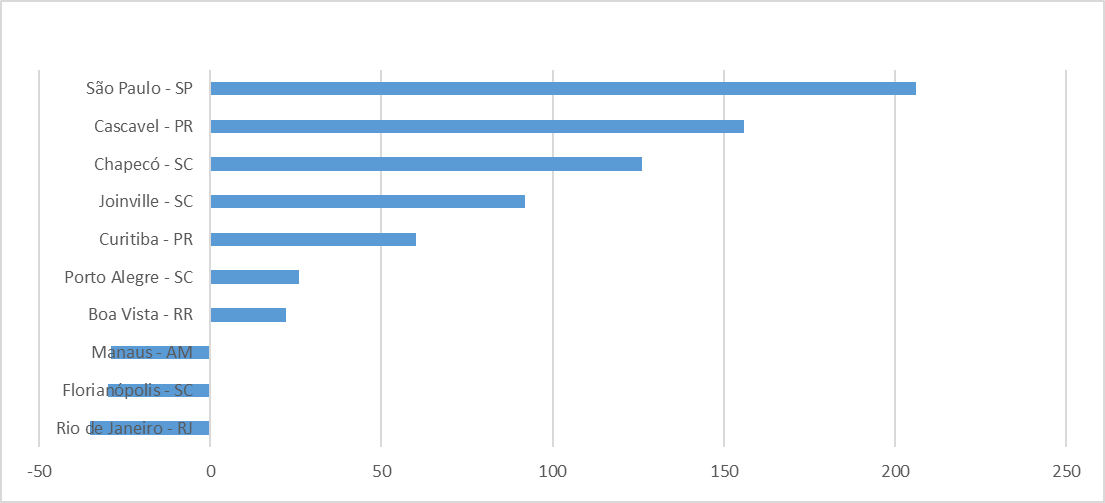
Source: OBMigra (2020), based on data from the harmonized database RAIS-CTPS-CAGED and the Digital System of Tax, Social Security and Labor Obligations (eSocial).
SISMIGRA
SisMigra (National Migration Registry System)
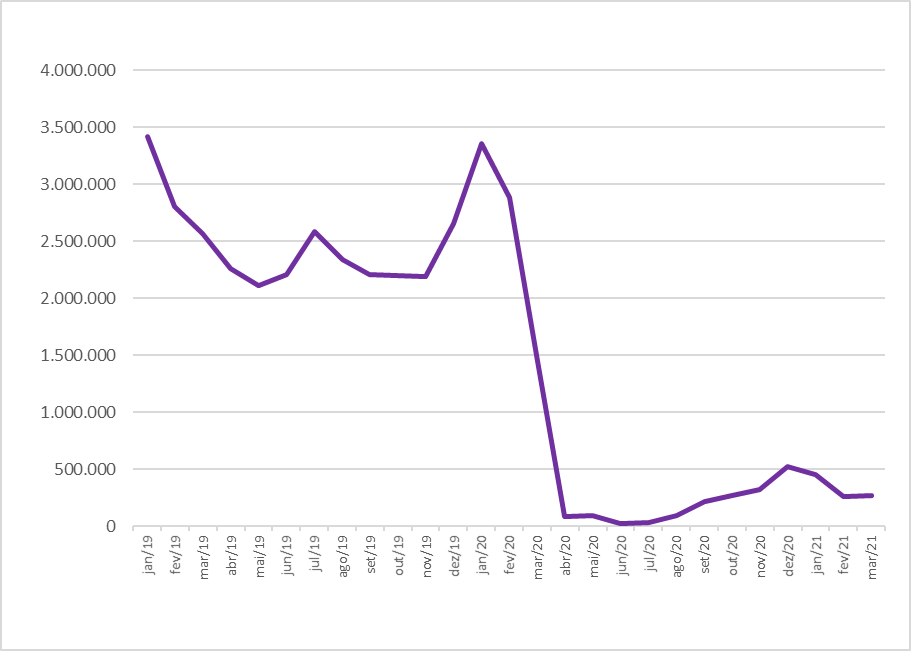
In March, the regularization of residence for immigrants exhibited a modest recovery compared to the previous month. However, it remained lower than the levels observed a year ago, which coincided with the onset of the health crisis and the subsequent implementation of restrictions on international mobility (Graph 7).
The sex ratio reveals a predominance of males, particularly among the Chinese, Colombians, and Peruvians (Graph 8).
Observing the main countries of birth, shown on Map 1, the spotlight continues to be on Venezuelans and Haitians, who mostly arrived in Brazil through the northern borders.
GRAPH 7
Number of immigrant registrations, by month of registration - Brazil, 2019-2021
Source: OBMigra (2021), based on data from the Brazilian Federal Police, National Migration Registry System (SISMIGRA).
GRAPH 8
Number of immigrant registrations, by sex, according to main countries - Brazil, March 2021
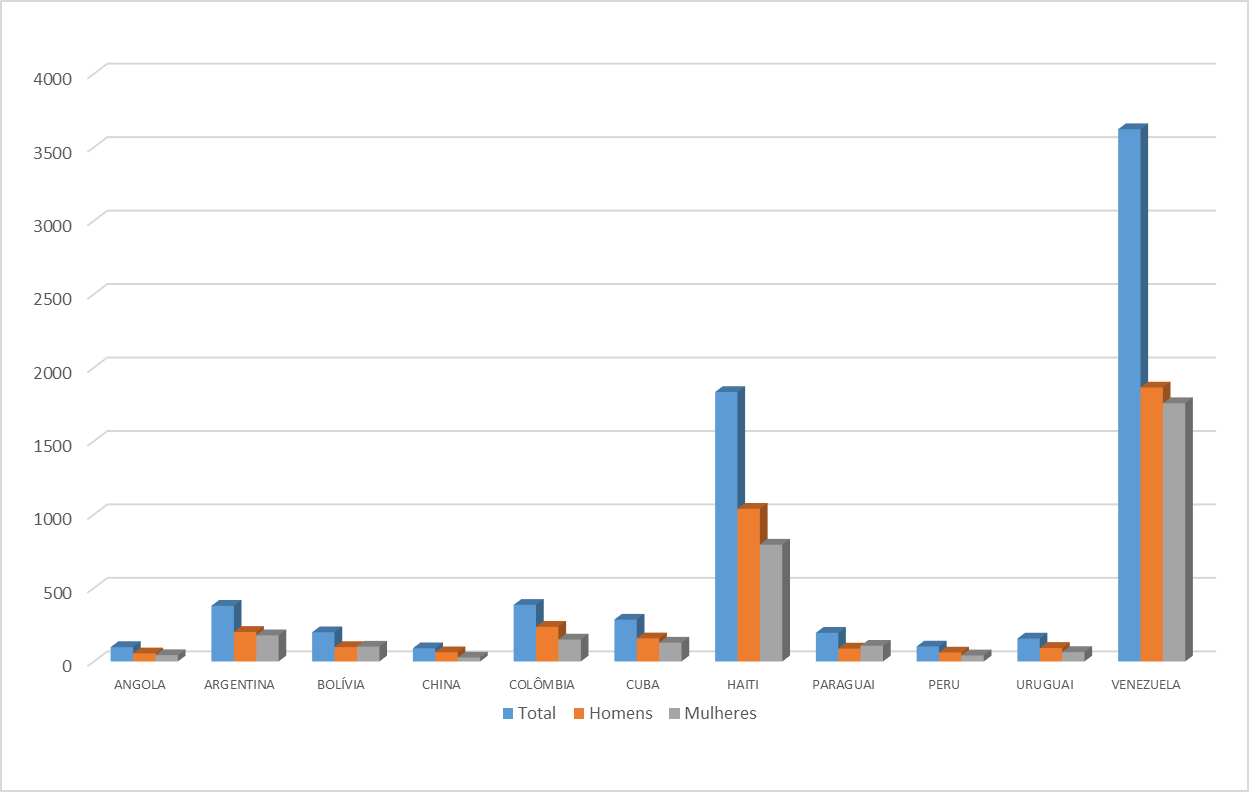
Source: OBMigra (2021), based on data from the Brazilian Federal Police, National Migration Registry System (SISMIGRA).
MAP 1
Number of immigrant registrations, by main countries of birth, March 2021
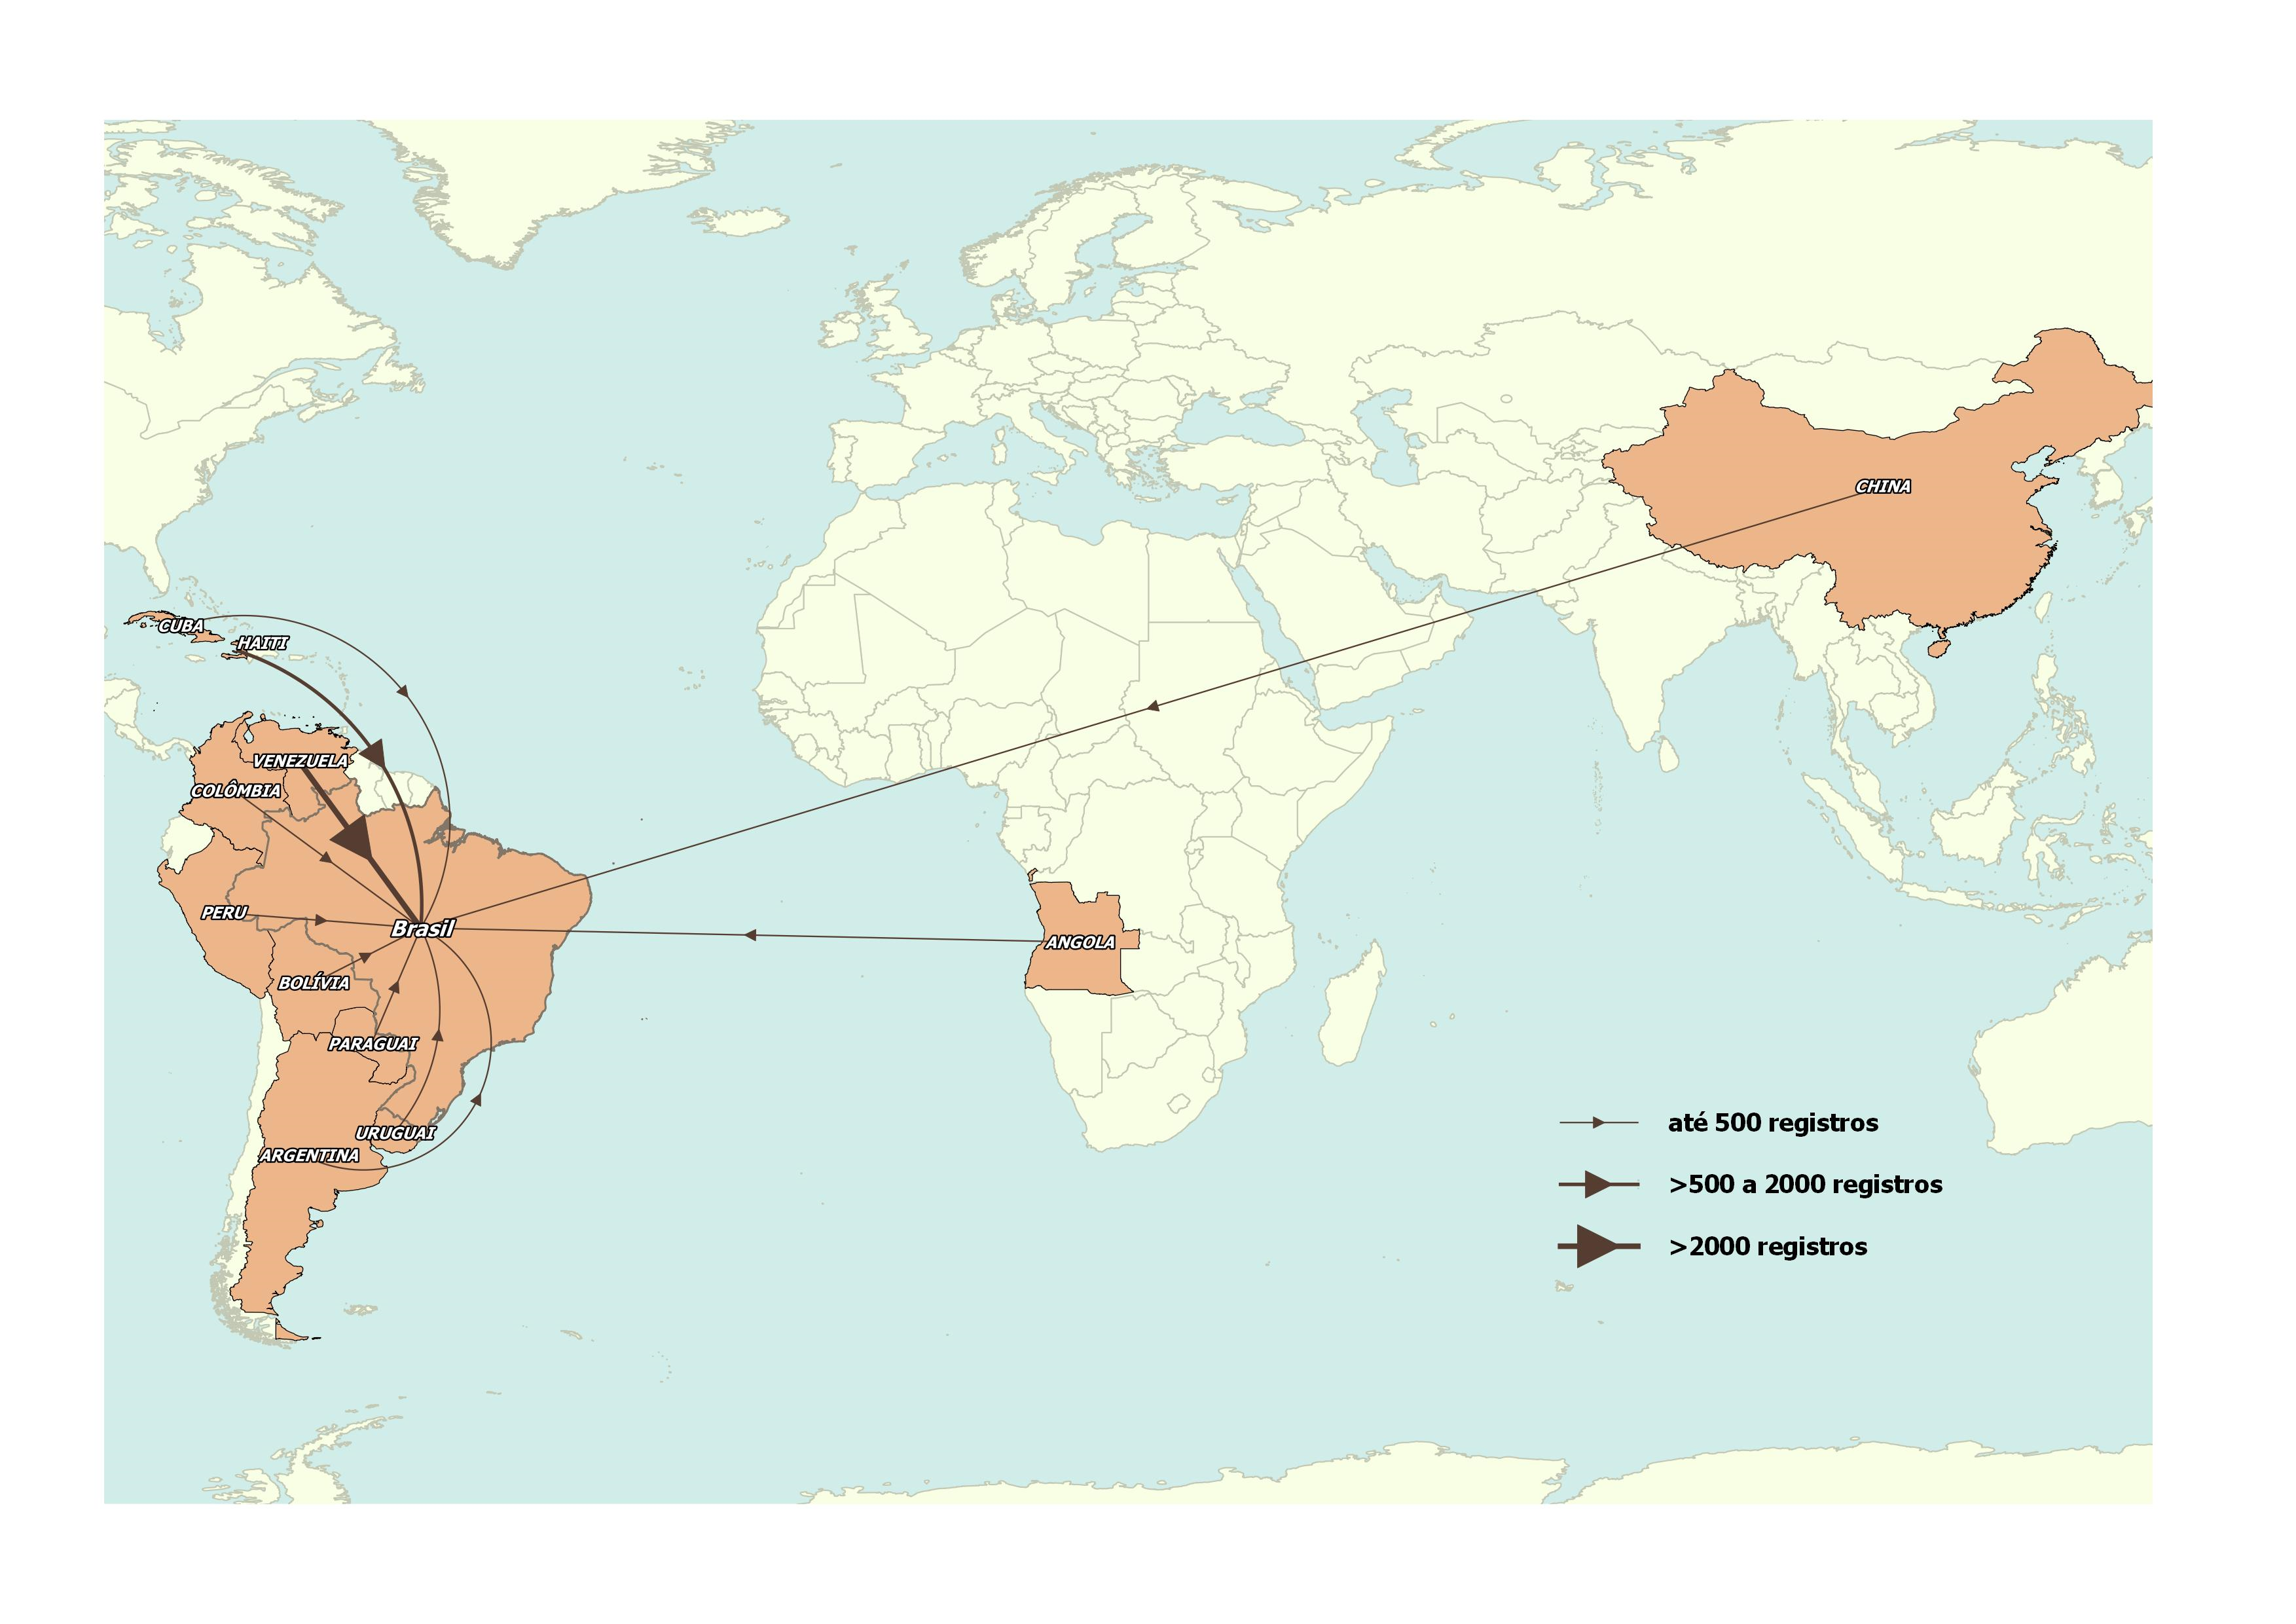
Source: OBMigra (2021), based on data from the Brazilian Federal Police, National Migration Registry System (SISMIGRA).
STI
STI (International Traffic System)
Cross-border movement of people remained practically stable in relation to February. However, the balance was negative, with the number of people leaving the country exceeding the number of arrivals (Graph 9), indicating that the health crisis continues to strongly affect the physical mobility of the population on an international scale.
This negative balance was determined by the higher number of Brazilians leaving, as shown in Graph 10.
GRAPH 9
Cross-border movements, by month of registration, Brazil 2019/2021
Source: OBMigra (2021), based on data from the Brazilian Federal Police, STI.
GRAPH 10
Cross-border entries and exits from Brazilian territory, according to classification typologies - Brazil, March 2021
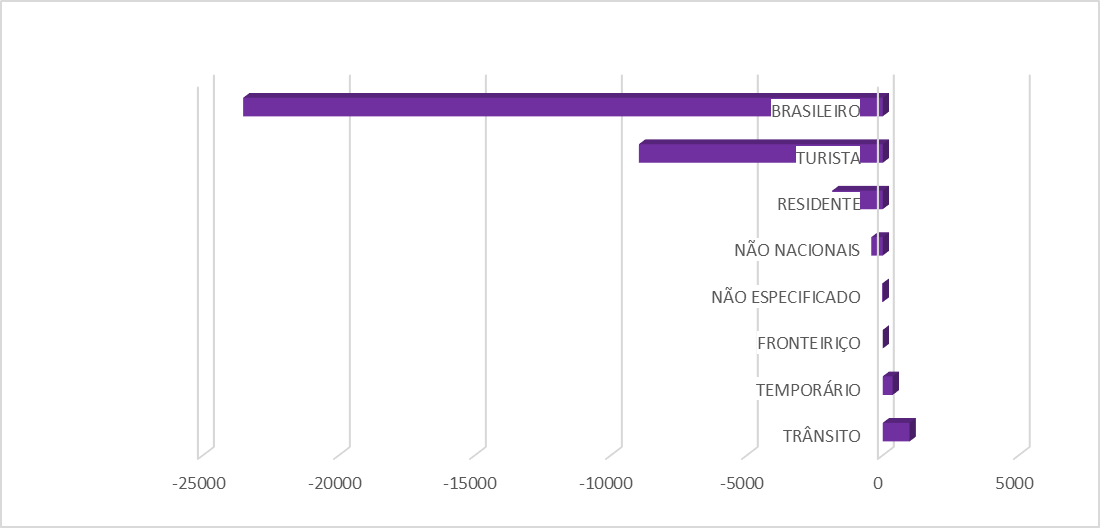
Source: OBMigra (2021), based on data from the Brazilian Federal Police, STI
STI-MAR
STI-MAR (International Traffic System - Warning and Restrictions Module)
The number of applications for recognition of refugee status in March showed a slight recovery. However, it remains at levels well below those observed in March 2020, reflecting the effect of the pandemic on this type of administrative record (Graph 11).
The cities of Pacaraima/RR and Bonfim/RR registered the highest number of asylum claims in March. The most negative figure comes from the city of Boa Vista/RR, with only one application registered in the month of reference (Graph 12).
Venezuelans and Haitians remained the top nationalities registering claims for recognition of refugee status (Map 2).
GRAPH 11
Number of asylum claims, by month of registration - Brazil, 2019-2021
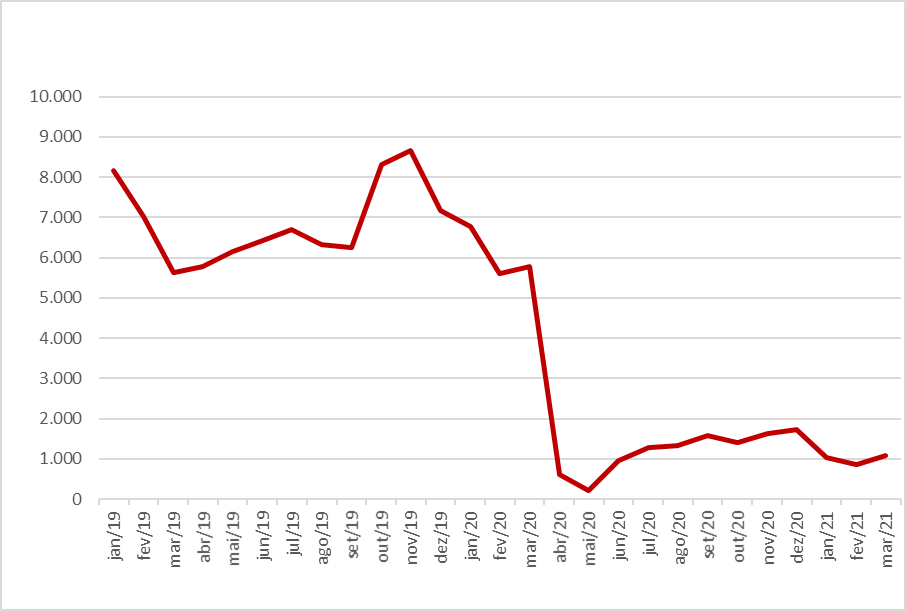
Source: OBMigra (2021), based on data from the Brazilian Federal Police, International Traffic System - Warning and Restrictions Module (STI-MAR).
GRAPH 12
Number of asylum claims, according to main municipalities - Brazil, February 2021
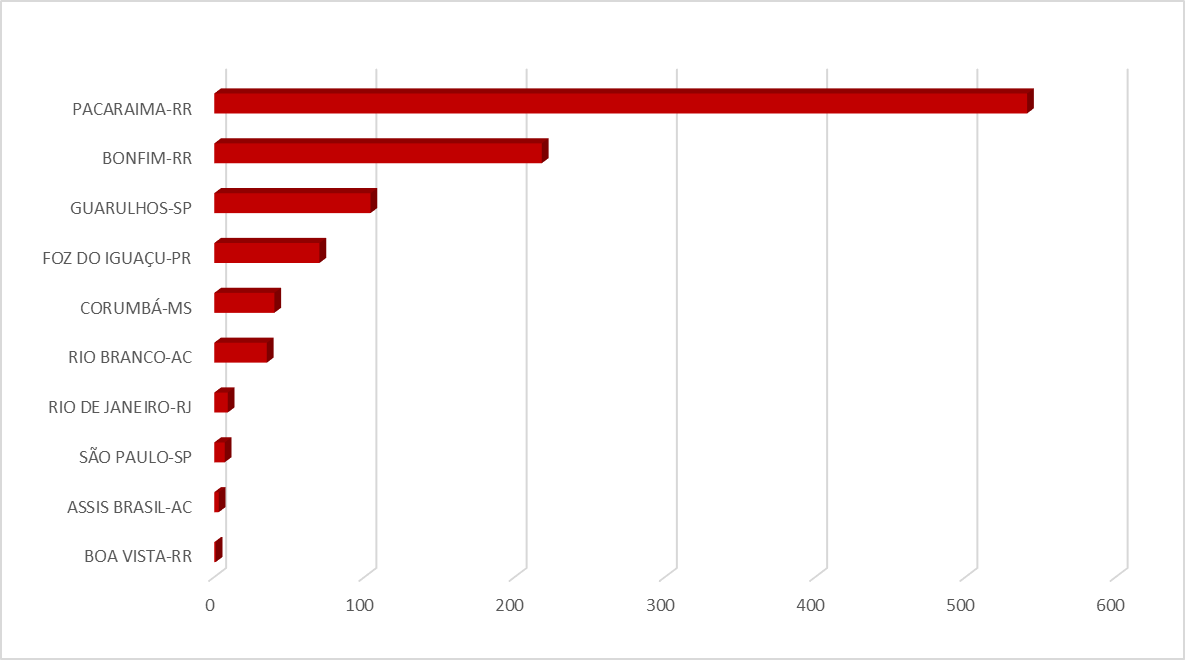
Source: OBMigra (2021), based on data from the Brazilian Federal Police, International Traffic System - Warning and Restrictions Module (STI-MAR).
MAP 2
Number of asylum claims, by main countries of nationality, March 2021
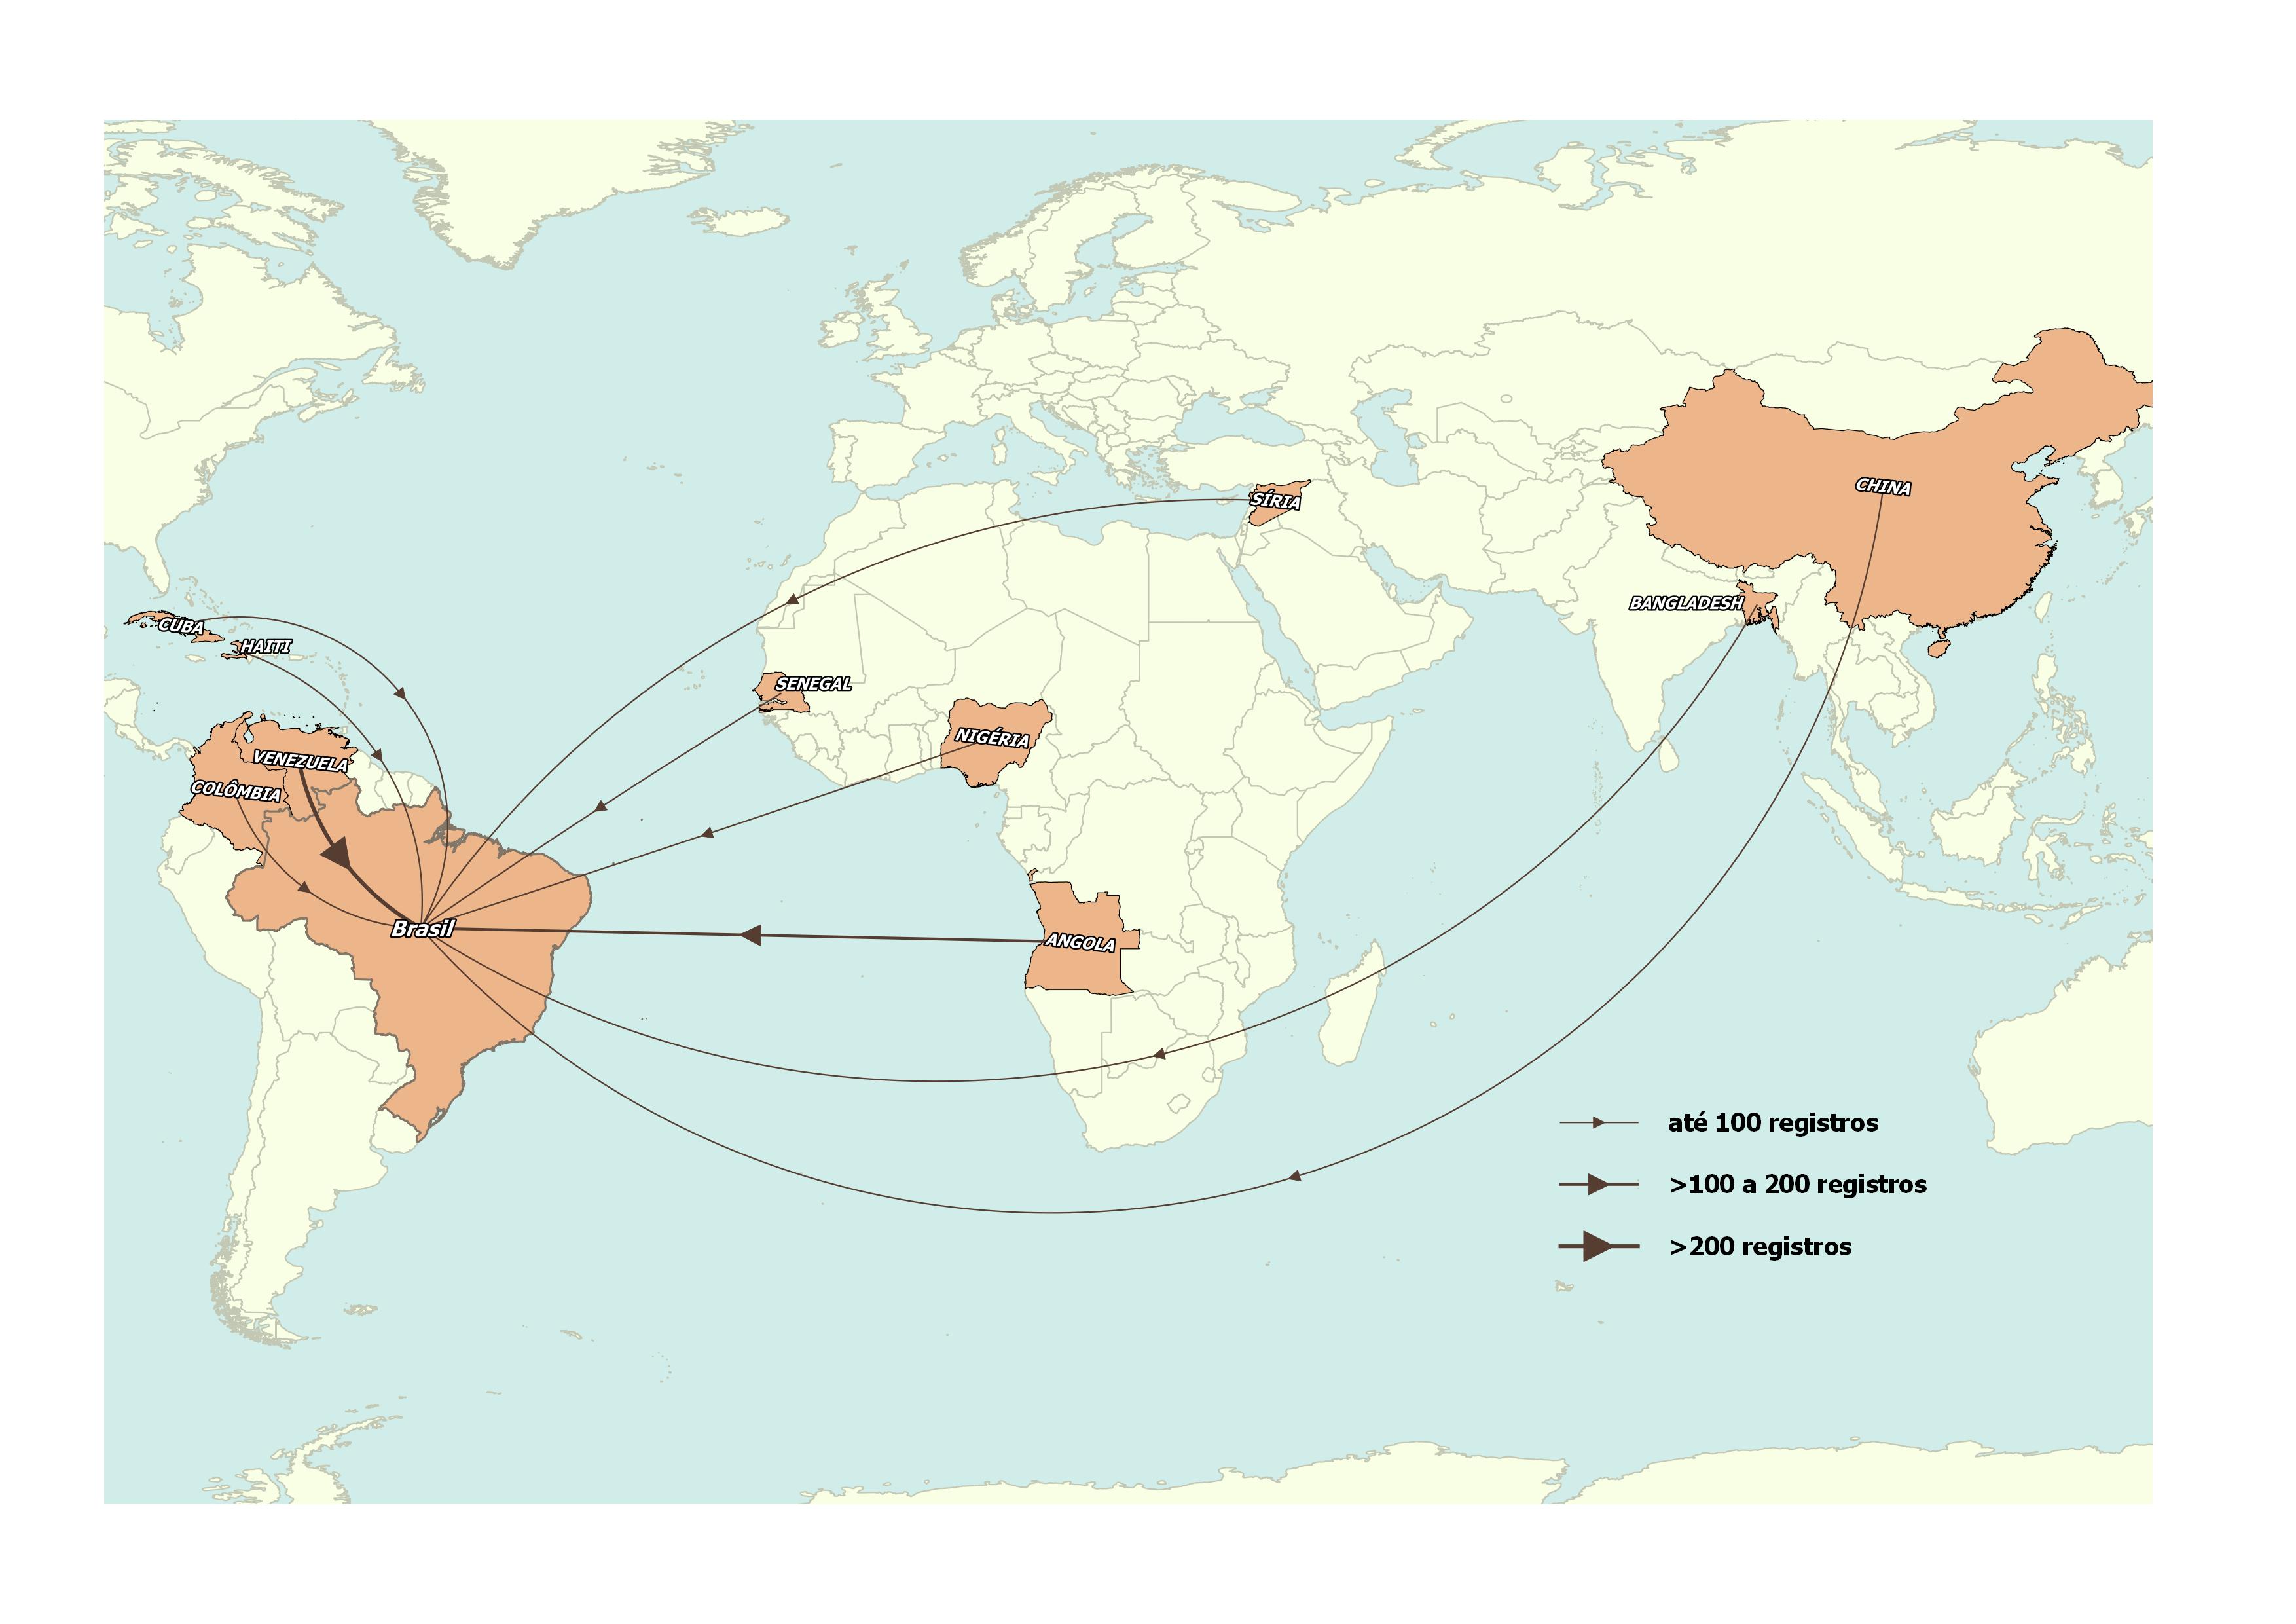
Source: OBMigra (2021), based on data from the Brazilian Federal Police, International Traffic System - Warning and Restrictions Module (STI-MAR).
COMO CITAR
The reproduction of this text and the data contained therein is permitted, provided that proper citation of the source is included. Reproduction for commercial use is prohibited.
How to cite this text:
| CAVALCANTI, L; OLIVEIRA, T; FURTADO, A; DICK, P; QUINTINO, F; MACEDO, M Acompanhamento de fluxo e empregabilidade dos imigrantes no Brasil: Relatório Mensal do OBMigra Ano 2, Número 3, março de 2021/ Observatório das Migrações Internacionais; Brasília, DF: OBMigra, 2021. Available at: https://portaldeimigracao.mj.gov.br/pt/dados/relatorios-mensais |