CGIL
CGIL (General Coordination of Labor Immigration)
The pattern of residence permits for work and investment purposes in the year shows a certain instability, and it has not been possible to identify a clear trend being consolidated. After a reduction in the number of grants in January and recovery in the two following months, April once again registered a drop in the number of authorizations (Graph 1).
The nationalities that benefited most from the permits were from the Philippines, the United States, and China. These activities are primarily associated with maritime labor and technical assistance work, frequently conducted without employment ties in the country (Graph 2).
Among skilled workers, professionals in the sciences and arts, as well as managers, who hold permits to work, emerged prominently (Graph 3).
GRAPH 1
Number of work permits for labor and investment purposes, by month of registration - Brazil, 2019-2021
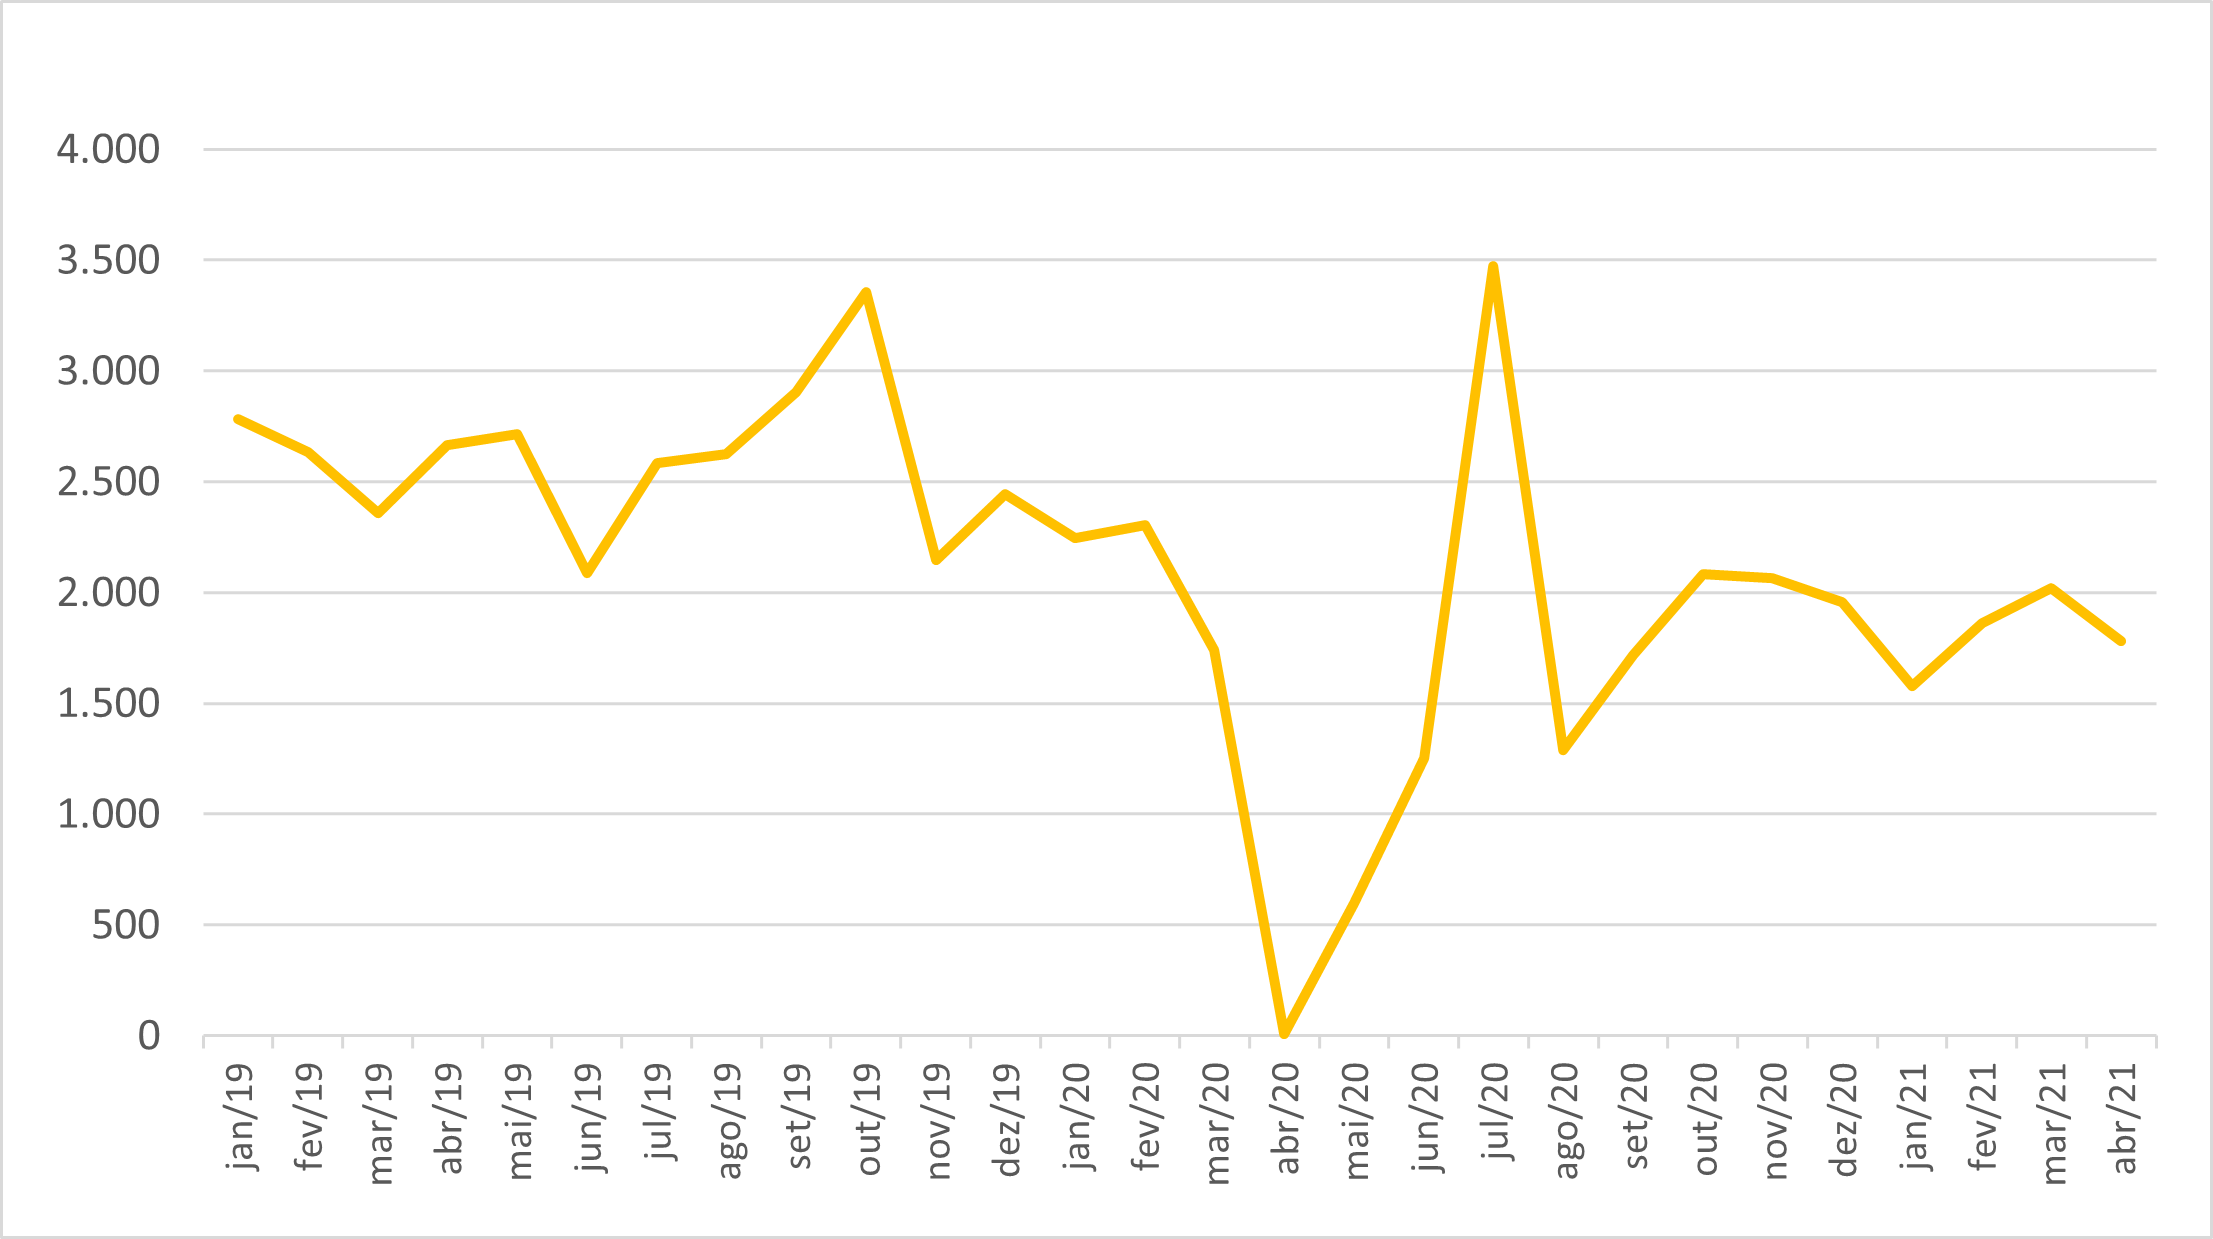
Source: OBMigra (2021), based on data from the General Coordination of Labor Immigration/Ministry of Justice and Public Security.
GRAPH 2
Number of permits granted, by main countries - Brazil, April/21
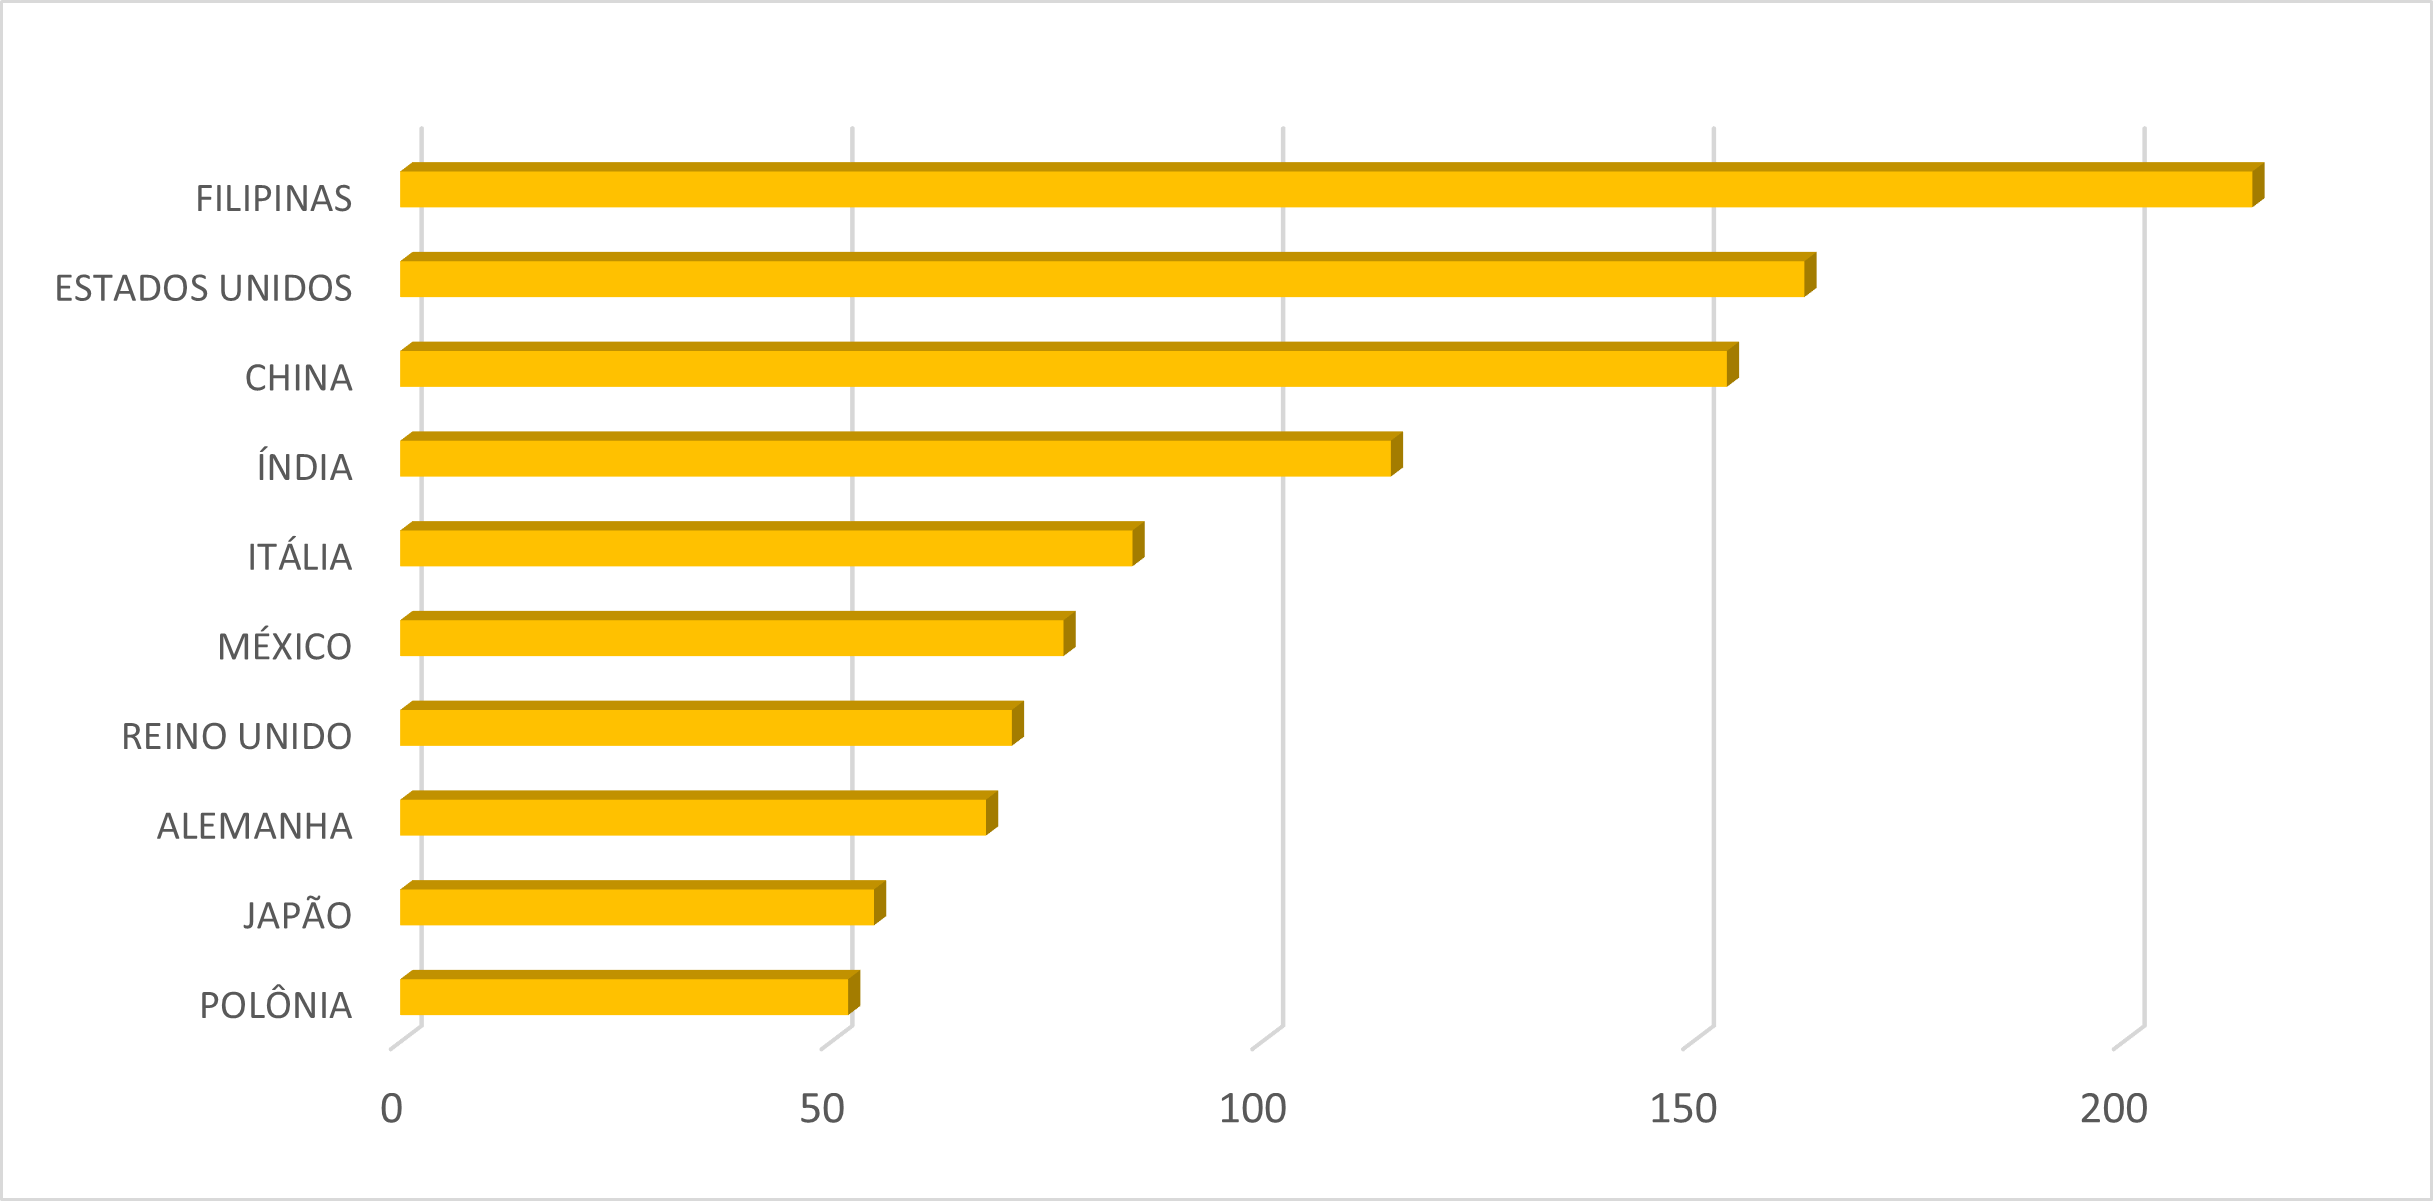
Source: OBMigra (2021), based on data from the General Coordination of Labor Immigration/Ministry of Justice and Public Security.
GRAPH 3
Number of permits granted to skilled workers, by occupational groups, Brazil, April/202
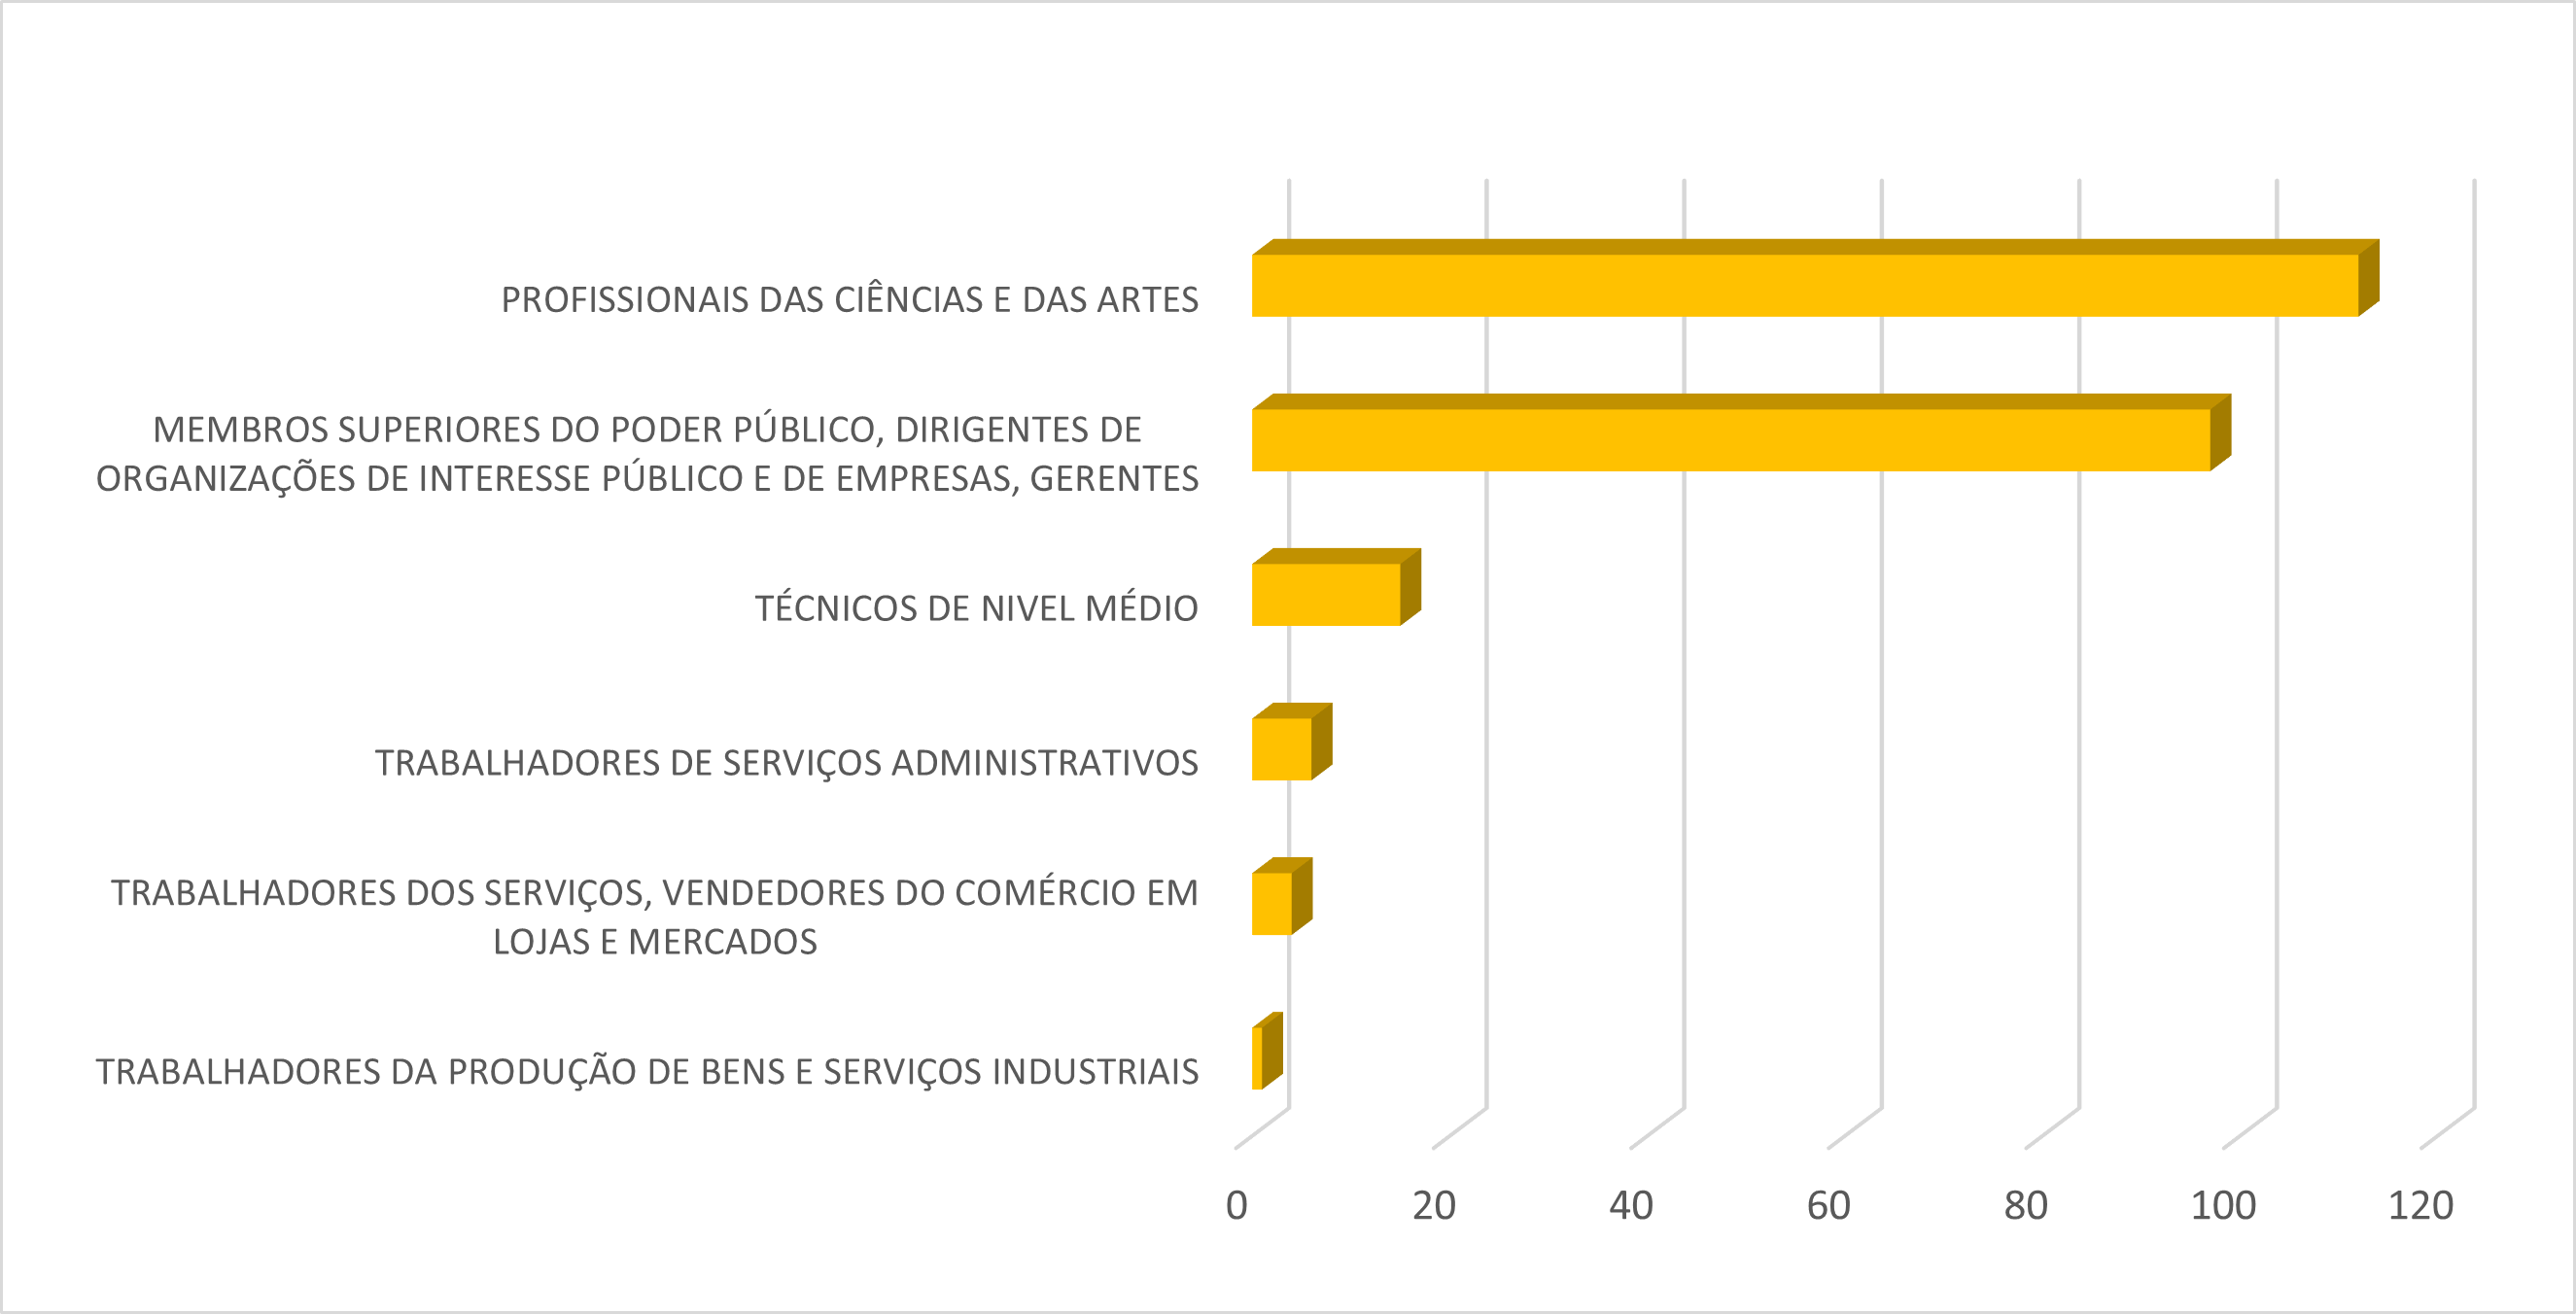
Source: OBMigra (2021), based on data from the General Coordination of Labor Immigration/Ministry of Justice and Public Security.
CTPS/RAIS/NOVO CAGED
Harmonized database Work and Social Security Card (CTPS)/Annual Report of Social Information (RAIS)/New General Register of Employed and Unemployed Persons (CAGED)
The movement of the immigrant labor force in March exceeded the levels observed in the previous month and March 2020. However, in terms of job creation, a decrease of -47.1% was registered compared to February, as depicted in Graph 4.
In March, Haitians and Venezuelans were the main nationalities moving into the formal labor market. It is worth noting that the largest number of job openings were created for Venezuelans (Graph 5).
The states of the South Region were the ones that created the most jobs for immigrant labor, being responsible for more than 95.0% of the jobs generated (Map 1).
GRAPH 4
Jobs created for immigrants, by month - Brazil, 2019/2021
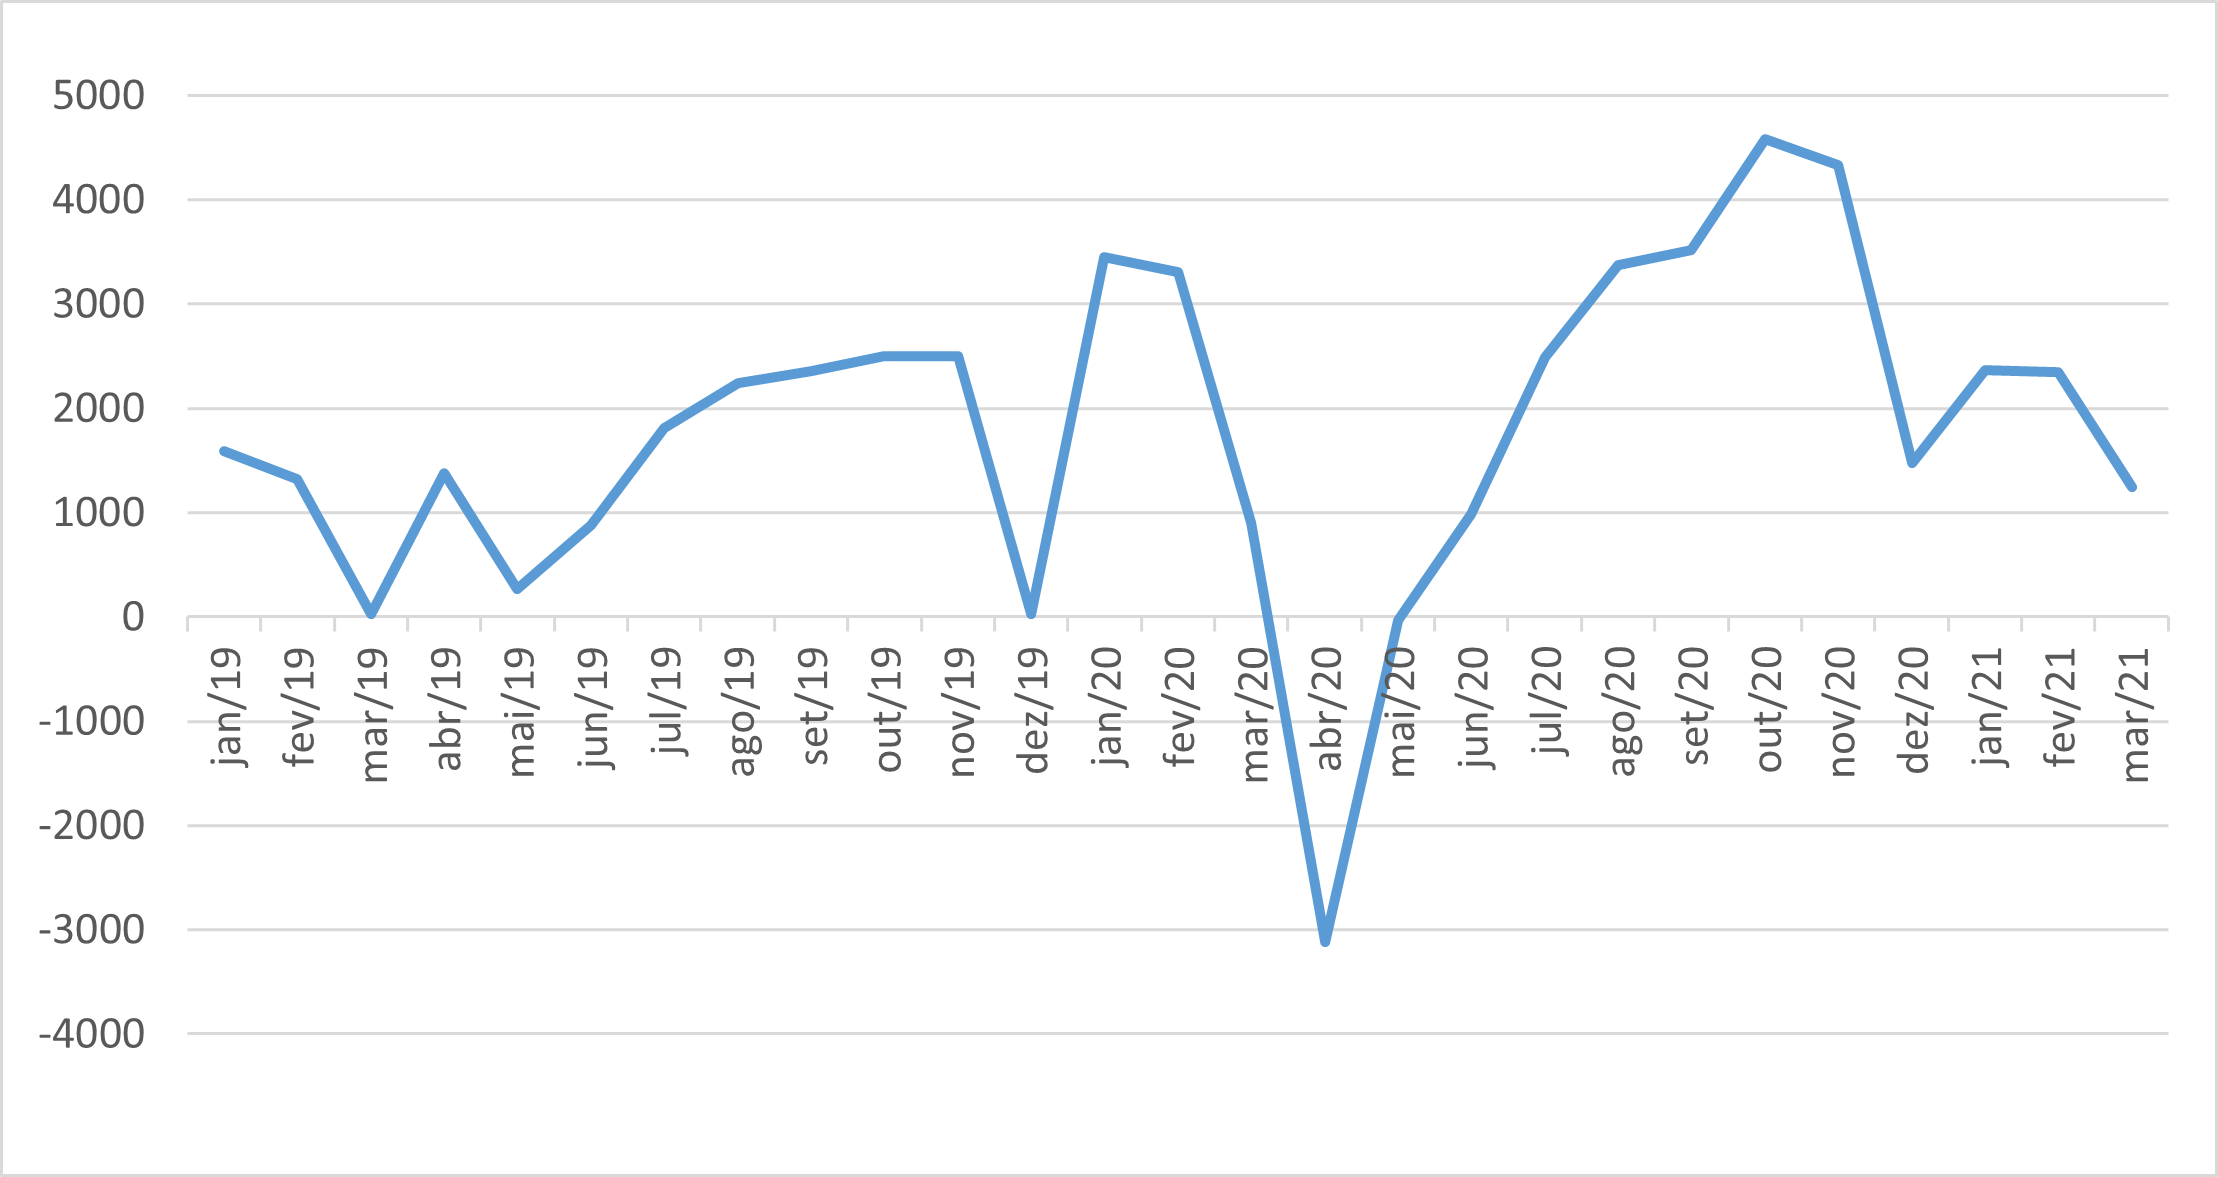
Source: OBMigra (2021), based on data from the harmonized database RAIS-CTPS-CAGED and the Digital System of Tax, Social Security and Labor Obligations (eSocial).
GRAPH 5
Movements of migrant workers in the formal labor market, by main countries - Brazil, March 2021
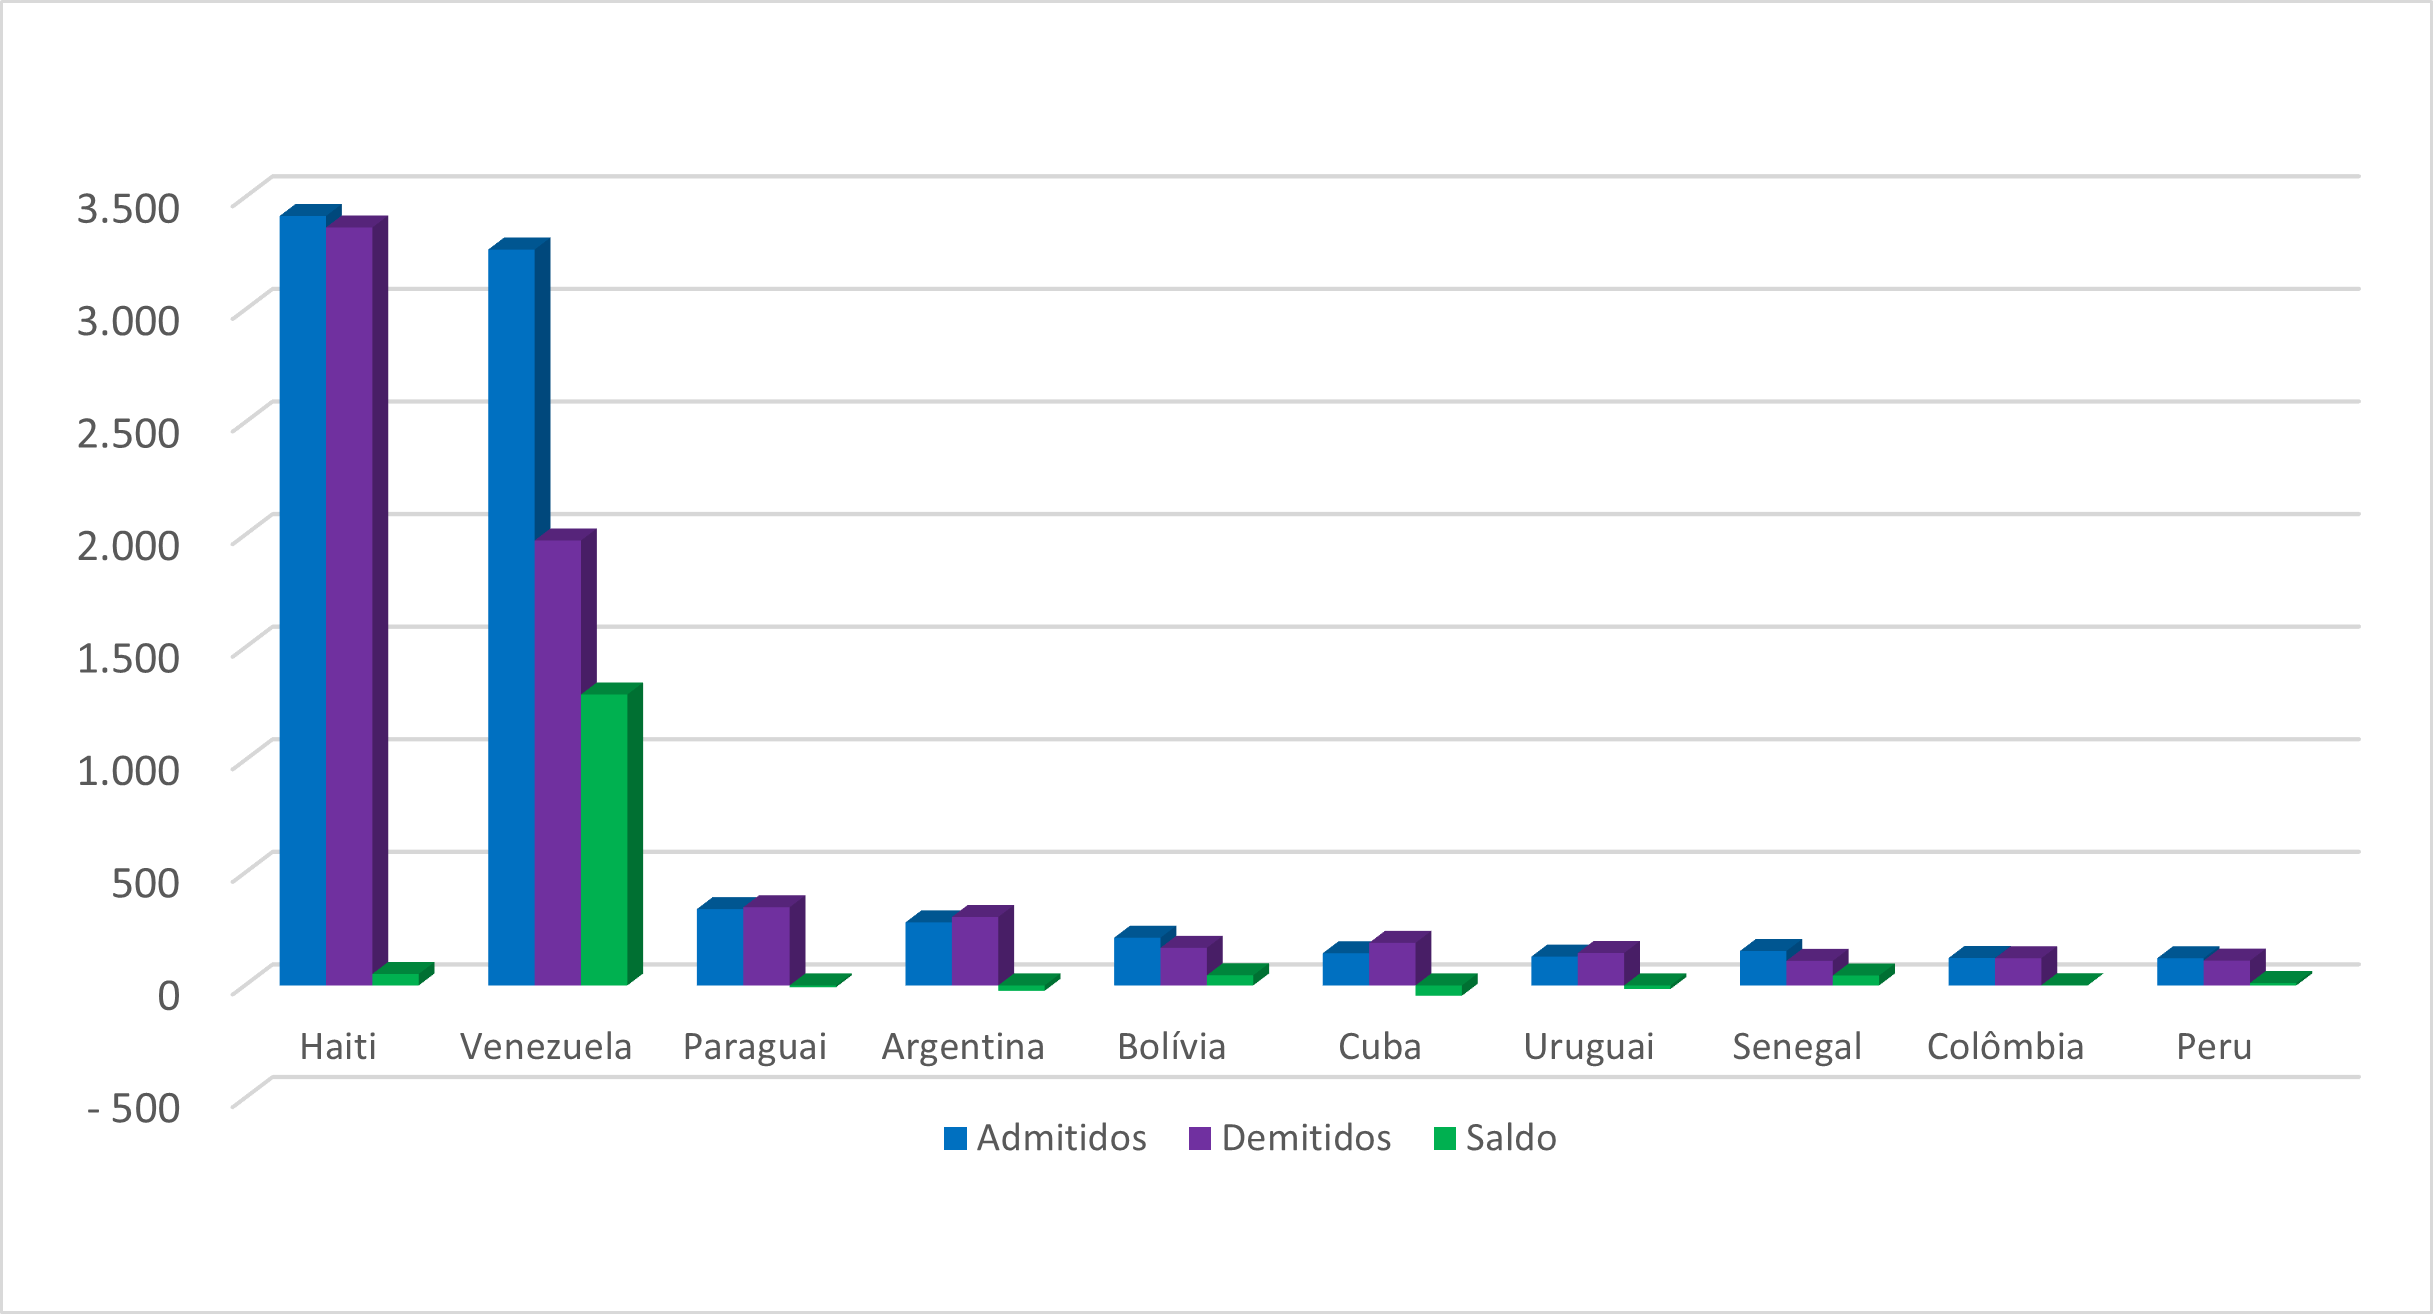
Source: OBMigra (2021), based on data from the harmonized database RAIS-CTPS-CAGED and the Digital System of Tax, Social Security and Labor Obligations (eSocial)
MAP 1
Number of jobs created for immigrants in the formal market, according to Federation Unit - Brazil, March 2021
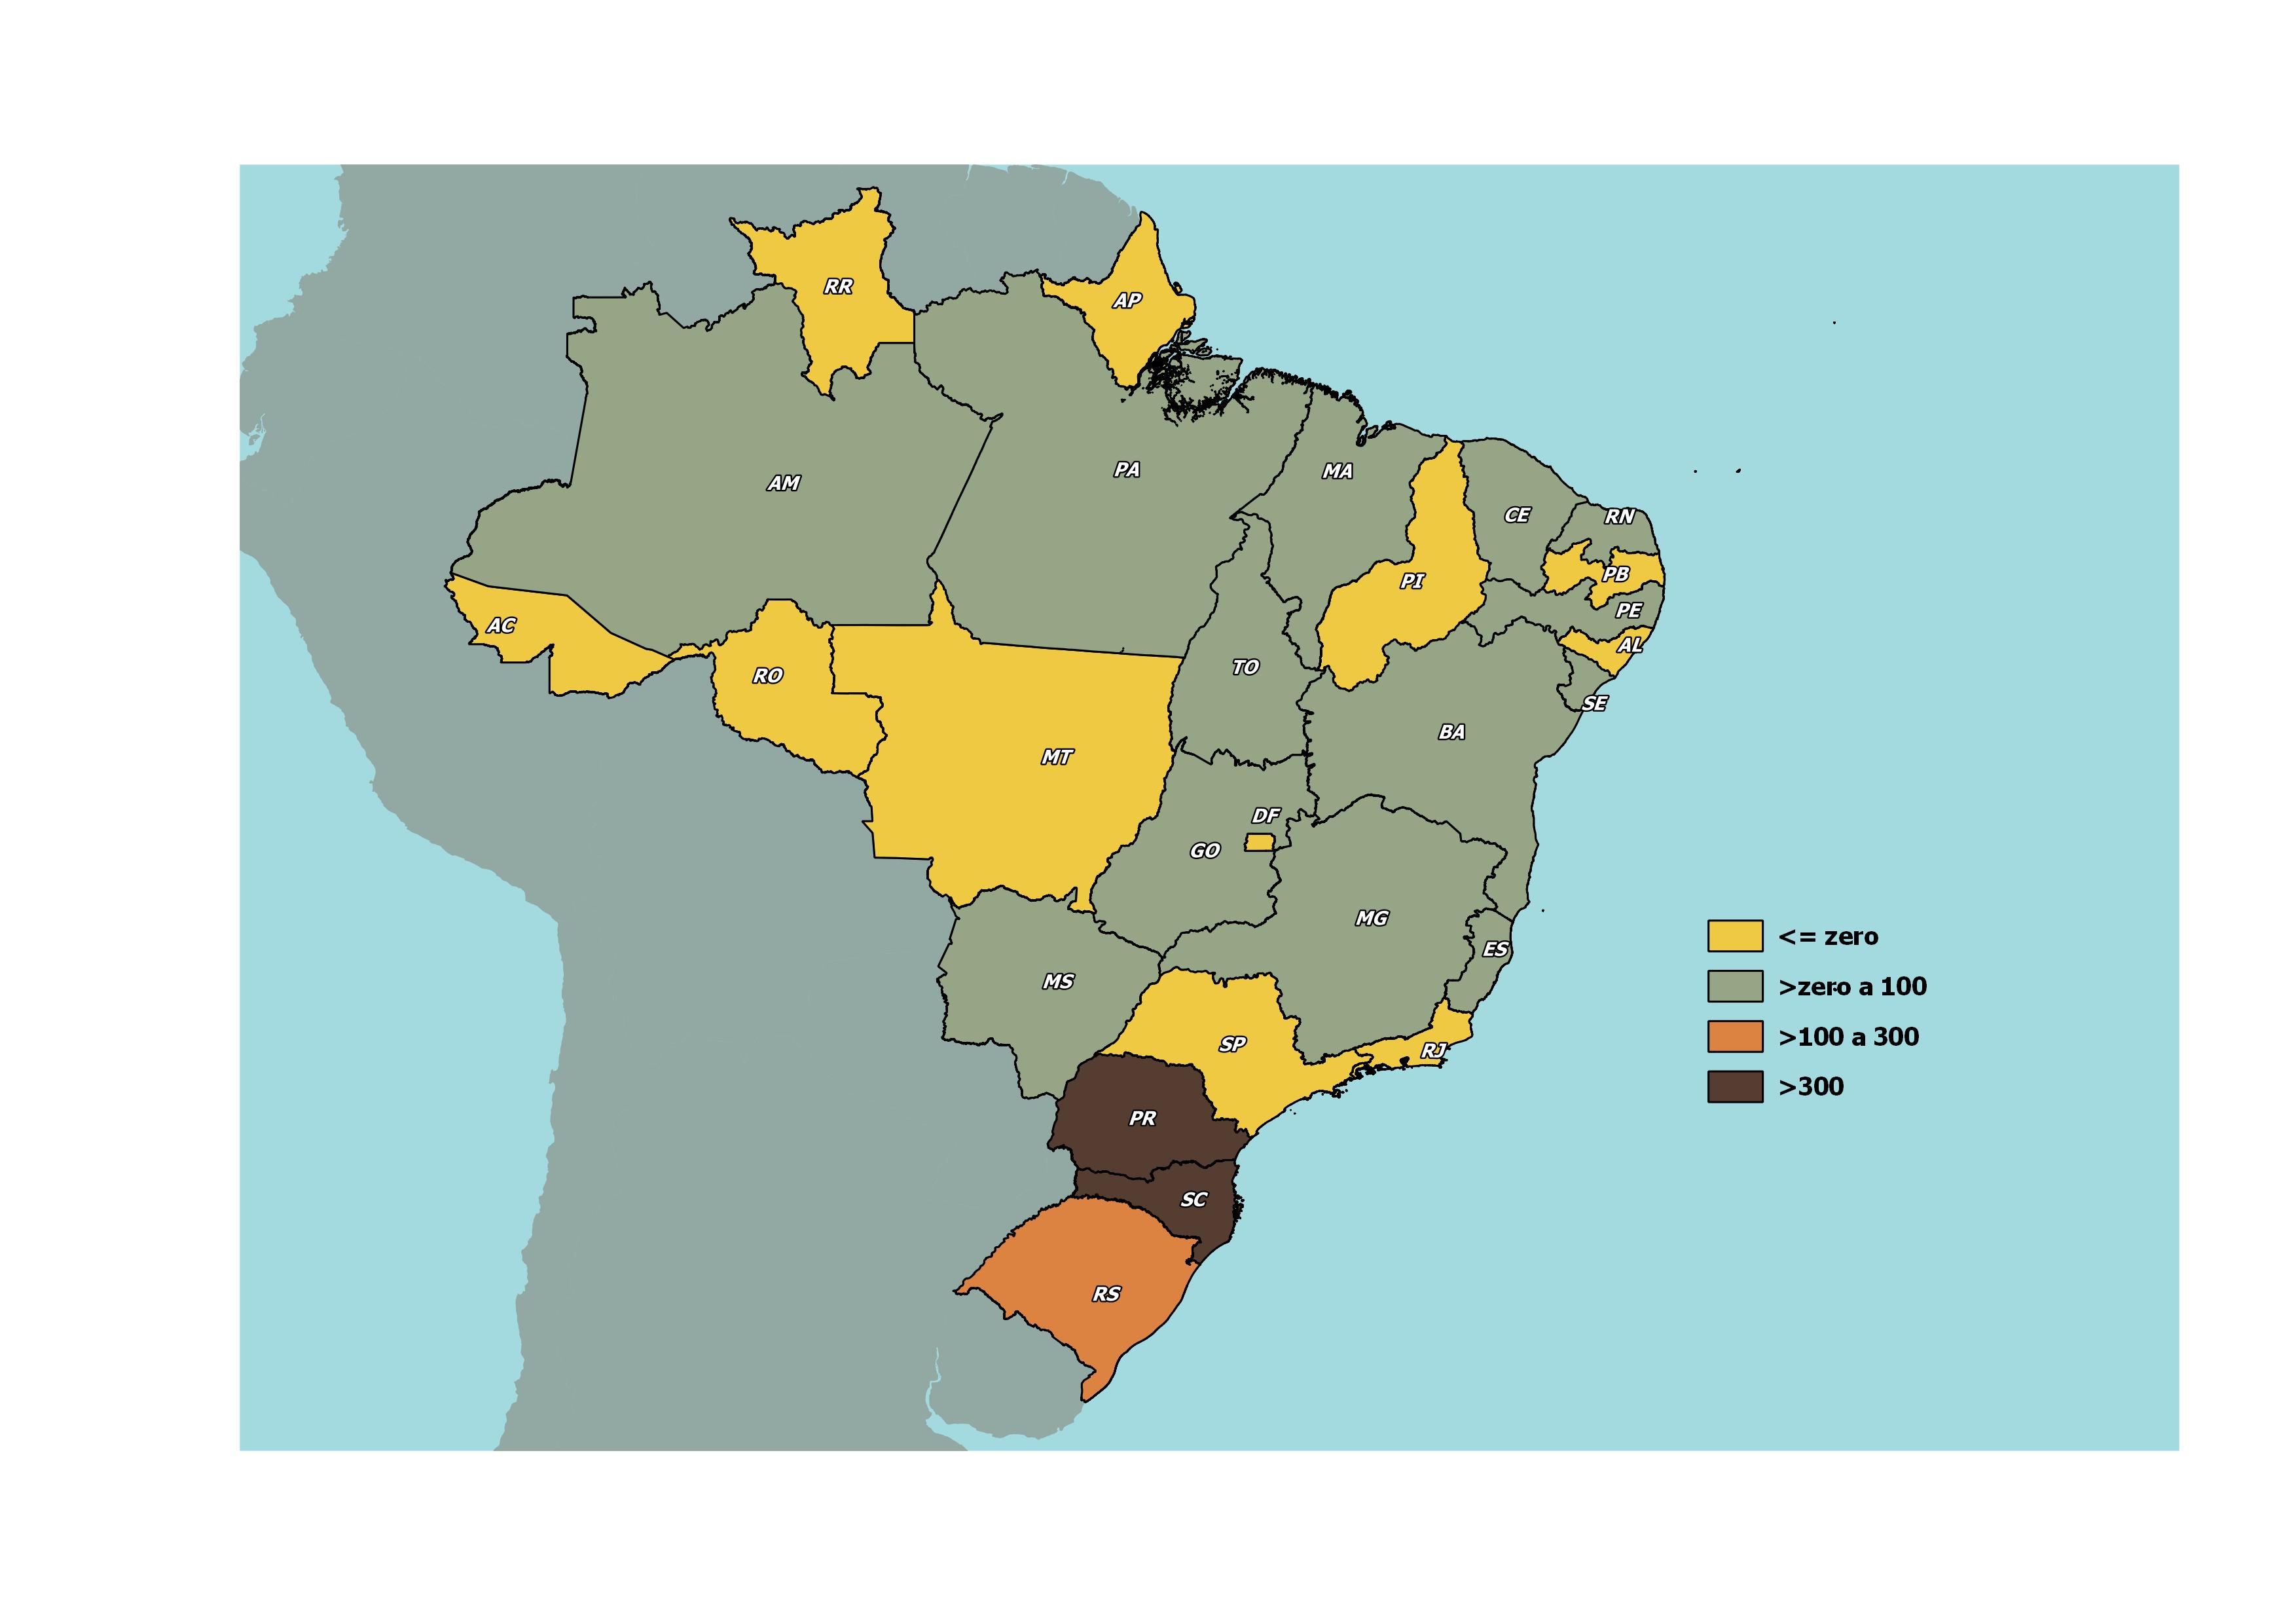
Source: OBMigra (2021), based on data from the harmonized database RAIS-CTPS-CAGED and the Digital System of Tax, Social Security and Labor Obligations (eSocial).
SISMIGRA
SisMigra (National Migration Registry System)
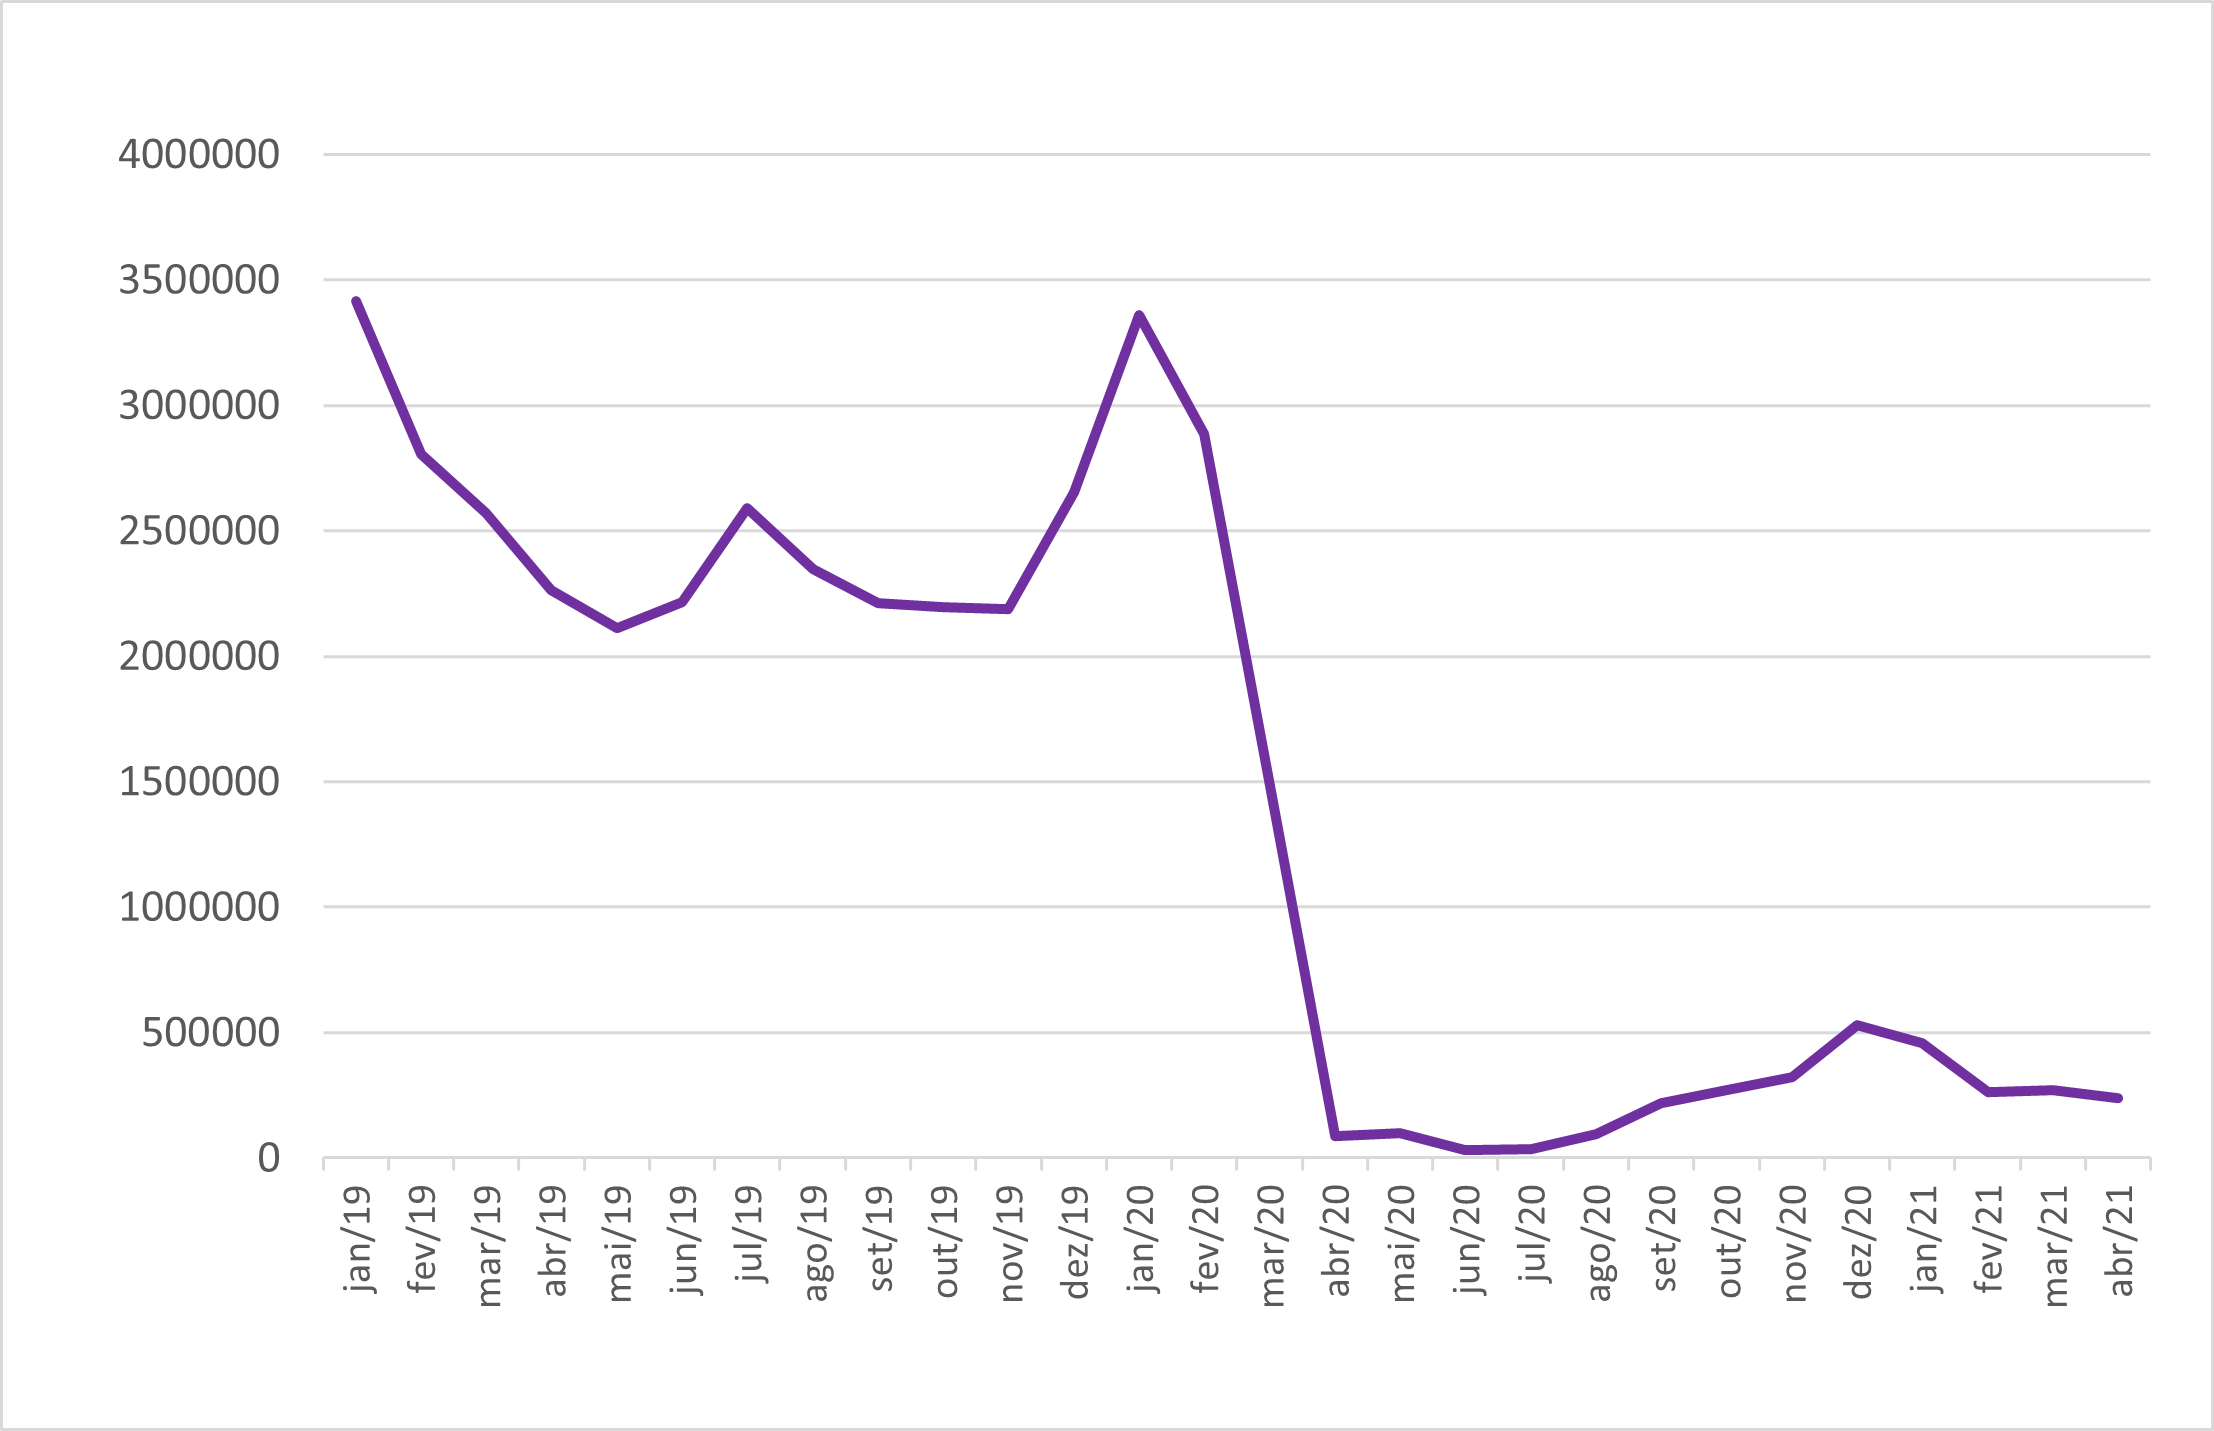
The regularization of residence for immigrants continues its slow process of recovery, as shown in Graph 6. In the figure, it is possible to observe that the numbers of residence permits are still much lower than before the health crisis.
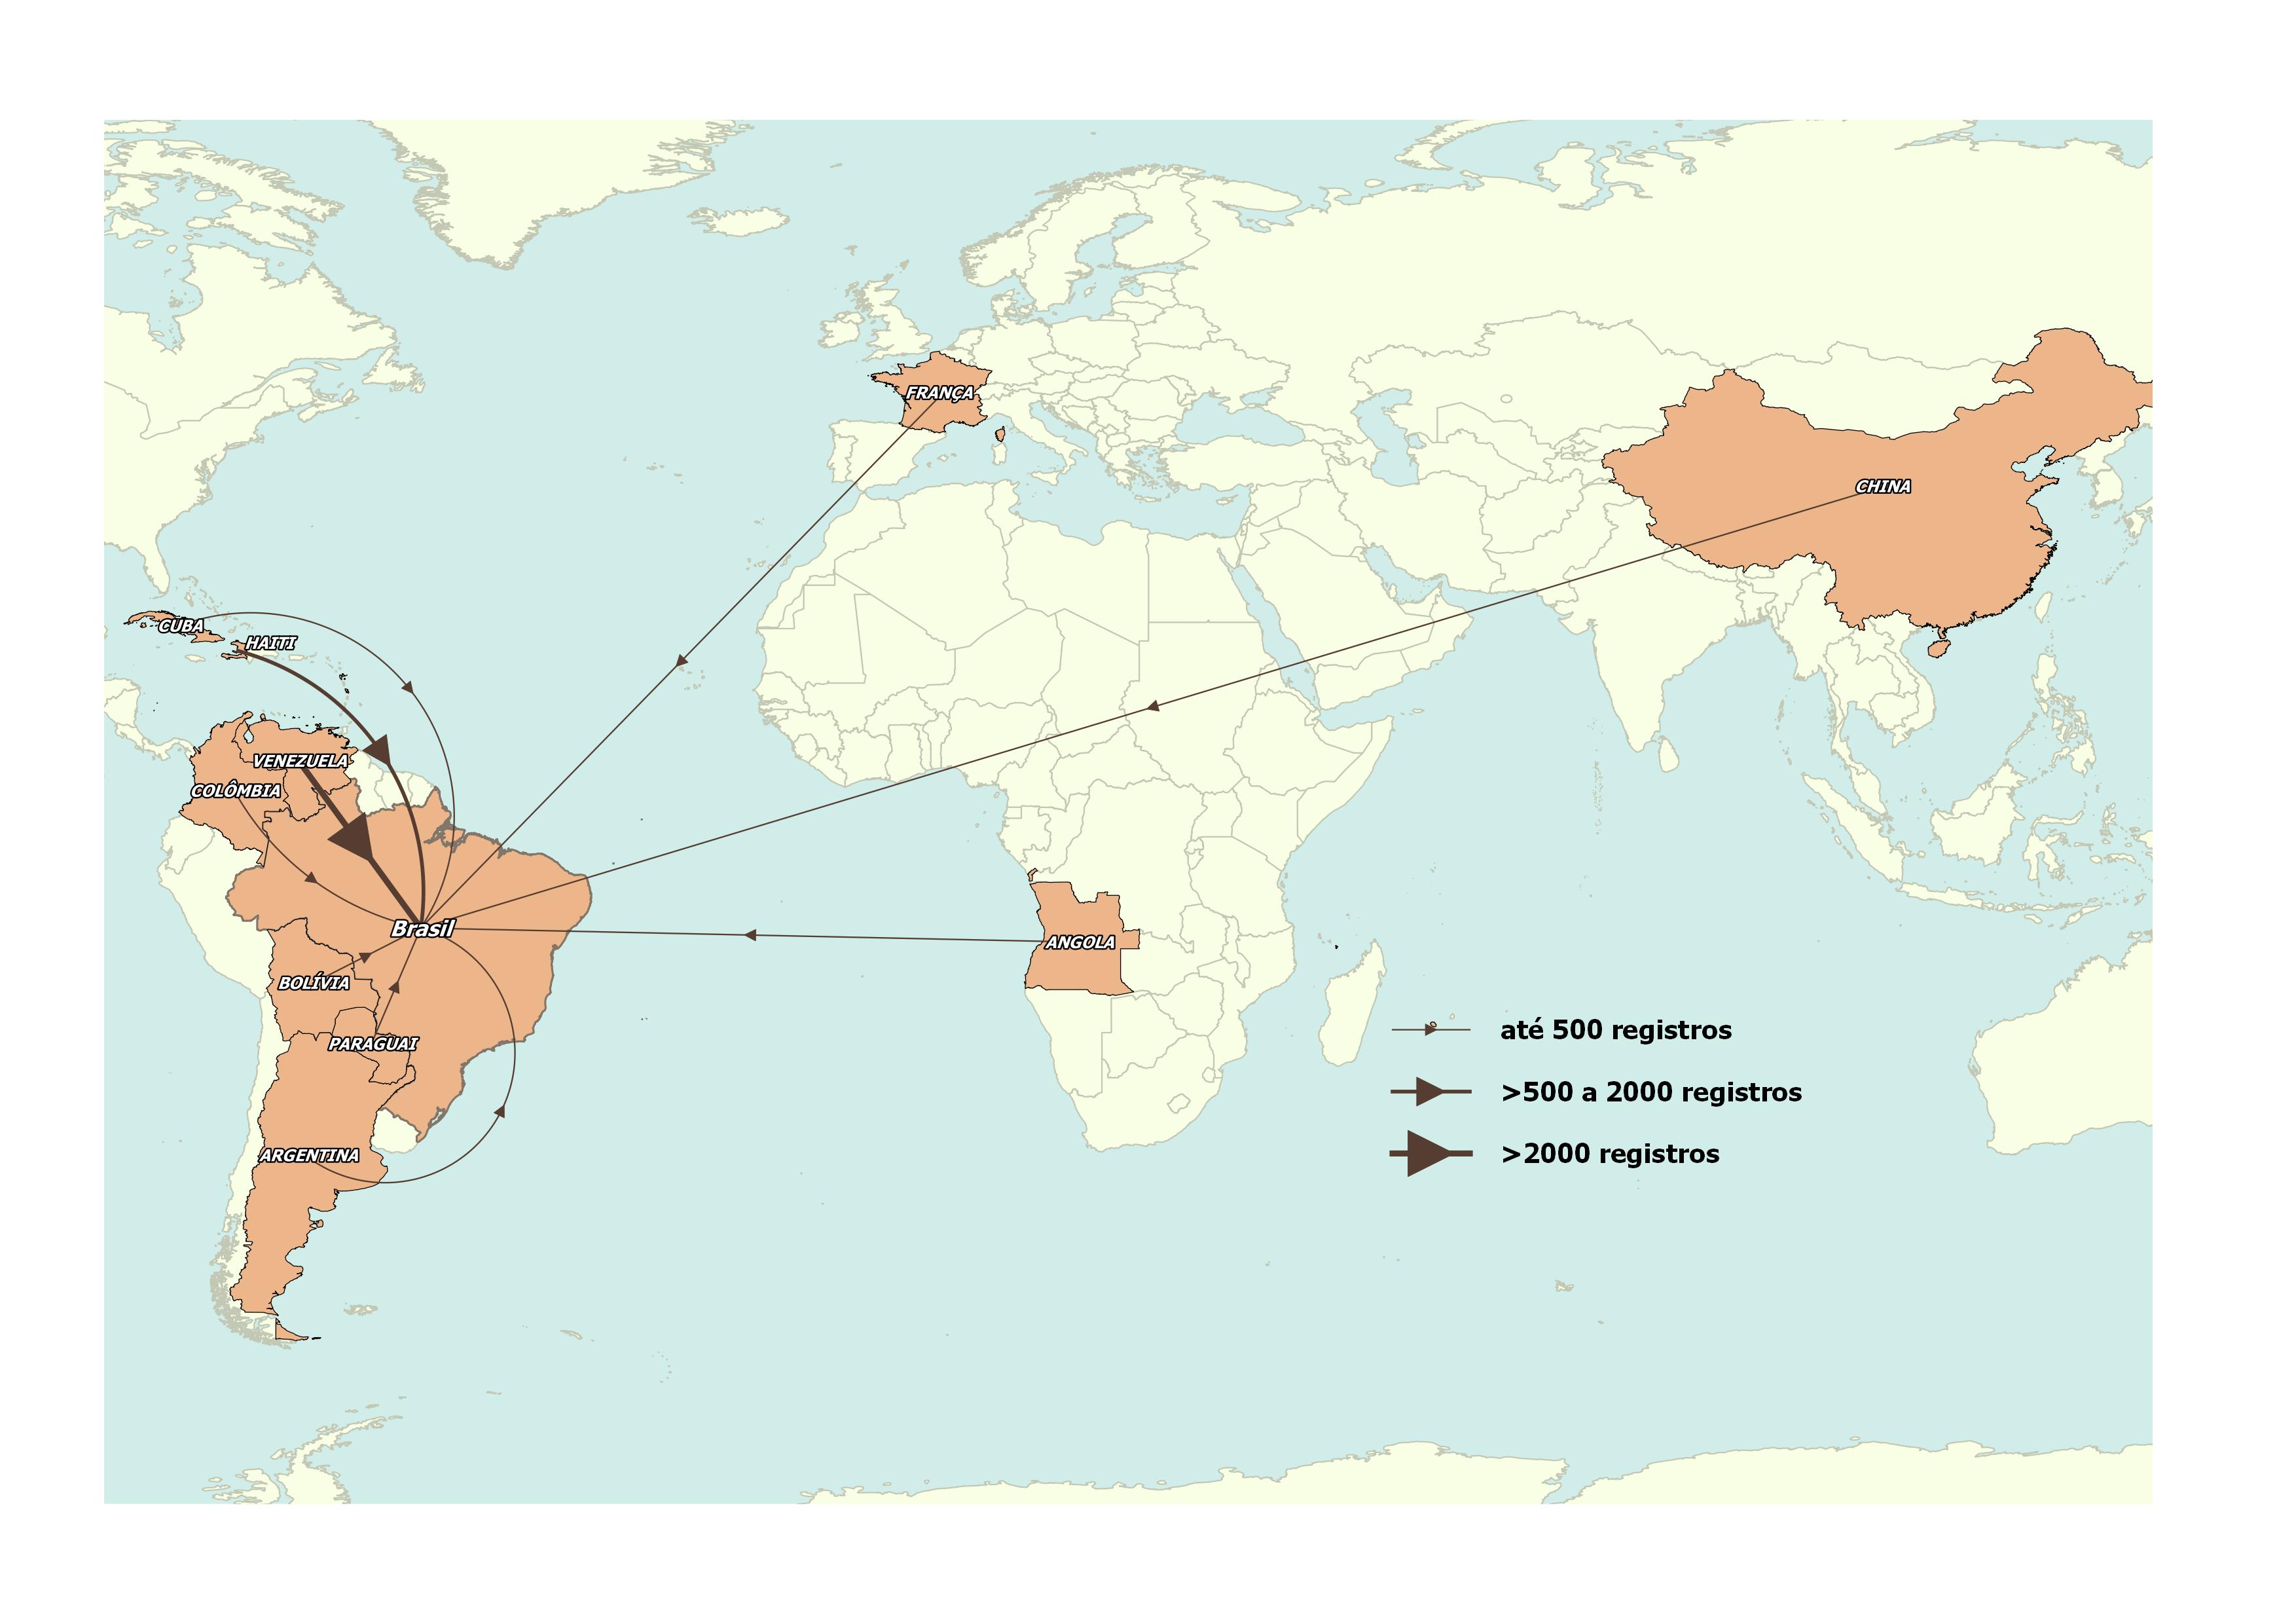
Map 2 displays the top ten nationalities that registered residence in the month of April. Among them, Venezuelans and Haitians are particularly notable. Additionally, it is noteworthy that only France originates from the Northern Hemisphere among the major countries, further emphasizing the shift in the axis of international migration towards Brazil.
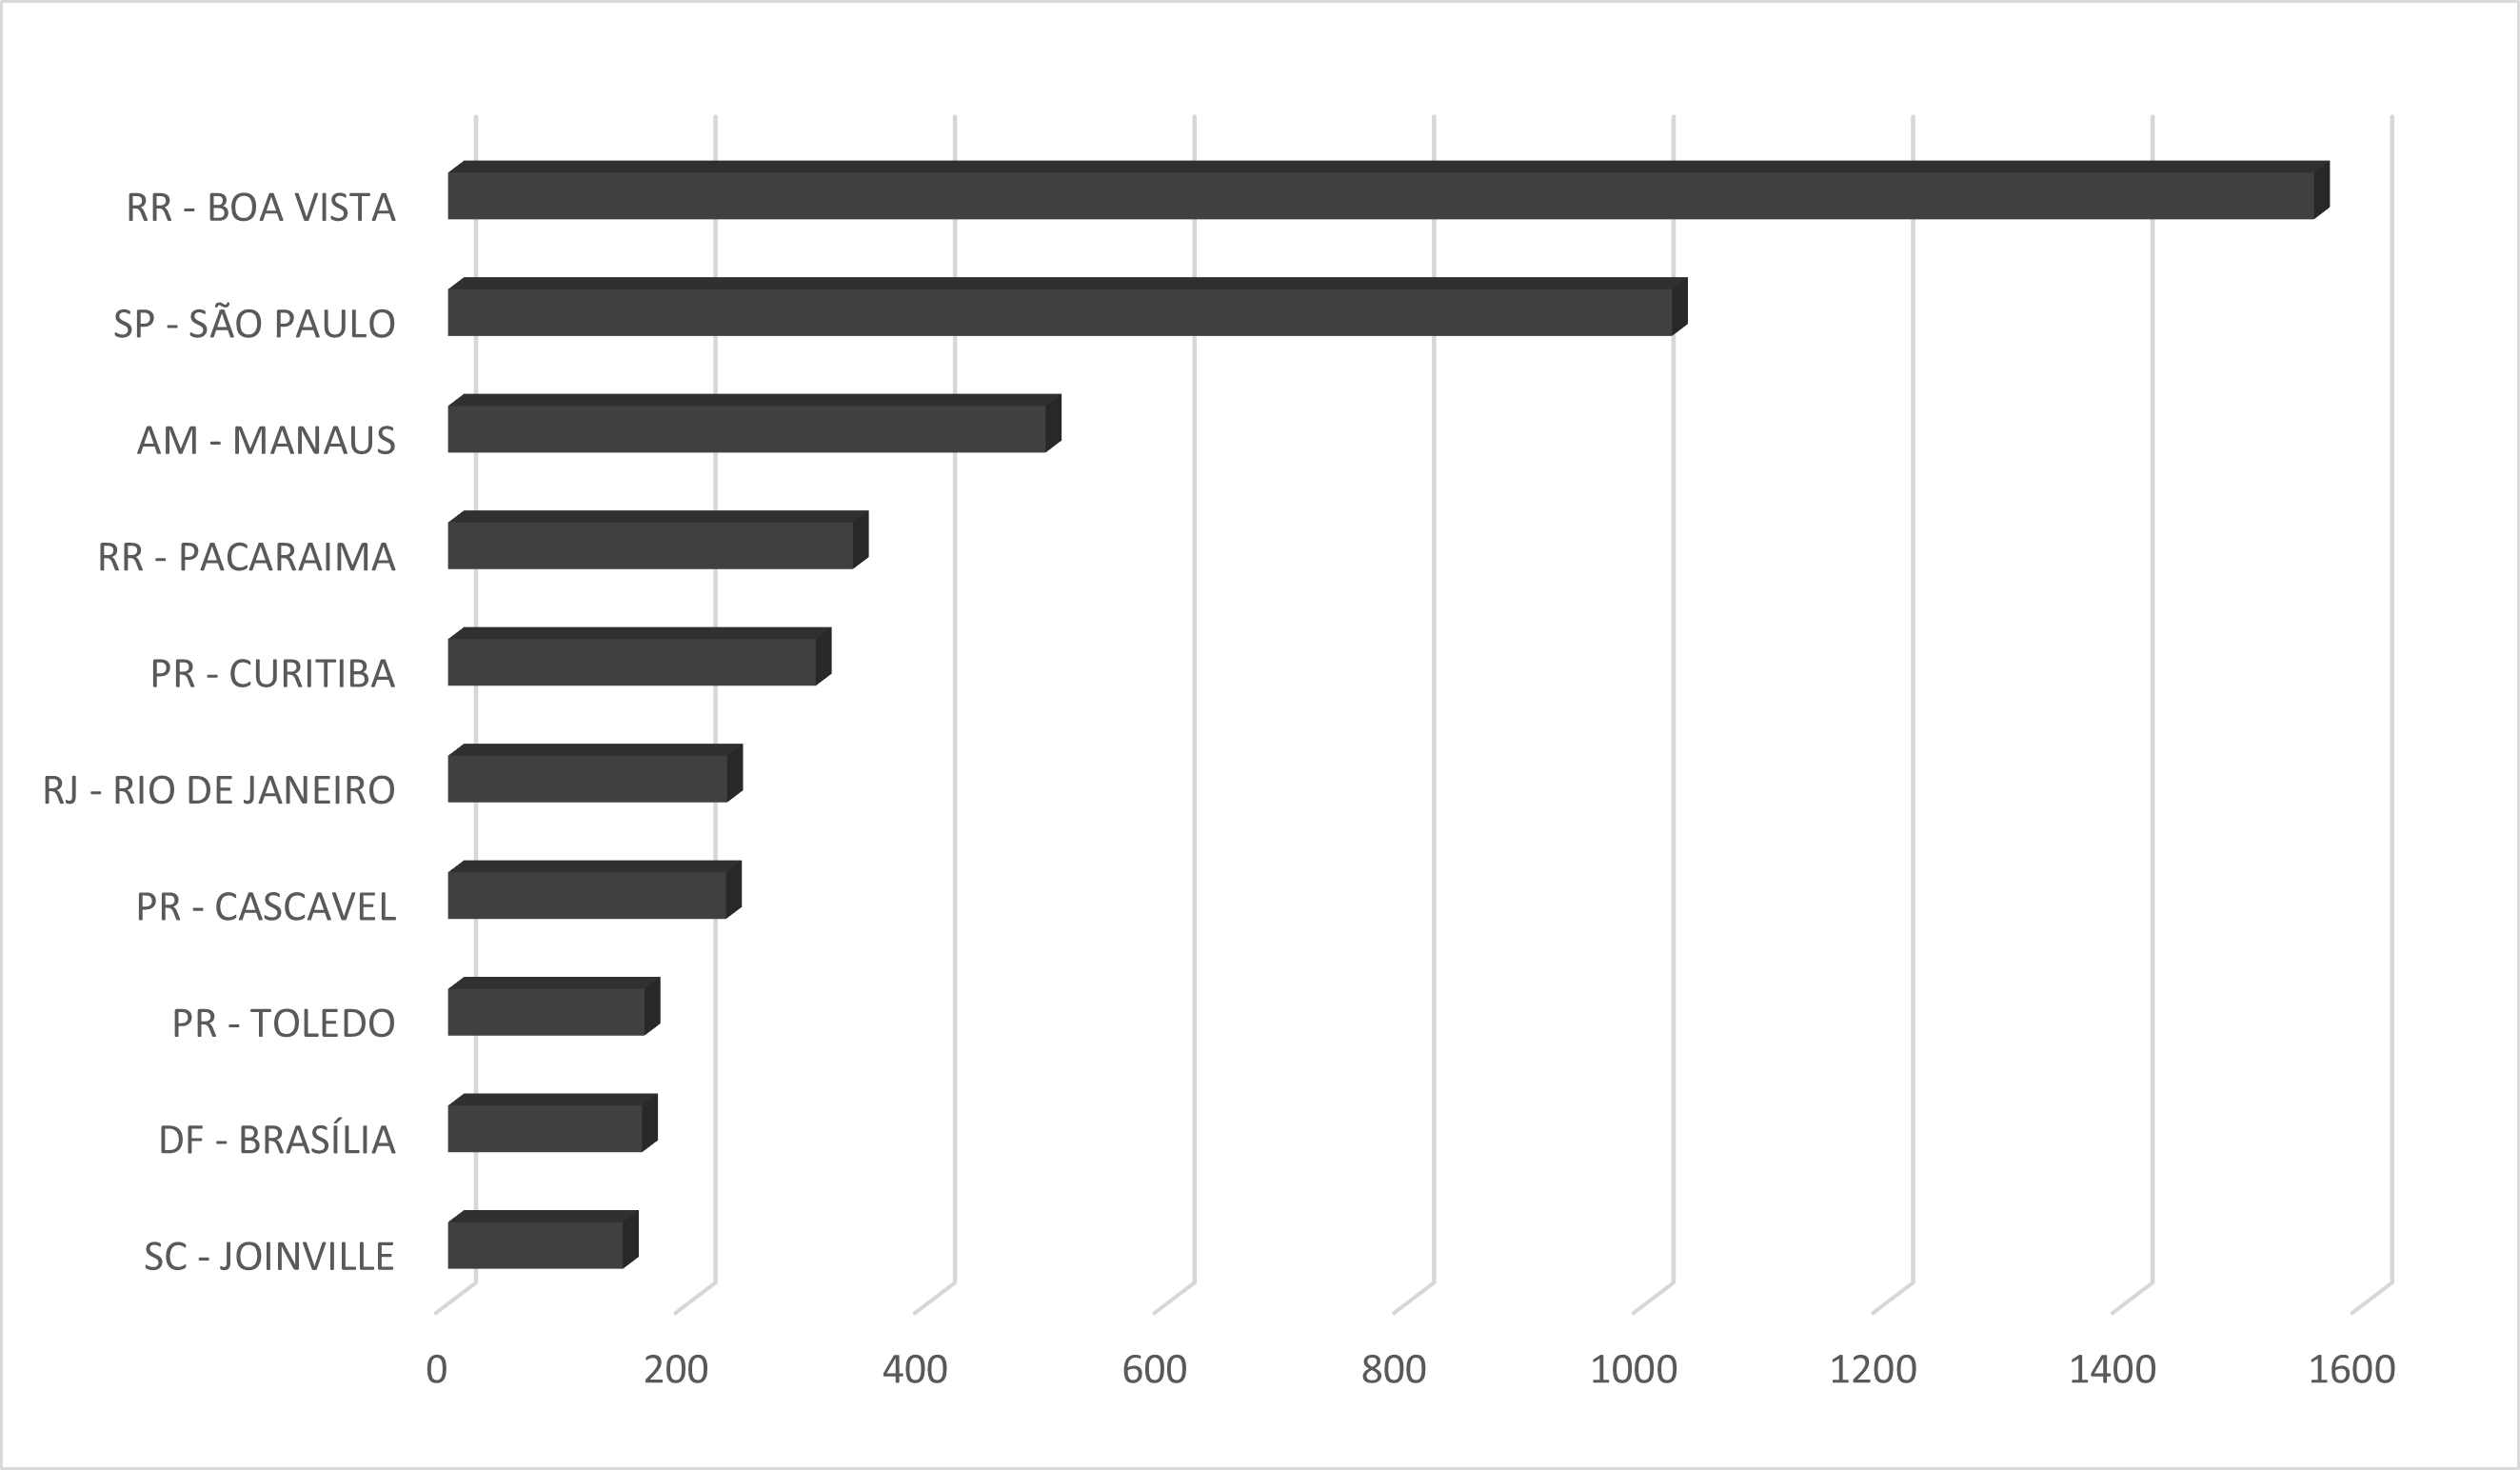
In terms of the geographical distribution of these immigrants, the Southeastern Region has surpassed the North as the leading region for regularization. Regarding cities, Boa Vista/RR and São Paulo were the top granters of residence permits in April, followed by Manaus. All cities registered more than 400 regularized immigrants each during the month (Graph 7).
GRAPH 6
Number of immigrant registrations, by month of registration - Brazil, 2019/2021
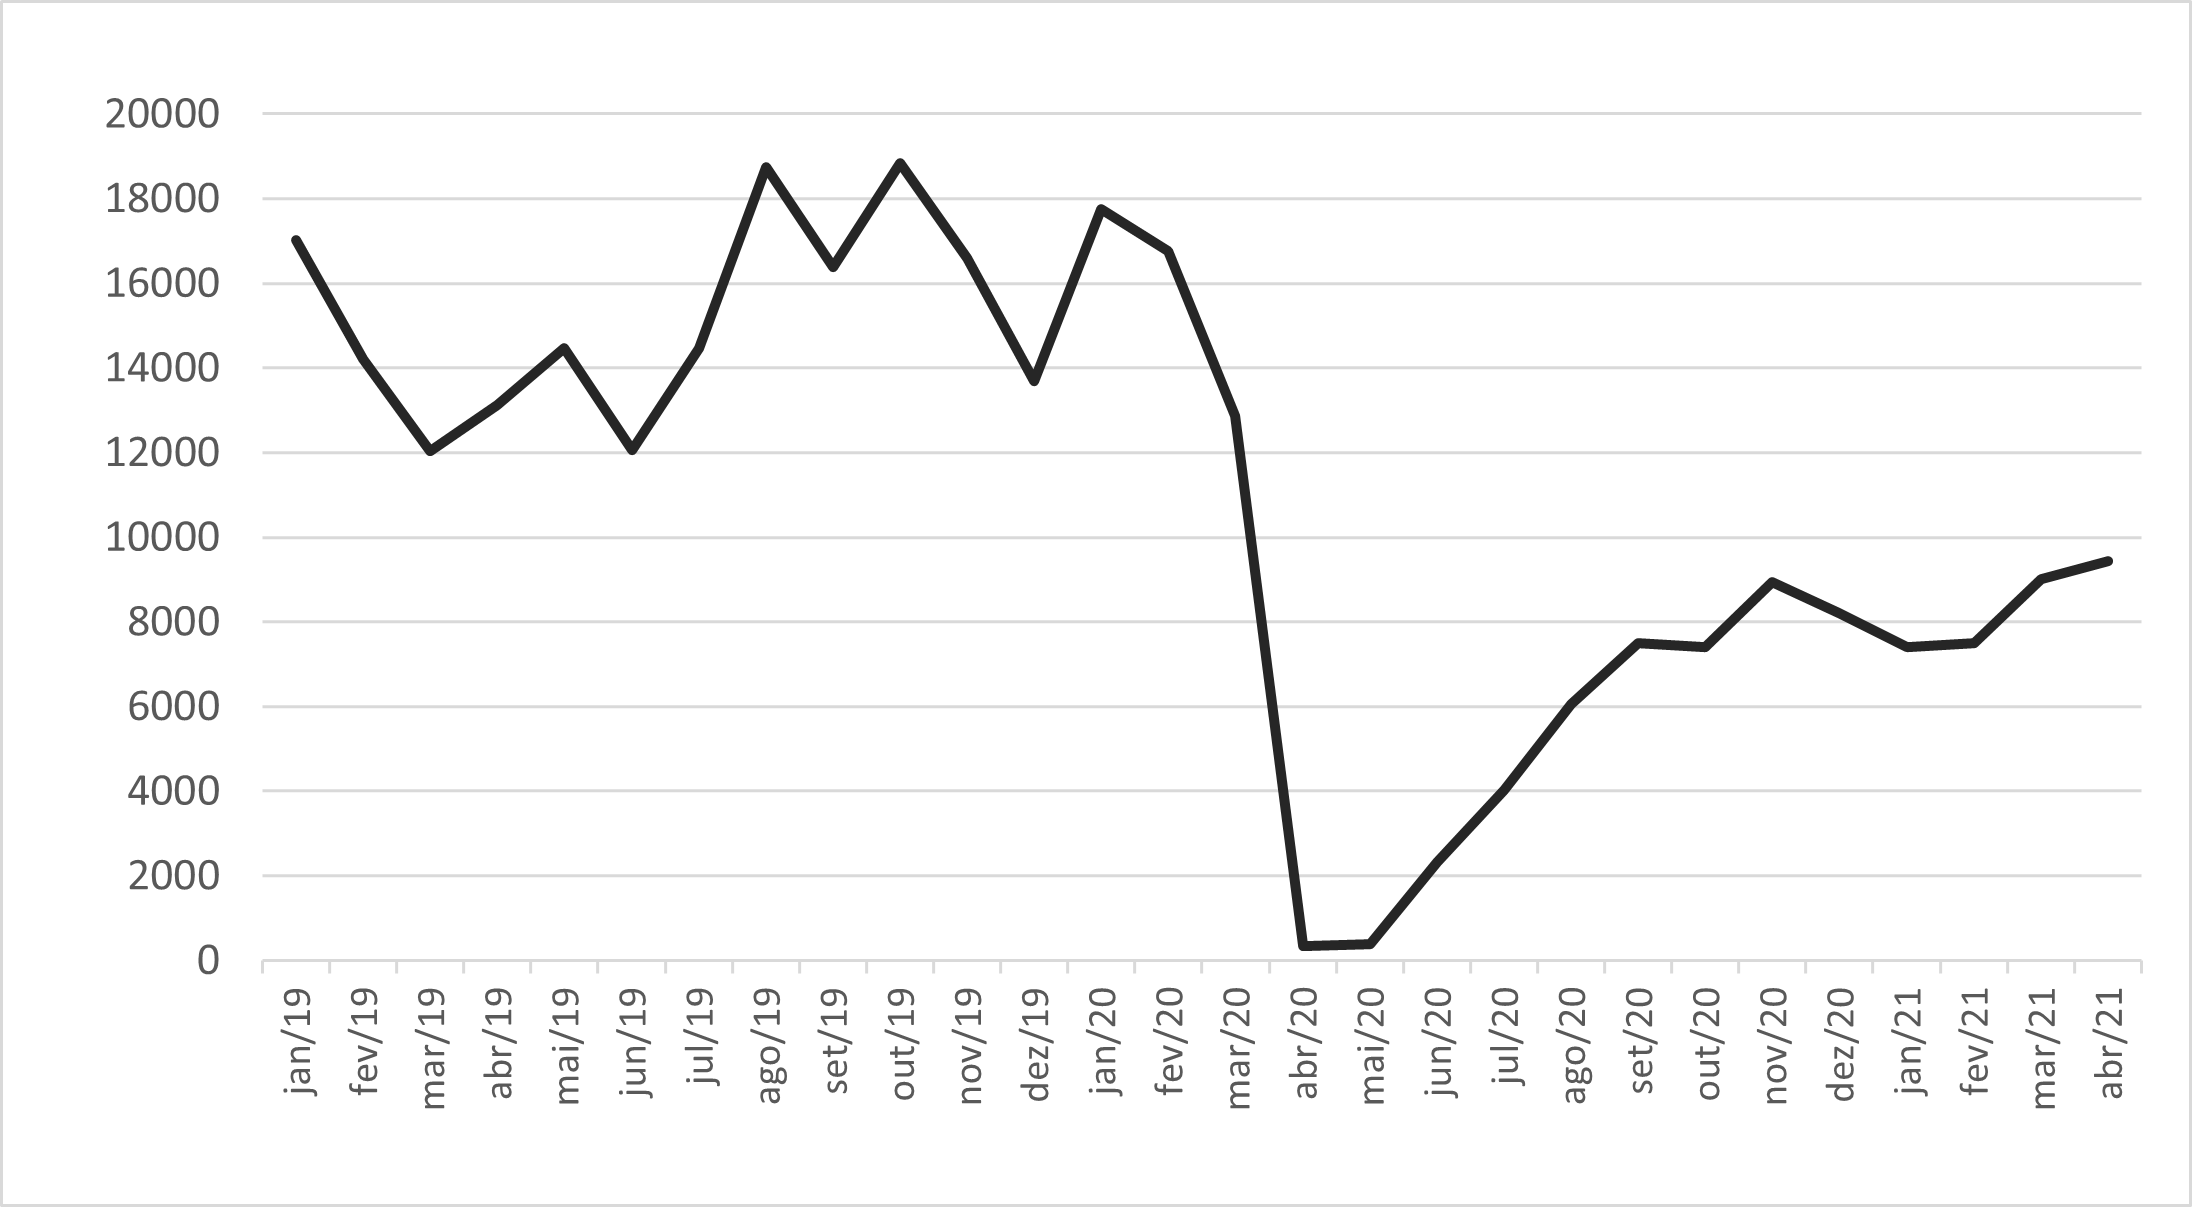
Source: OBMigra (2021), based on data from the Brazilian Federal Police, National Migration Registry System (SISMIGRA).
GRAPH 7
Number of migrant registrations, by main municipalities, April 2021
Source: OBMigra (2021), based on data from the Brazilian Federal Police, National Migration Registry System (SISMIGRA).
MAP 2
Number of immigrant registrations, by main countries of birth - Brazil, April 2021.
Source: OBMigra (2021), based on data from the Brazilian Federal Police, National Migration Registry System (SISMIGRA).
STI
STI (International Traffic System)
The restrictions on cross-border mobility implemented by various countries due to the COVID-19 pandemic had a significant impact on the movement of people across Brazilian border crossings, resulting in a slight decrease compared to March (Graph 8).
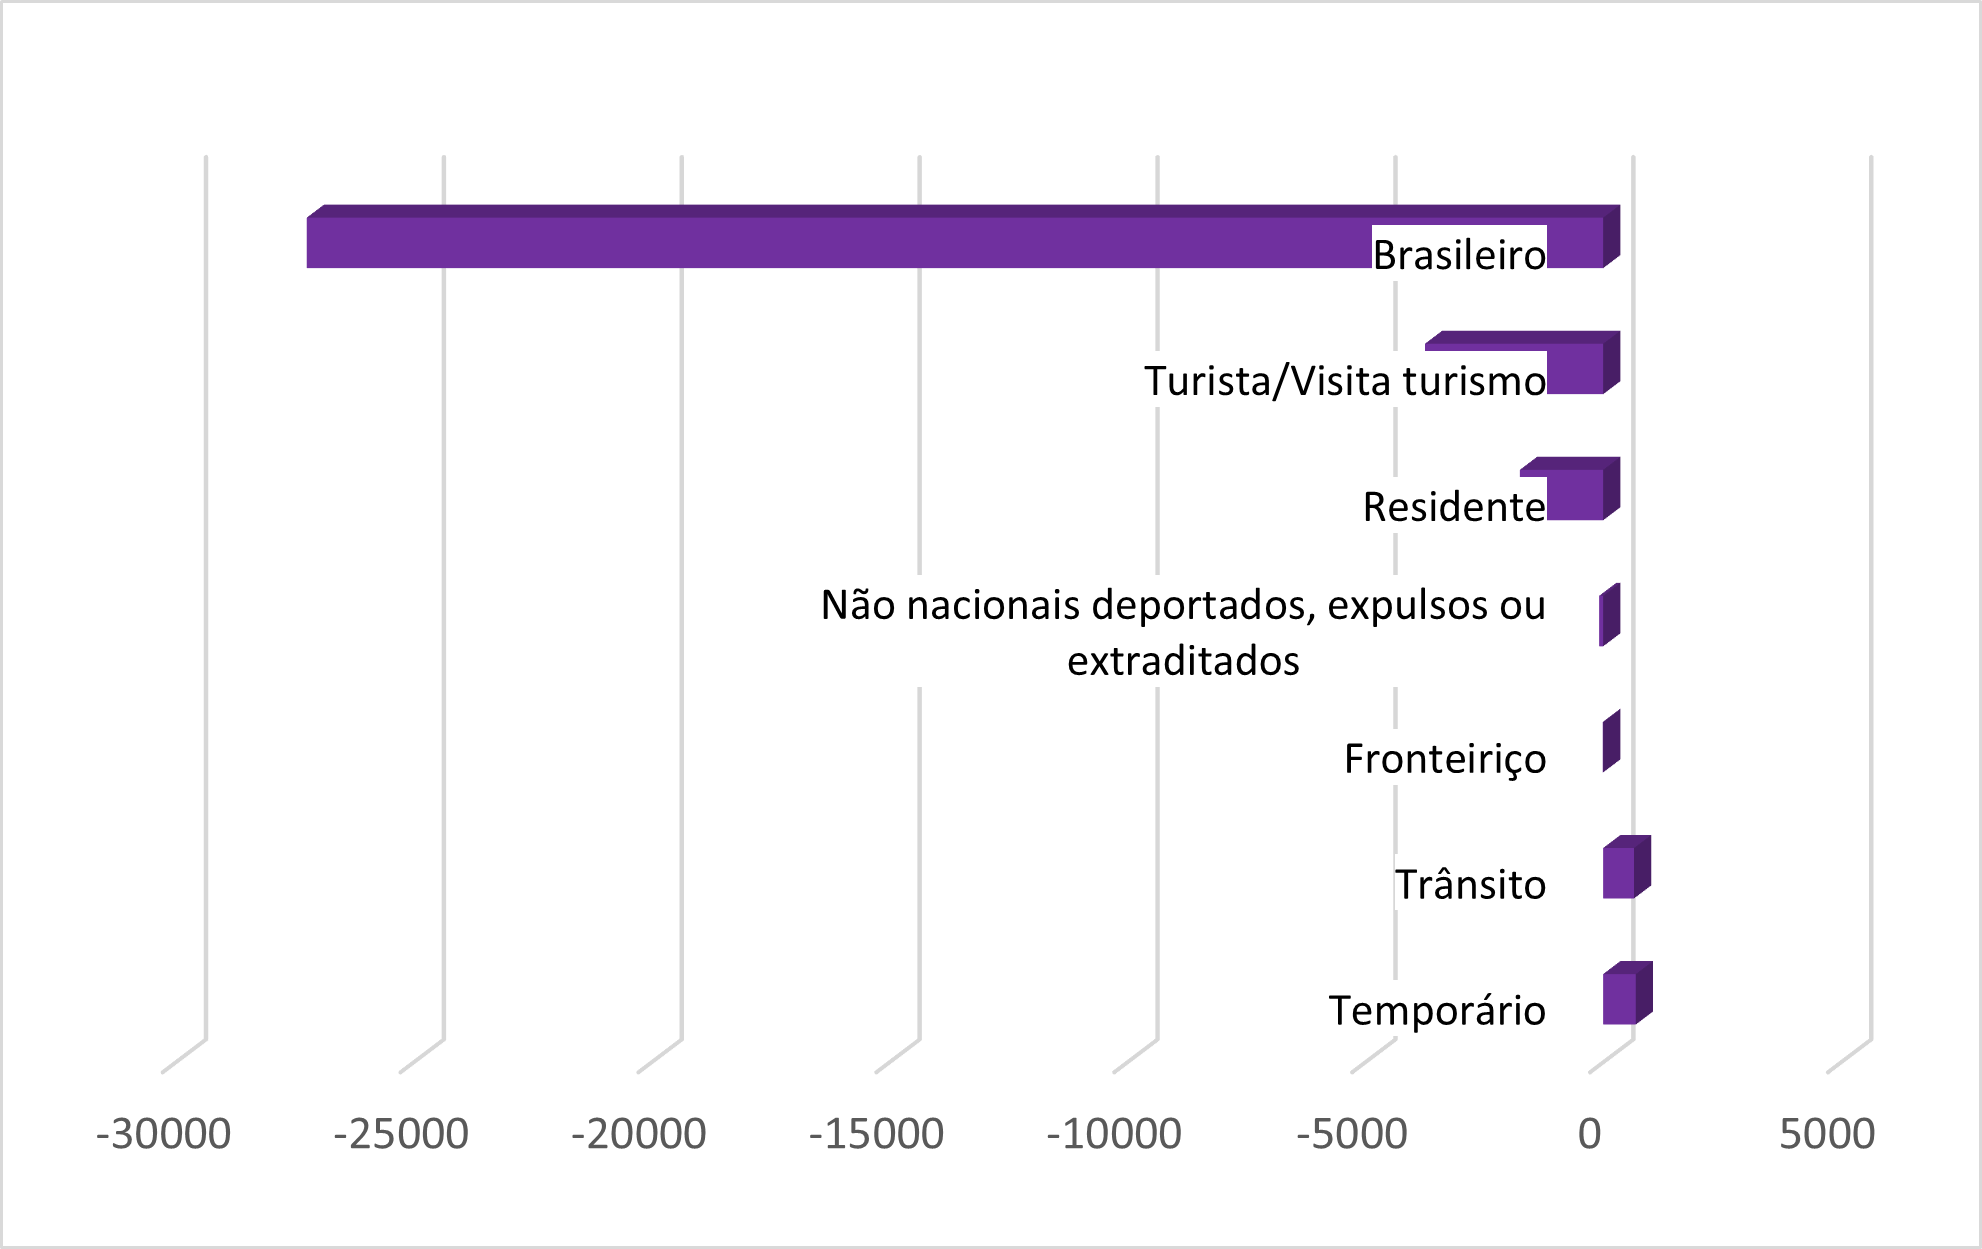
Another observed aspect is the consistent negative balances recorded throughout the four months of the current year, as depicted in Graph 9. Notably, the highest exit numbers occur precisely among Brazilians, resident migrants, and tourists.
GRAPH 8
Cross-border movements, by month of registration, Brazil 2019/2021
Source: OBMigra (2021), based on data from the Brazilian Federal Police, STI.
GRAPH 9
Cross-border entries and exits from Brazilian territory, according to classification typologies - Brazil, April 2021
Source: OBMigra (2021), based on data from the Brazilian Federal Police, International Traffic System (STI).
STI-MAR
STI-MAR (International Traffic System - Warning and Restrictions Module)
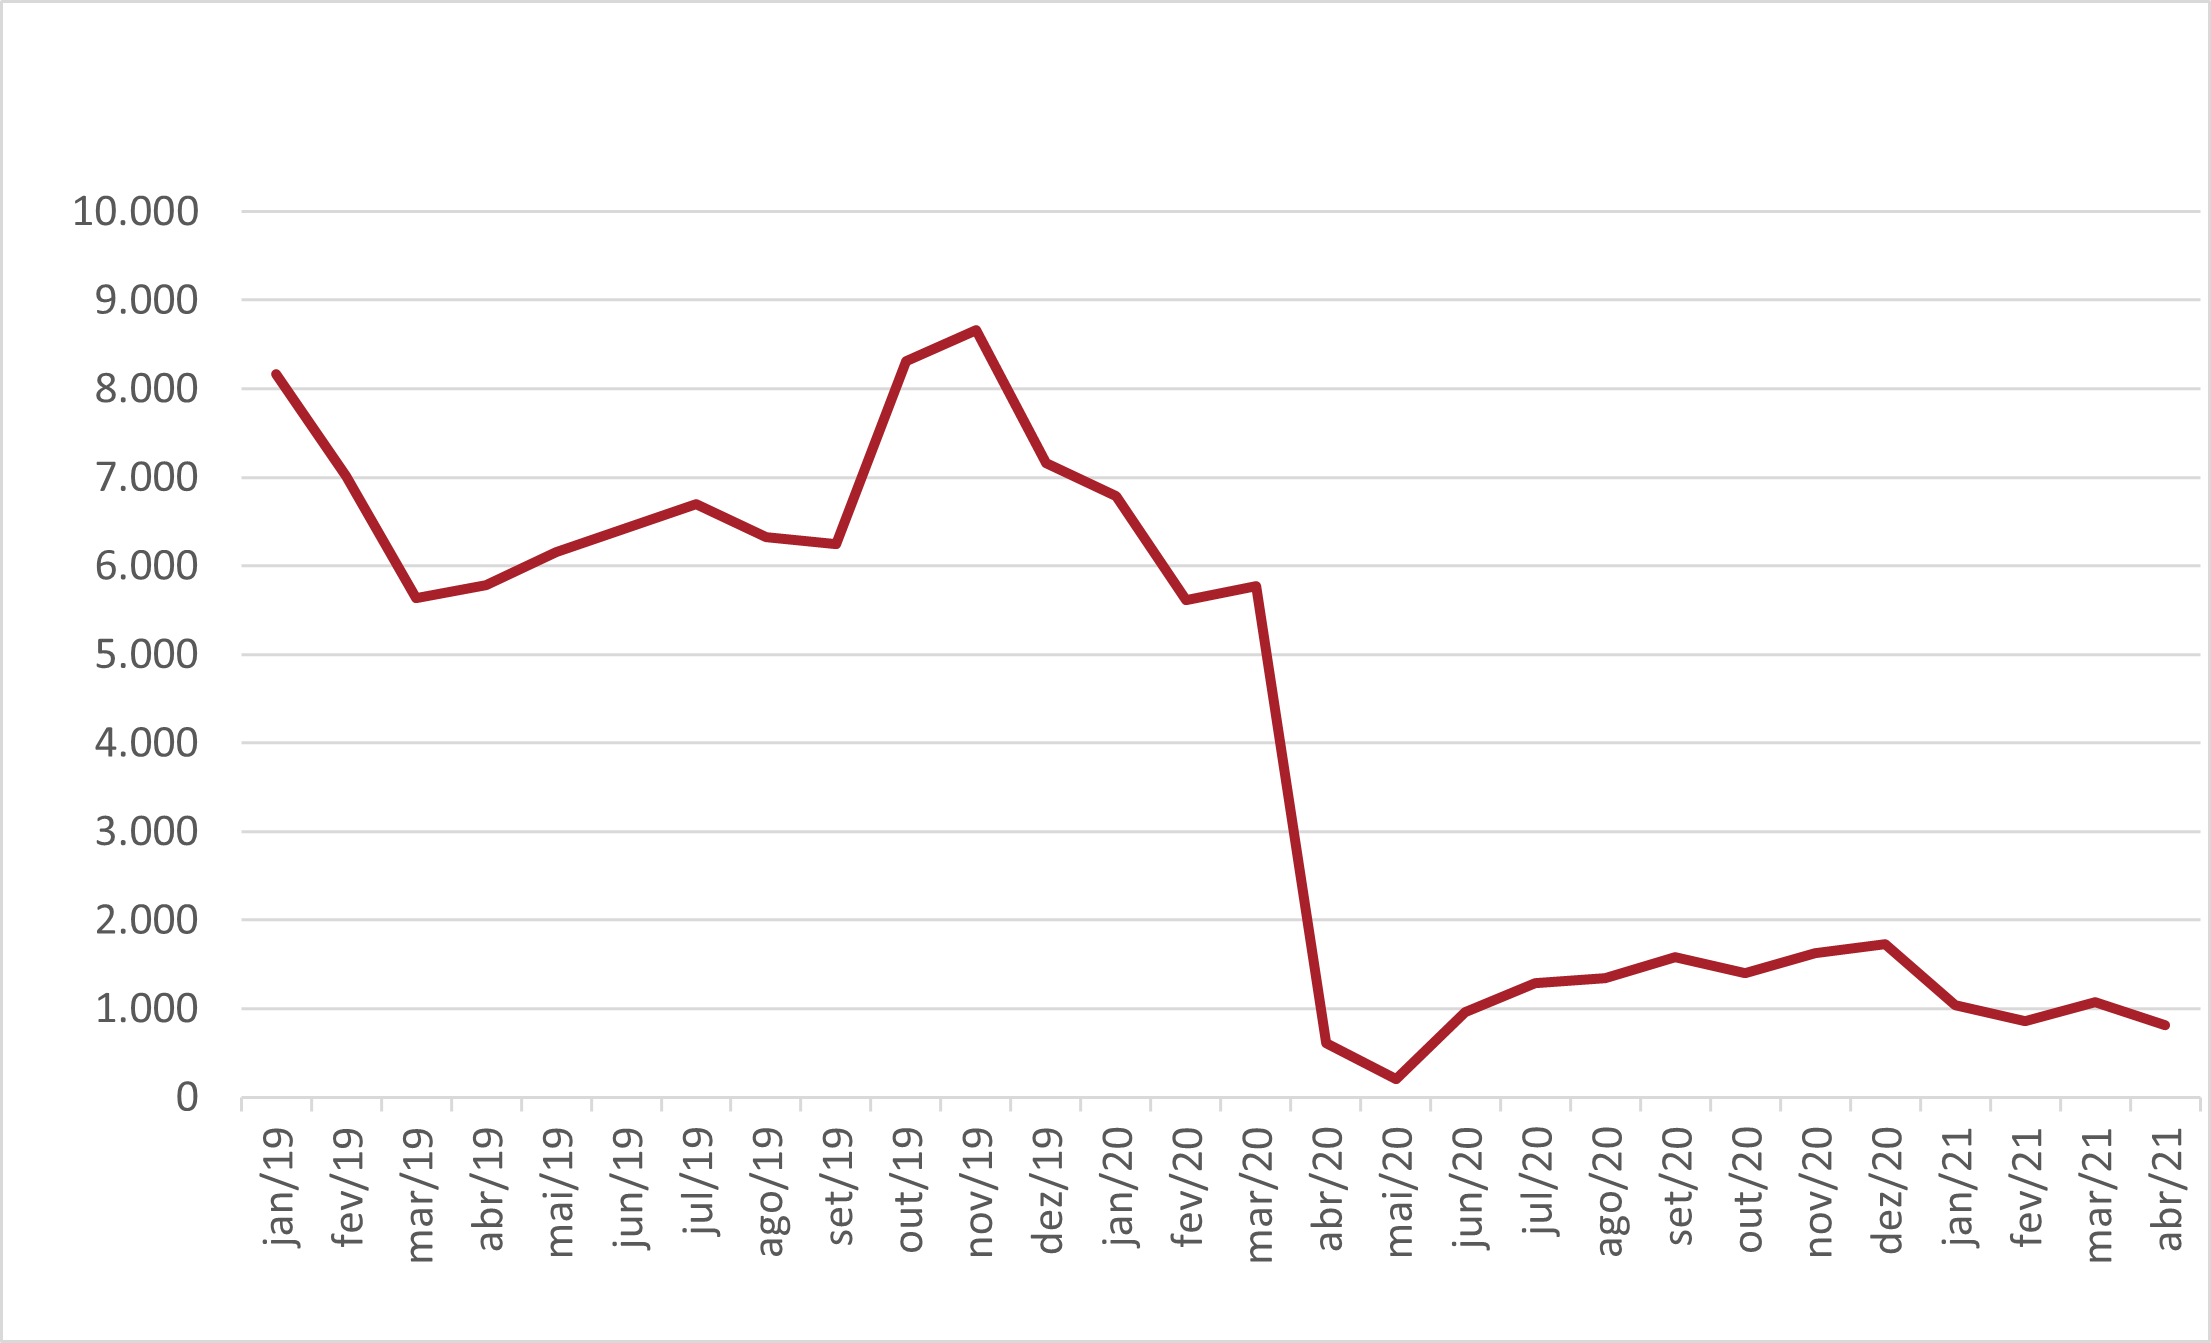
The number of applications for the recognition of refugee status, registered in the month of April, once again exhibited negative fluctuations, indicating a certain stability during the beginning of this year, albeit at significantly lower levels compared to the pre-pandemic period (Graph 10).
Venezuelans accounted for 65.3% of the requests, ten times more than Haitians, the second most common nationality in number of asylum claims, as can be seen on Map 3.
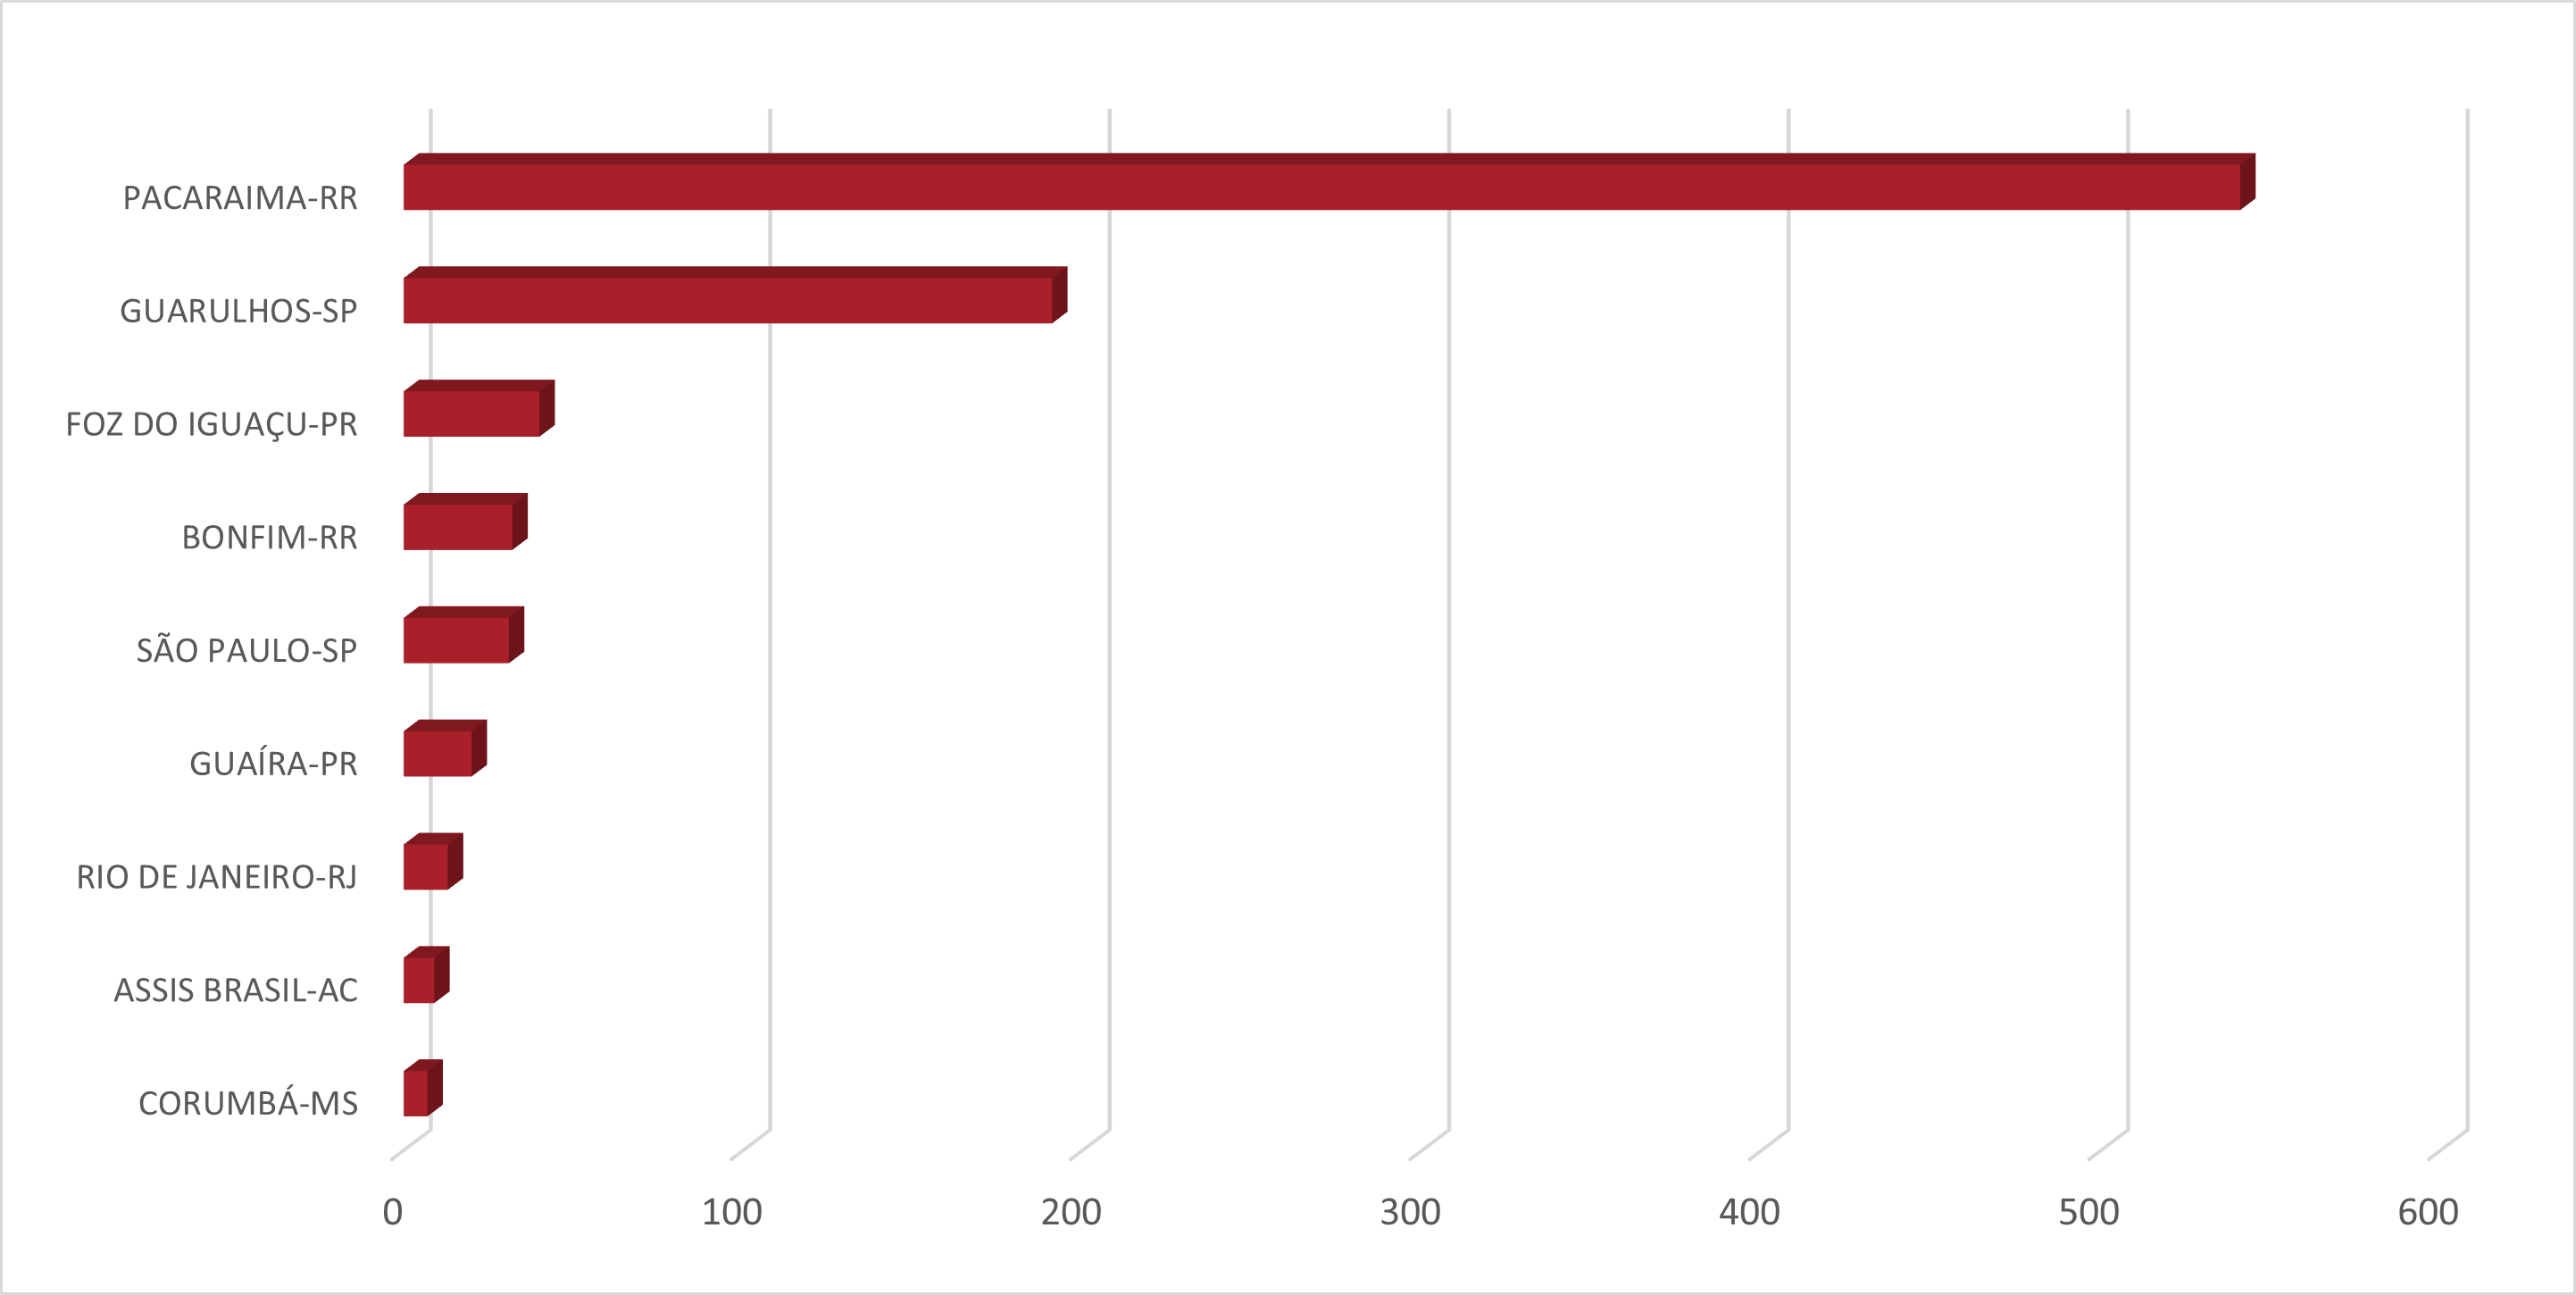
Pacaraima/RR and Guarulhos/SP were the cities that received the most asylum claims in April (Graph 11). Boa Vista/RR and Rio Branco/AC no longer feature among the top ten cities receiving applications.
GRAPH 10
Number of applications for recognition of refugee status, by month of registration - Brazil, 2019-2021
Source: OBMigra (2021), based on data from the International Traffic System - Warning and Restrictions Module.
GRAPH 11
Number of applications for recognition of refugee status, by main municipalities - Brazil, April 2021.
Source: OBMigra (2021), based on data from the International Traffic System - Warning and Restrictions Module.
MAP 3
Number of applications for recognition of refugee status, by main nationalities - Brazil, April 2021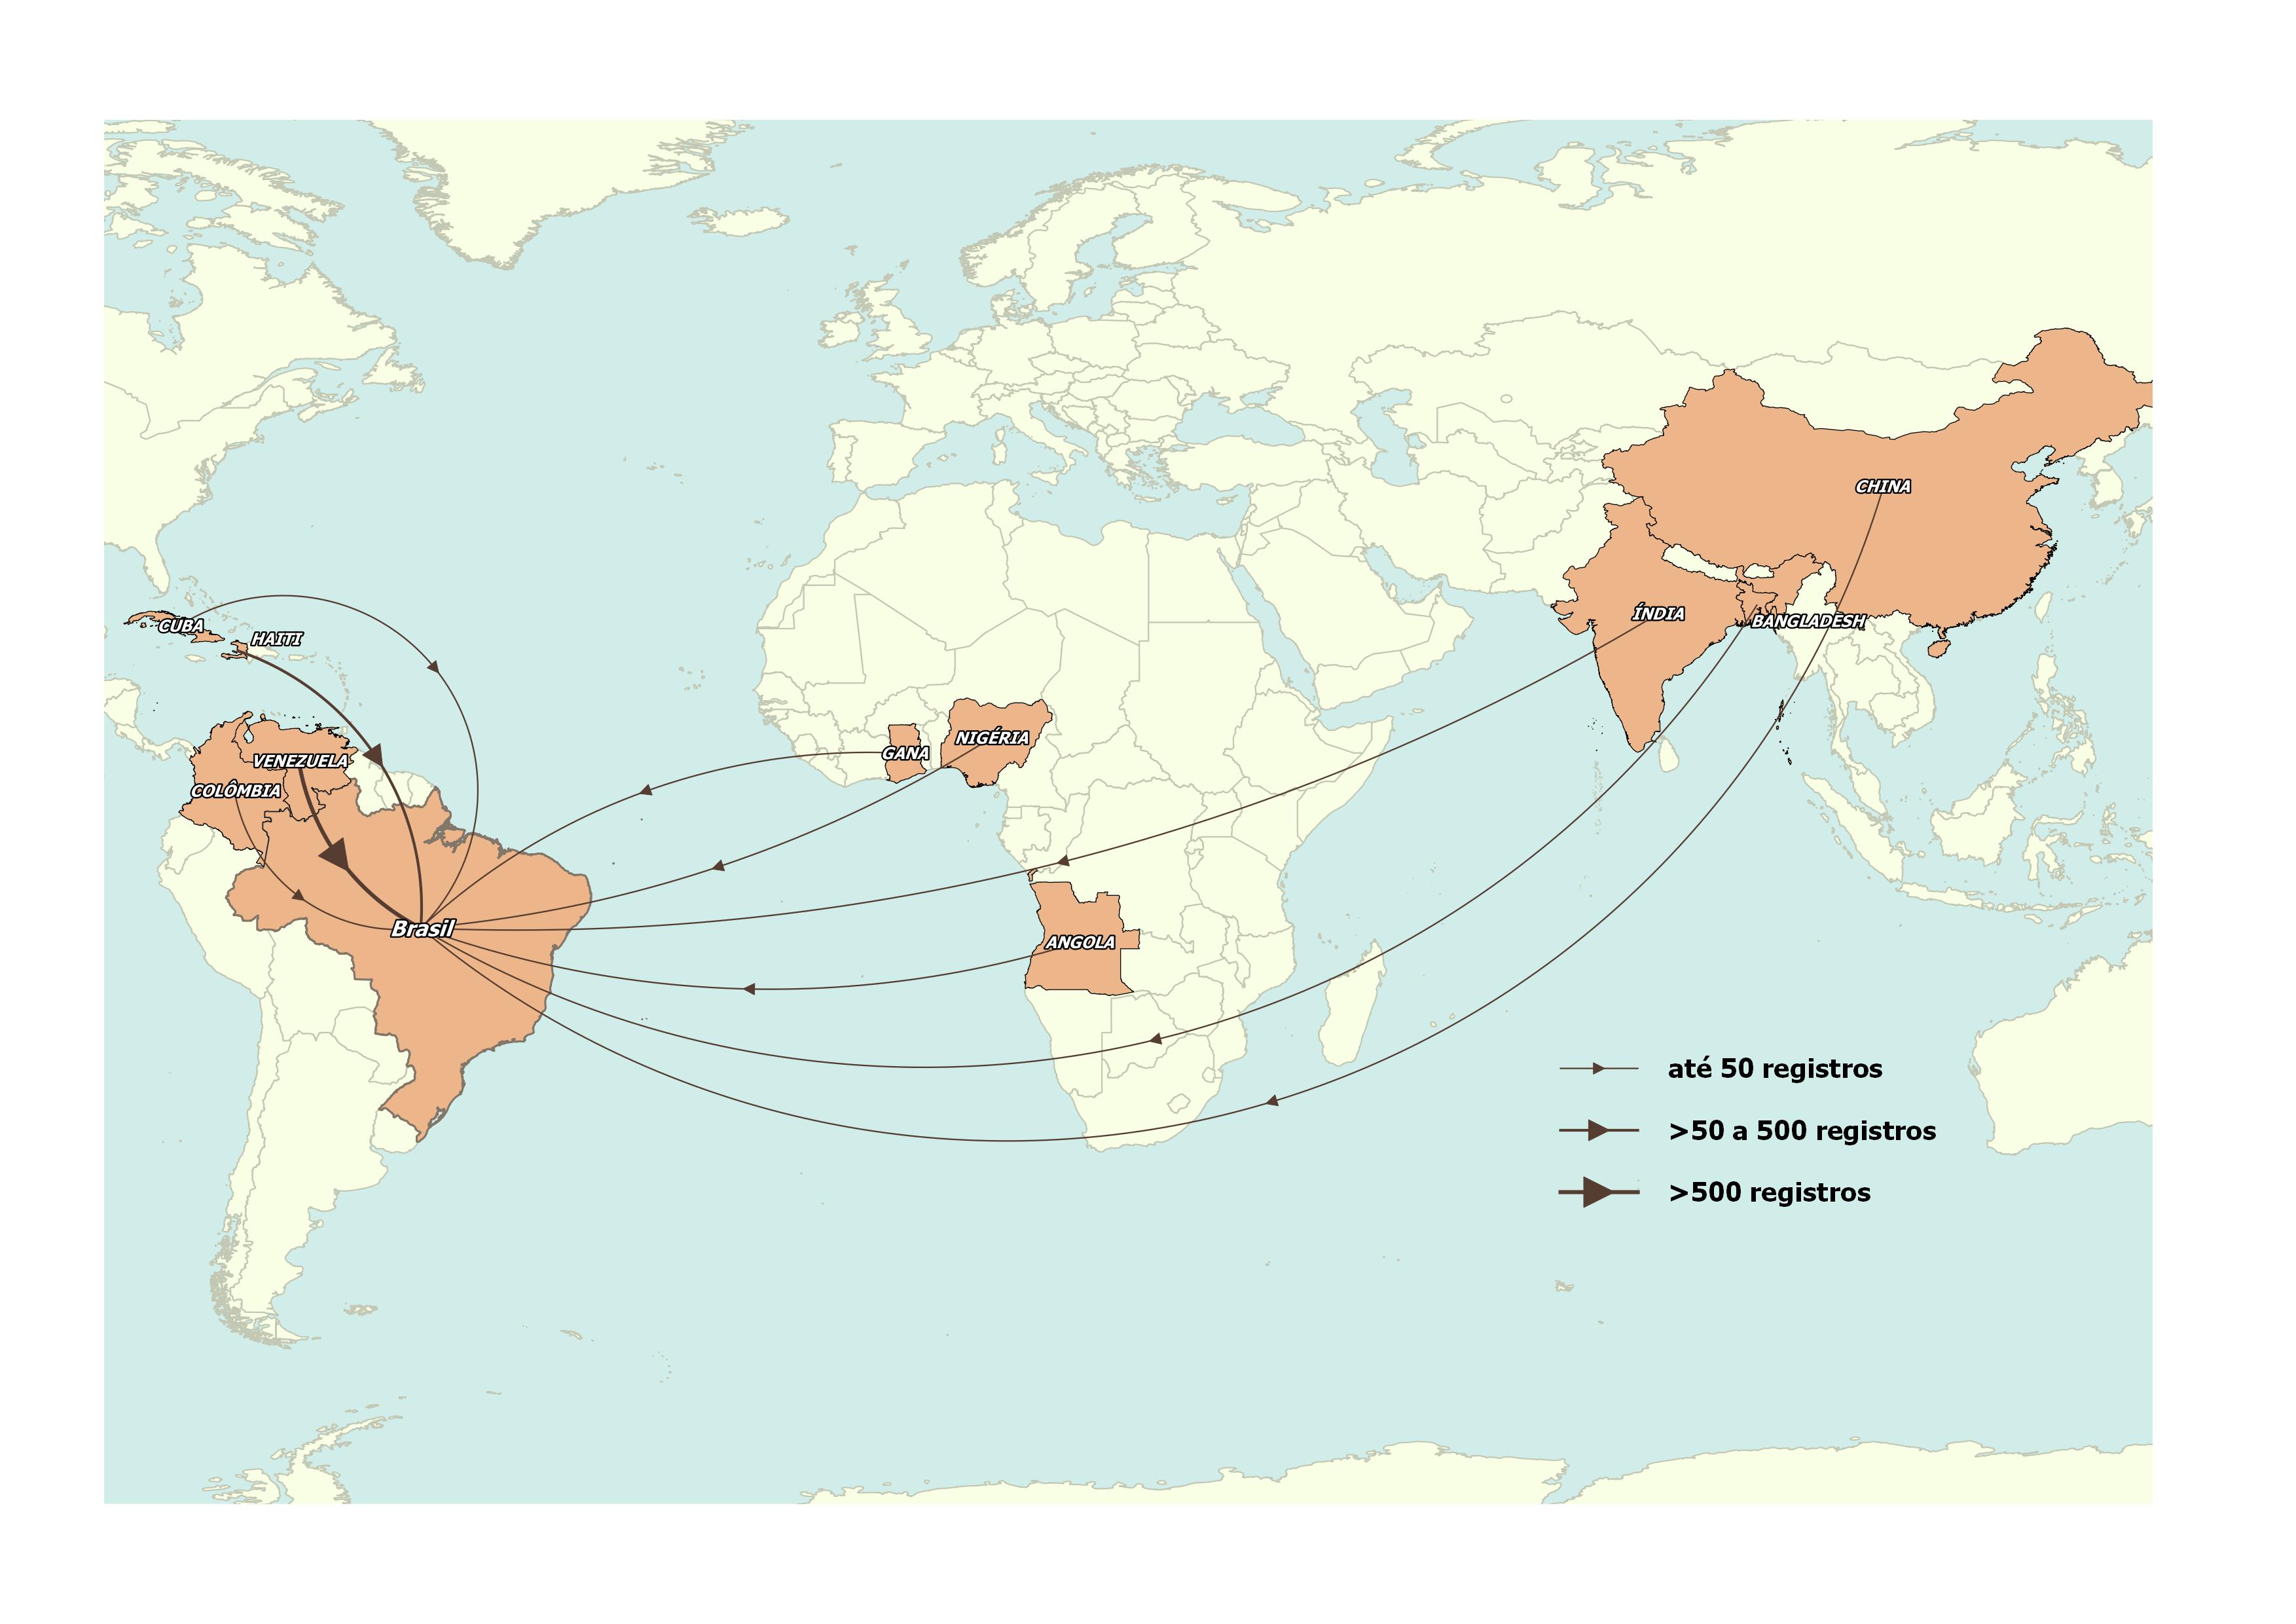
Source: OBMigra (2021), based on data from the International Traffic System - Warning and Restrictions Module.
COMO CITAR
The reproduction of this text and the data contained therein is permitted, provided that proper citation of the source is included. Reproduction for commercial use is prohibited.
How to cite this text:
| CAVALCANTI, L; OLIVEIRA, T; FURTADO, A; DICK, P; QUINTINO, F; MACEDO, M Acompanhamento de fluxo e empregabilidade dos imigrantes no Brasil: Relatório Mensal do OBMigra Ano 2, Número 4, abril de 2021/ Observatório das Migrações Internacionais; Brasília, DF: OBMigra, 2021. Available at: https://portaldeimigracao.mj.gov.br/pt/dados/relatorios-mensais |