CGIL
CGIL (General Coordination of Labor Immigration)
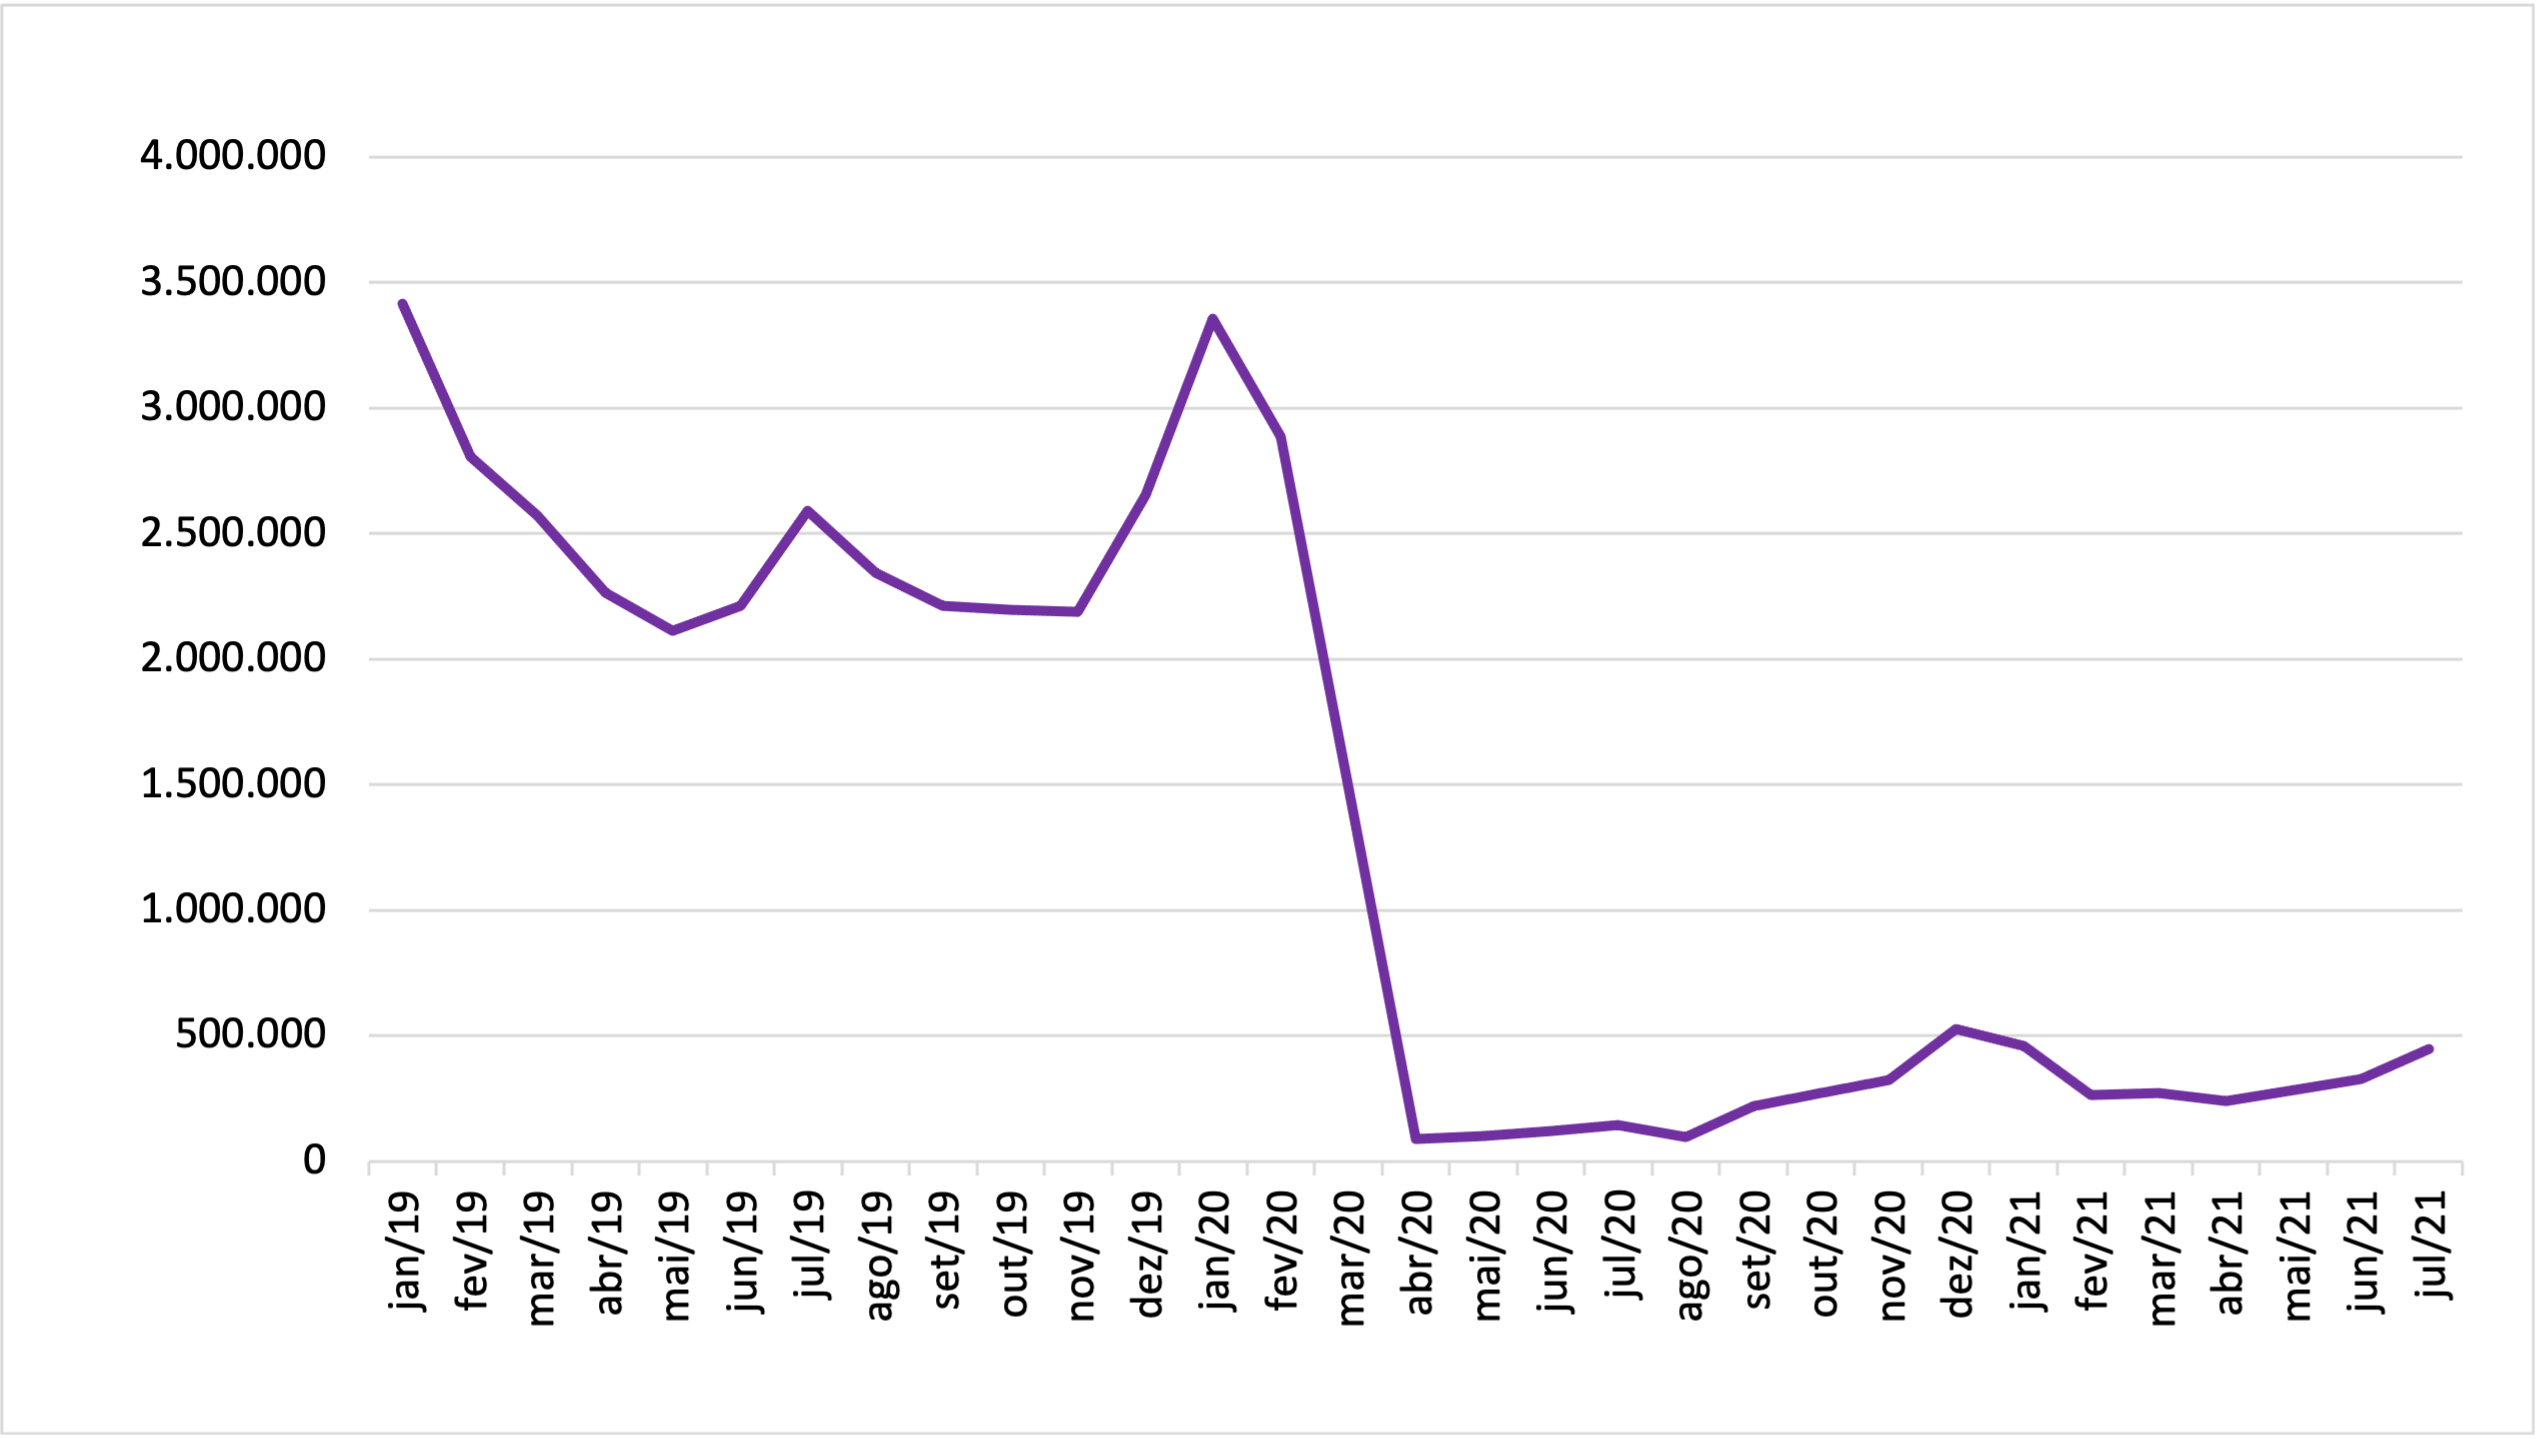
The number of residence permits for work and investment purposes experienced a slight decrease compared to June (-3.4%) and a more significant decline in the annual comparison (-45.0%). It is worth noting that July 2020 displayed an atypical pattern in the granting of residence permits (Graph 1).
Despite the slight decline in the number of grants, it is noteworthy that permits for Filipinos, British, and Chinese individuals showed positive variations compared to the previous month, as depicted in Graph 2.
Among skilled immigrant workers overall, there were also declines in the number of permits compared to both time frames, amounting to -39.9% compared to July 2020 and -24.9% compared to the previous month. Among the main nationalities, French workers were the only ones to experience increased participation in July (Graph 3).
GRAPH 1
Number of work permits for labor and investment purposes, by month of registration - Brazil, 2019-2021

Source: OBMigra (2021), based on data from the General Coordination of Labor Immigration - CGIL.
GRAPH 2
Number of permits granted, by main countries - Brazil, June and July/21

Source: General Coordination of Labor Immigration / Ministry of Justice and Public Security, July 2021.
GRAPH 3
Number of permits granted to skilled workers, by main countries, Brazil, June and July 2021.

Source: General Coordination of Labor Immigration / Ministry of Justice and Public Security, July 2021.
CTPS/RAIS/NOVO CAGED
Harmonized database Work and Social Security Card (CTPS)/Annual Report of Social Information (RAIS)/New General Register of Employed and Unemployed Persons (CAGED)
After experiencing a positive variation in May, job creation for immigrant labor resumed its downward trend in July (Graph 4). It is worth noting the significant increase in the number of hirings and layoffs compared to the previous month (12.7%) and, especially, in comparison to July 2020 (96.8%). Notably, young individuals under 20 years of age and illiterate individuals were among the prominent groups of new immigrant workers in the formal market.
The most significant movement of workers in the formal labor market was observed at the tip of the agribusiness chain, particularly in poultry slaughtering and pig slaughtering activities, which attracted the largest immigrant labor force (Graph 5).
Map 1 illustrates the movement across Federation Units, revealing that the North Region, primarily driven by job generation for immigrants in Roraima and Amazonas, exhibited the most favorable performance. Additionally, it is worth noting that the Northeast Region also displayed a positive balance of job vacancies. Among the main cities regarding immigrant workers' movements in the formal market, Cascavel maintained its position as the top creator of job openings, with a positive balance of over 100 positions.
.
GRAPH 4
Jobs created for immigrants, by month - Brazil, 2019/2021

Source: OBMigra (2021), based on data from the harmonized database RAIS-CTPS-CAGED and the Digital System of Tax, Social Security and Labor Obligations (eSocial).
GRAPH 5
Movements of migrant workers in the formal labor market, by main industries - Brazil, June 2021

Source: OBMigra (June 2021), based on data from the Ministry of Economy, Harmonized database RAIS-CTPS-CAGED.
MAP 1
Number of jobs created for immigrants, according to Federation Unit, June 2021.
Source: OBMigra (June 2021), based on data from the Ministry of Economy, Harmonized database RAIS-CTPS-CAGED.
SISMIGRA
SisMigra (National Migration Registry System)
Residency registrations in July resumed the growth trend that had started in January of the current year. The number of registrations for the month reached the level observed in July 2019, indicating a recovery before the onset of the health crisis (Graph 6). The recent opening of the land border in the northern region of the country at the end of June, had a significant impact on the increase in residence records. Notably, Boa Vista, Manaus, and Pacaraima were among the top four municipalities with the highest number of immigrant registrations (Graph 7).
Among the main nationalities with residence registrations in July, no changes were observed, as Venezuelans and Haitians continued to be the most frequent registrants (Map 2).
GRAPH 6
Number of immigrant registrations, by month of registration - Brazil, 2019/2021

Source: OBMigra (2021), based on data from the Brazilian Federal Police, National Migration Registry System (SISMIGRA).
GRAPH 7
Number of migrant registrations, by main municipalities - July 2021

Source: OBMigra (July 2021), based on data from the Brazilian Federal Police, National Migration Registry System (SISMIGRA).
MAP 2
Number of immigrant registrations, by main countries of birth, July 2021.
Source: OBMigra (July 2021), based on data from the Brazilian Federal Police, National Migration Registry System (SISMIGRA).
STI
STI (International Traffic System)
The international cross-border movement of people has not yet returned to pre-pandemic levels observed before the SARS-CoV-2 outbreak. During this period, there was a slight increase in December 2020, followed by a decline in entry and exit movements until February of the current year. Since then, the movements have remained relatively stable (Graph 8).
In terms of the main nationalities, individuals from the United States, the Philippines, Paraguay, and Venezuela constituted the highest number of border crossings in July. It is noteworthy that among these nationalities, Venezuelans exhibited a positive balance in their movement (Graph 9).
GRAPH 8
Cross-border movements, by month of registration, Brazil 2019/2021
Source: OBMigra (2021), based on data from the Brazilian Federal Police, International Traffic System (STI).
GRAPH 9
Cross-border entry into and exit from Brazilian territory, by main nationality countries - Brazil, July 2021
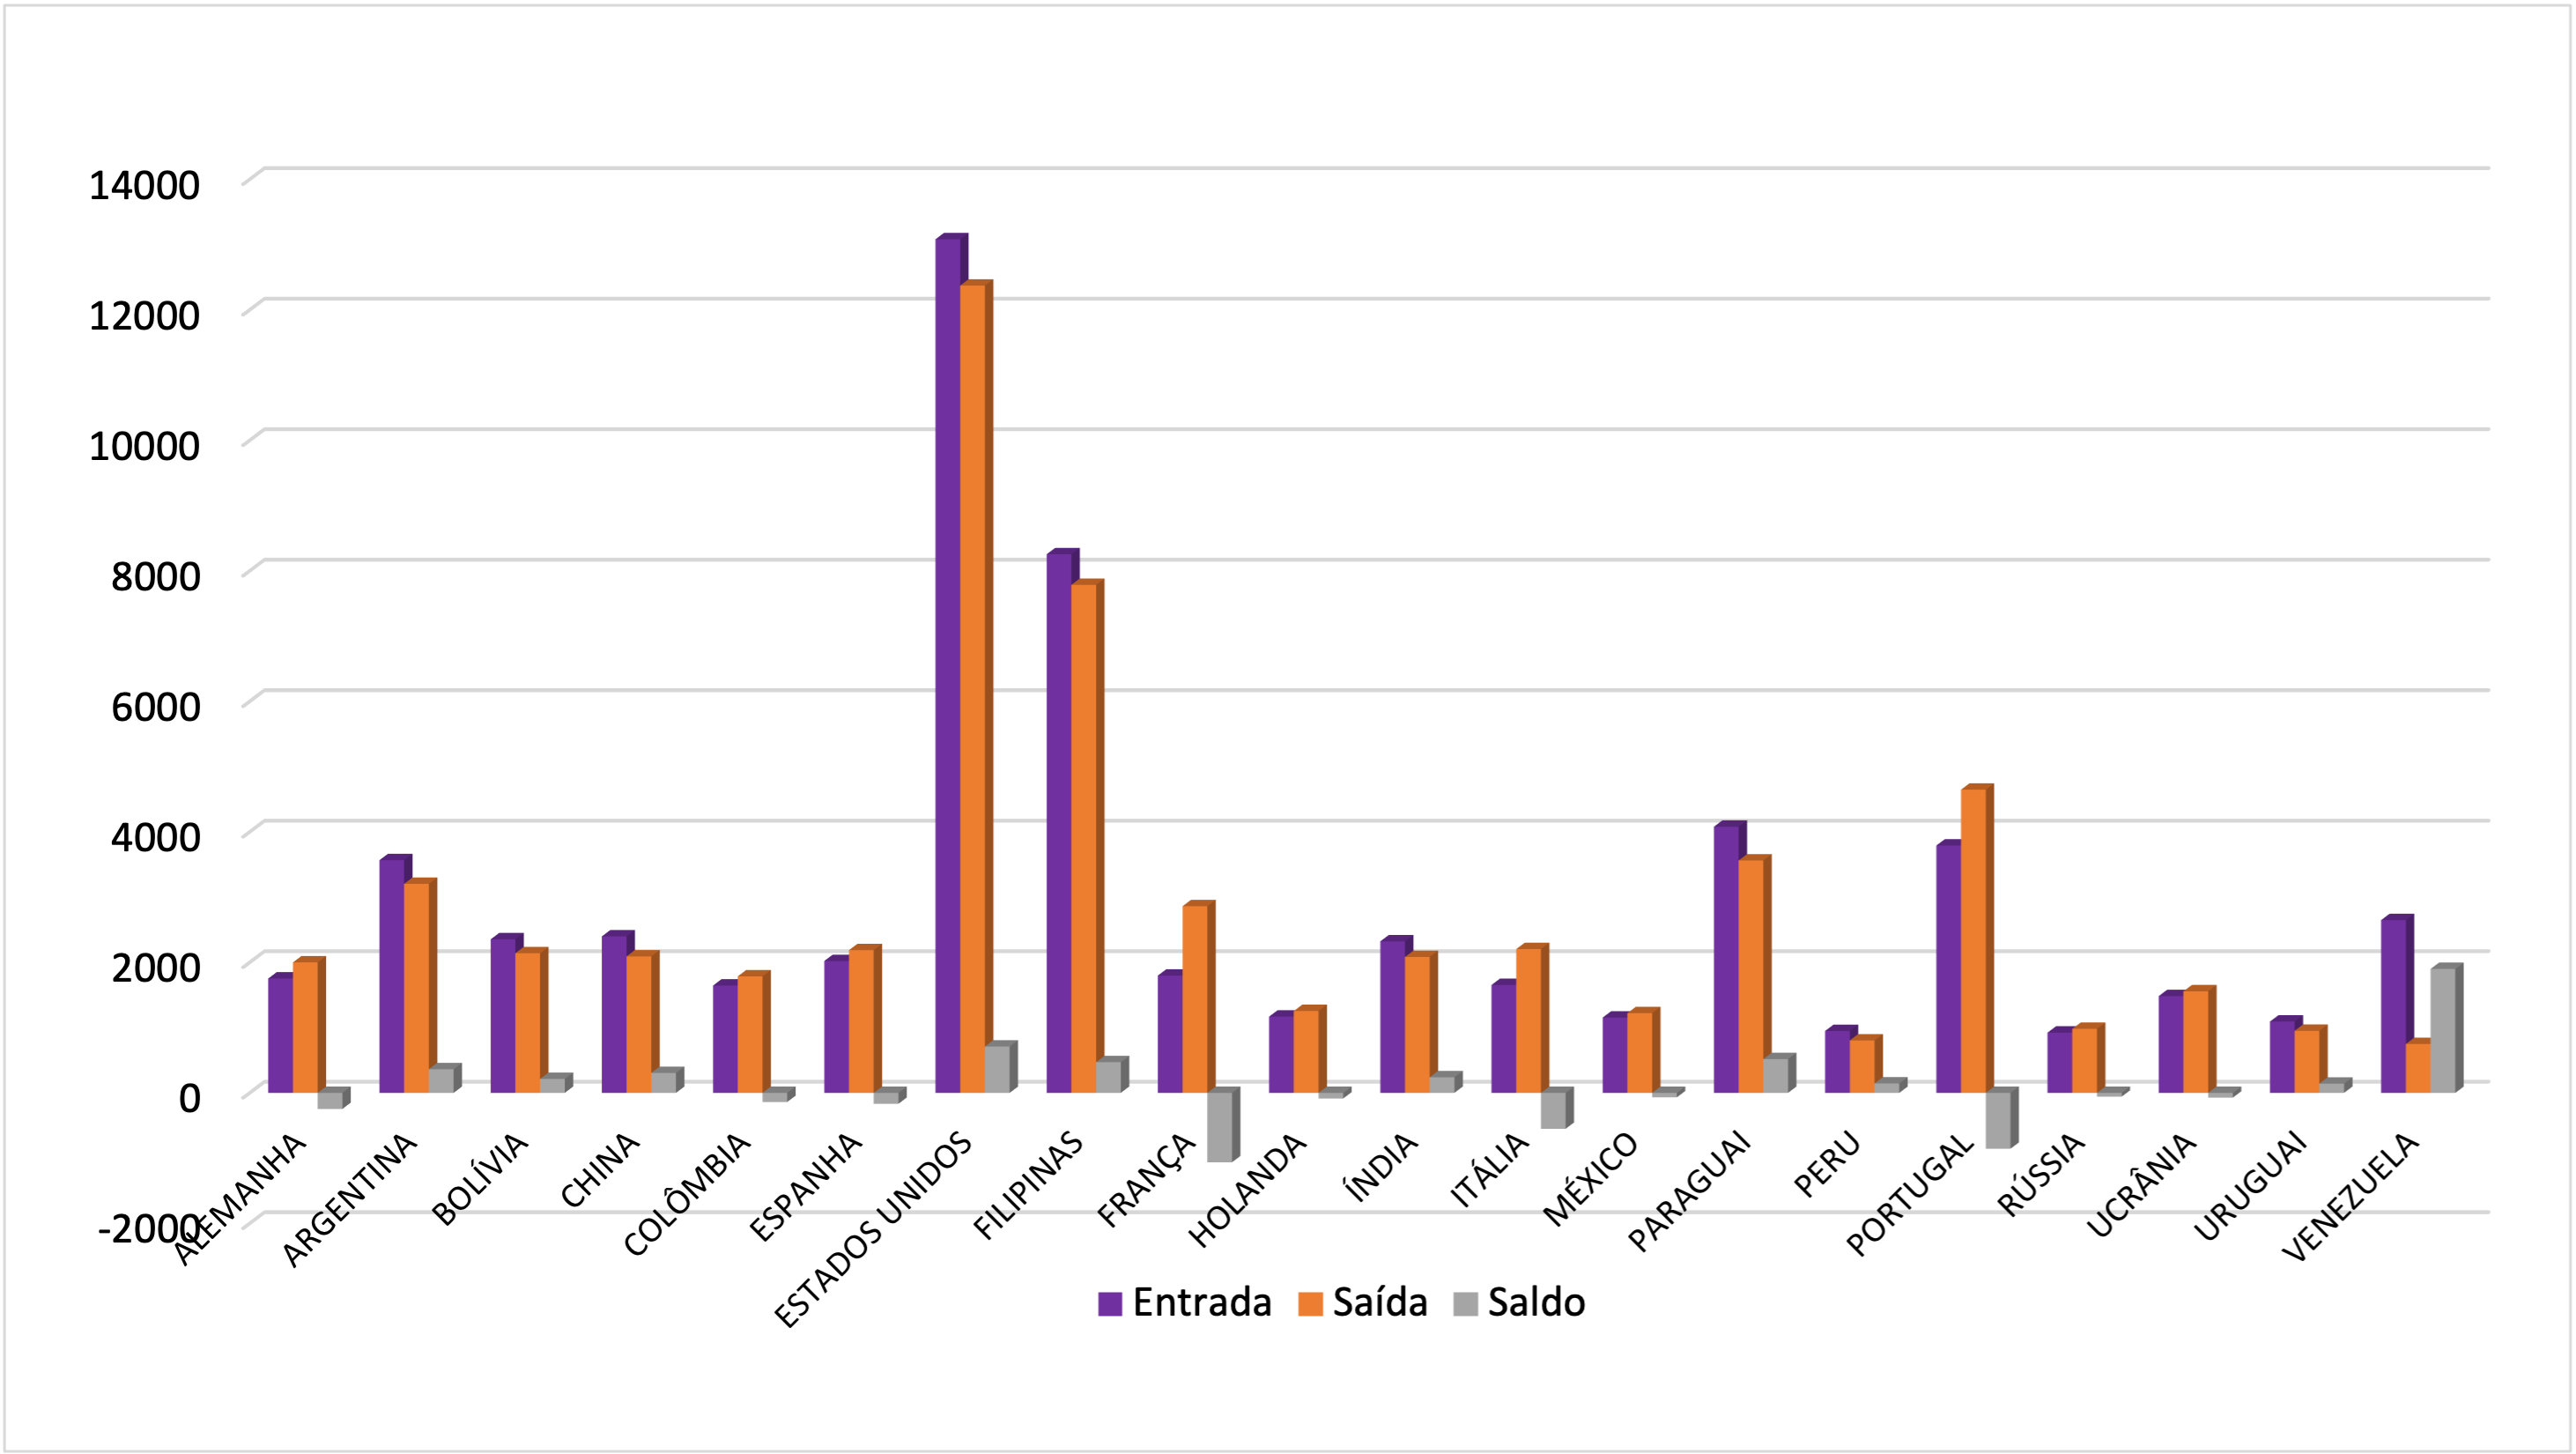
Source: OBMigra (July 2021), based on data from the Brazilian Federal Police, International Traffic System (STI)
STI-MAR
STI-MAR (International Traffic System - Warning and Restrictions Module)
Following the observed pattern in residence registrations, there was a notable increase in applications for recognition of refugee status compared to previous months. This suggests that the decision regarding the free admission of Venezuelans, approved on June 24, had an impact on the rise in applications. However, it is important to note that the volume of registrations is still considerably lower than pre-COVID-19 crisis levels (Graph 10). Further analysis of the main municipalities that received these applications confirms that the opening of land borders played a significant role in the increased number of applications. Graph 11 clearly illustrates that Pacaraima's performance is significantly superior to that of other main municipalities.
Venezuelans remain the predominant nationality in terms of requests for recognition as refugees, with Angolans and Bengalis following at a considerable distance. Notably, the number of requests submitted by Haitians and Cubans has been decreasing over the analyzed period (Map 3).
.
GRAPH 10
Number of asylum claims, by month of registration - Brazil, 2019-2021

Source: OBMigra (July 2021), based on data from the Brazilian Federal Police, International Traffic System - Warning and Restrictions Module (STI-MAR).
GRAPH 11
Number of applications for recognition of refugee status, by main municipalities - Brazil, June 2021.

Source: OBMigra (July 2021), based on data from the Brazilian Federal Police, International Traffic System - Warning and Restrictions Module (STI-MAR).
MAP 3
Number of applications for recognition of refugee status, by main countries of nationality, July 2021
Source: OBMigra (July 2021), based on data from the Brazilian Federal Police, Asylum Claims.
COMO CITAR
The reproduction of this text and the data contained therein is permitted, provided that proper citation of the source is included. Reproduction for commercial use is prohibited.
How to cite this text:
| CAVALCANTI, L; OLIVEIRA, T; FURTADO, A; DICK, P; QUINTINO, F; GUIMARÃES, B. Acompanhamento de fluxo e empregabilidade dos imigrantes no Brasil: Relatório Mensal do OBMigra Ano 2, Número 7, julho de 2021/ Observatório das Migrações Internacionais; Brasília, DF: OBMigra, 2021. Available at: https://portaldeimigracao.mj.gov.br/pt/dados/relatorios-mensais |