STI
STI (International Traffic System)
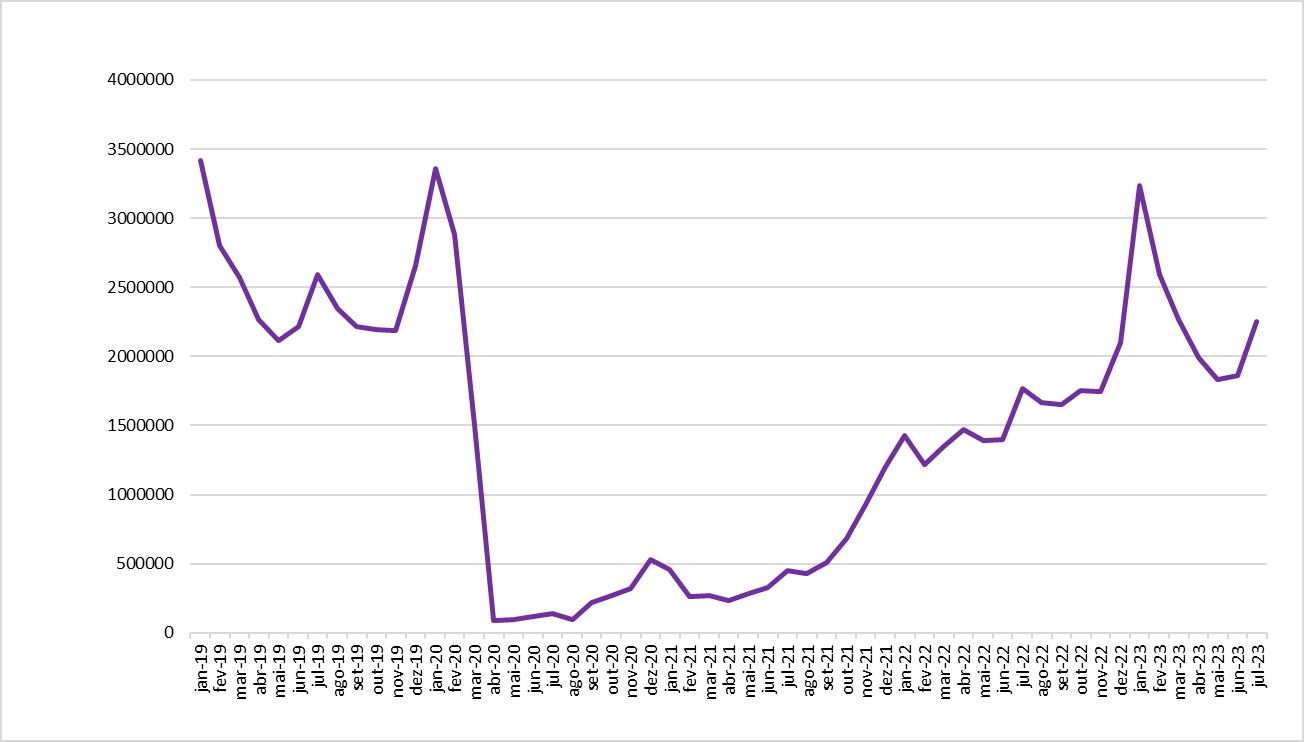
In July, there was a notable increase in cross-border movement, reaching 2.3 million. This marked a significant positive change of 20.8% compared to the previous month and a substantial year-over-year growth of 27.2% (Graph 3).
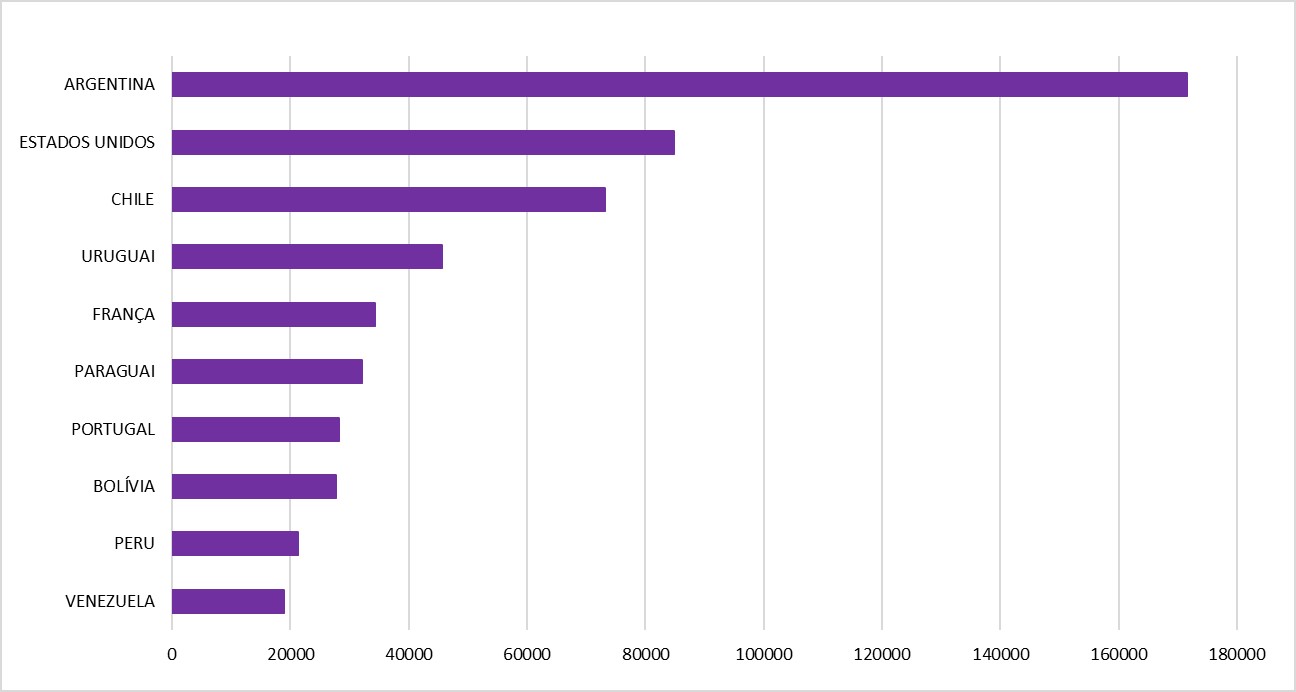
The largest number of people moving across Brazil's borders were from Argentina and the United States (Graph 4).
GRAPH 3
Cross-border movements, by month of registration, Brazil 2019/2023.
Source: OBMigra (July 2023), based on data from the Brazilian Federal Police, International Traffic System (STI).
GRAPH 4
Cross-border movements, according to main countries - Brazil, July 2023.
Source: OBMigra (July 2023), based on data from the Brazilian Federal Police, International Traffic System (STI).
SISMIGRA
SisMigra (National Migration Registry System)
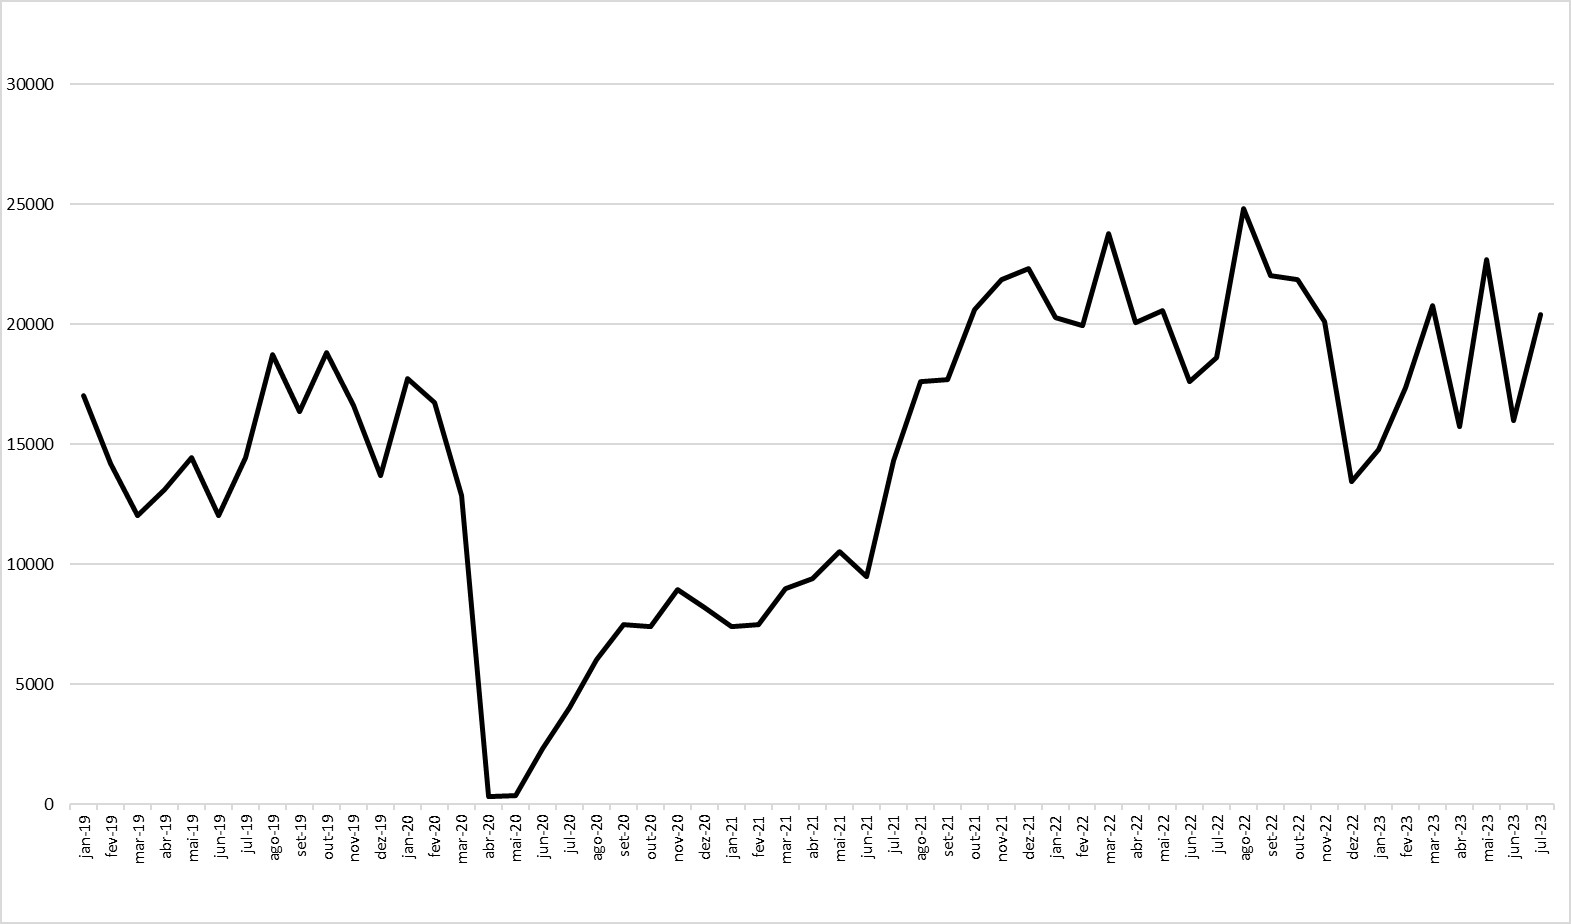
The volume of immigrant registrations has been fluctuating since March this year, at around 20,000 registrations (Graph 5). In July there were 20,400 applications for residence, most of them for temporary immigrants.
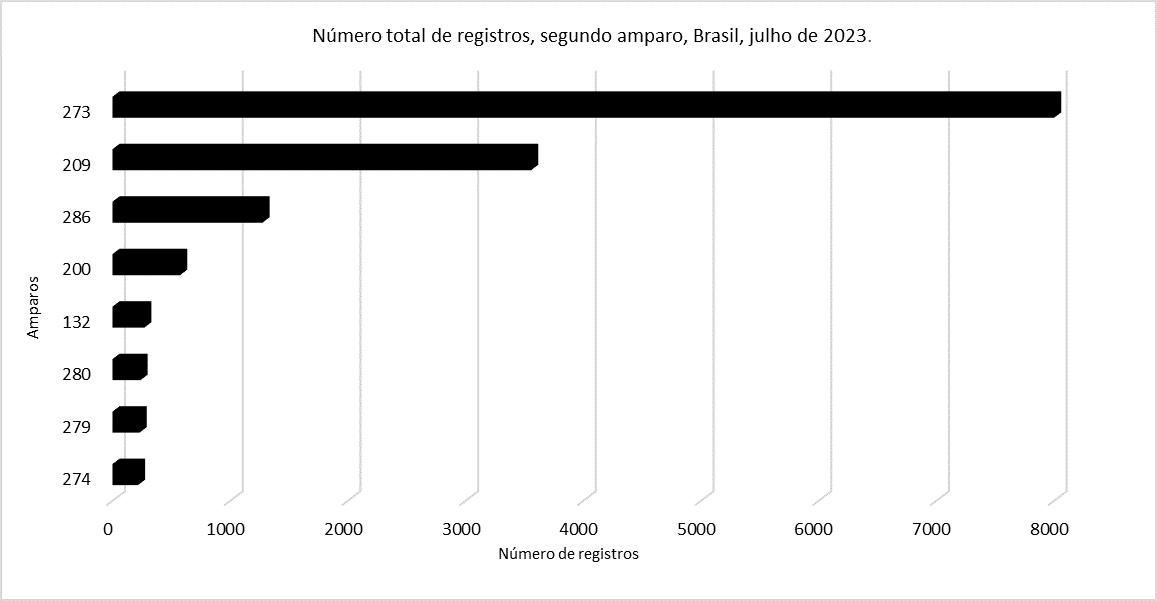
In the month, the most frequently purposes applied were No. 273 (Venezuelan admission), 209 (Mercosur Residence Agreement) and 286 (family reunification), as can be seen in Graph 6.
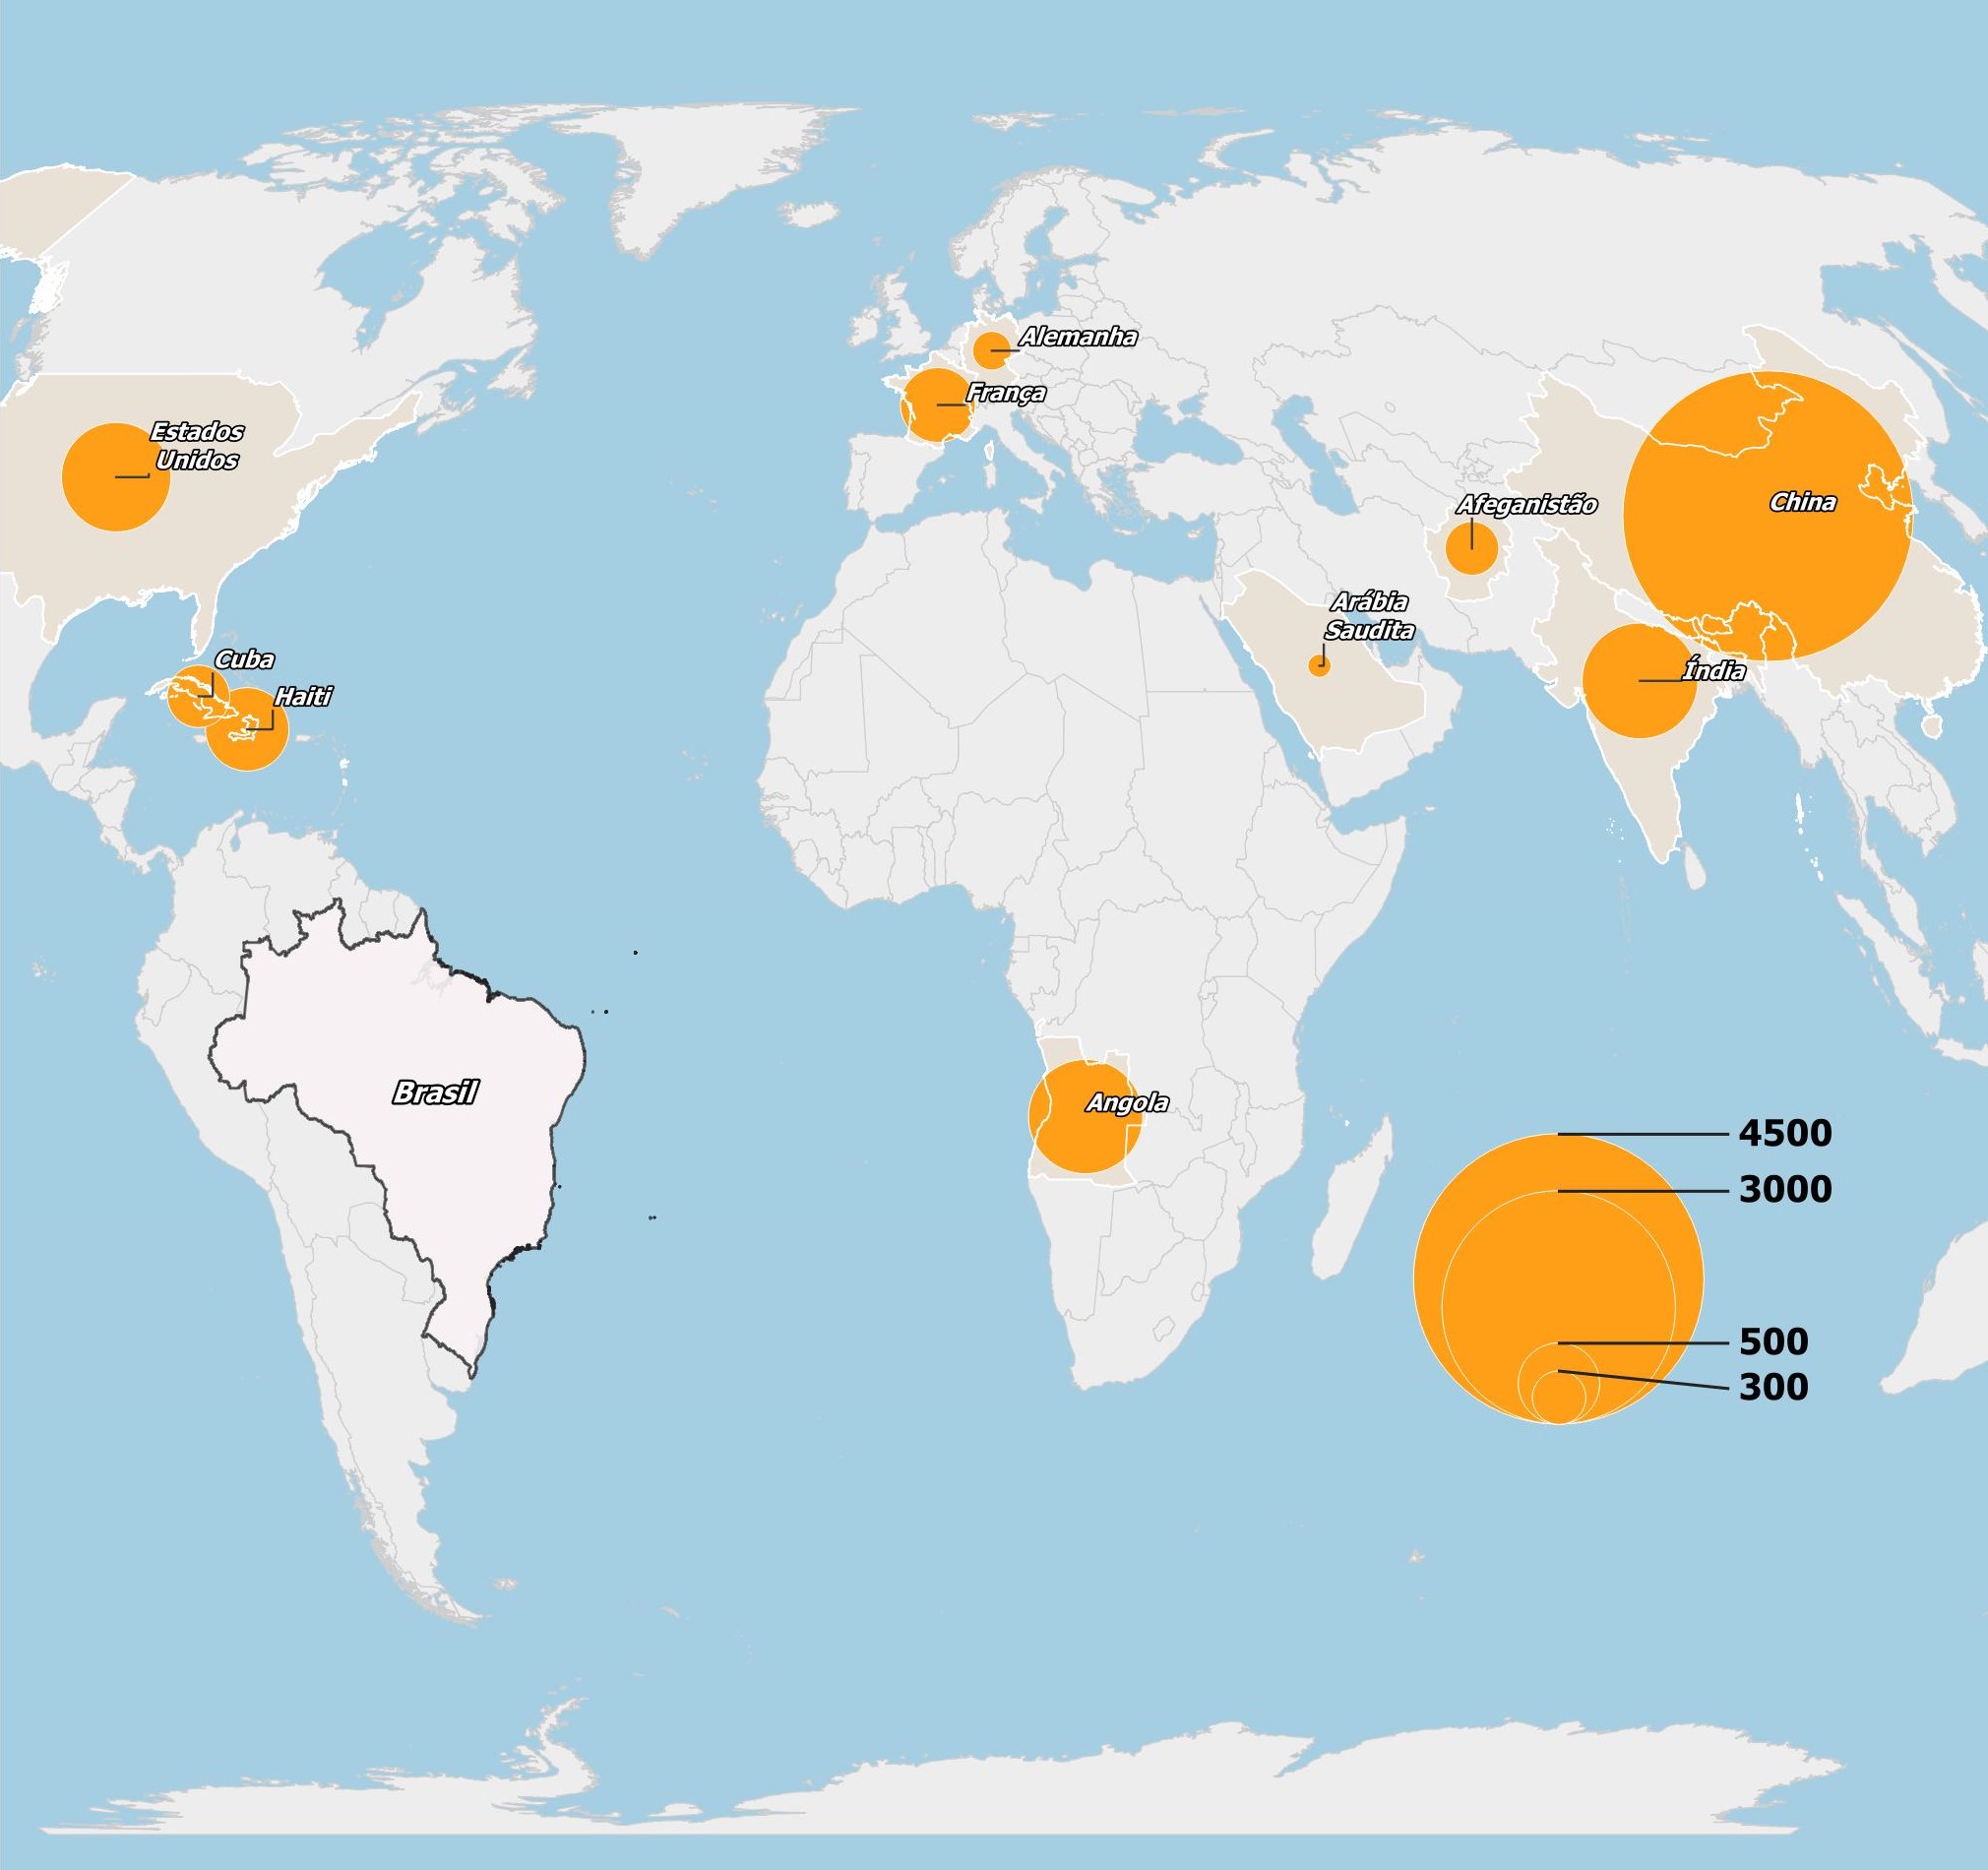
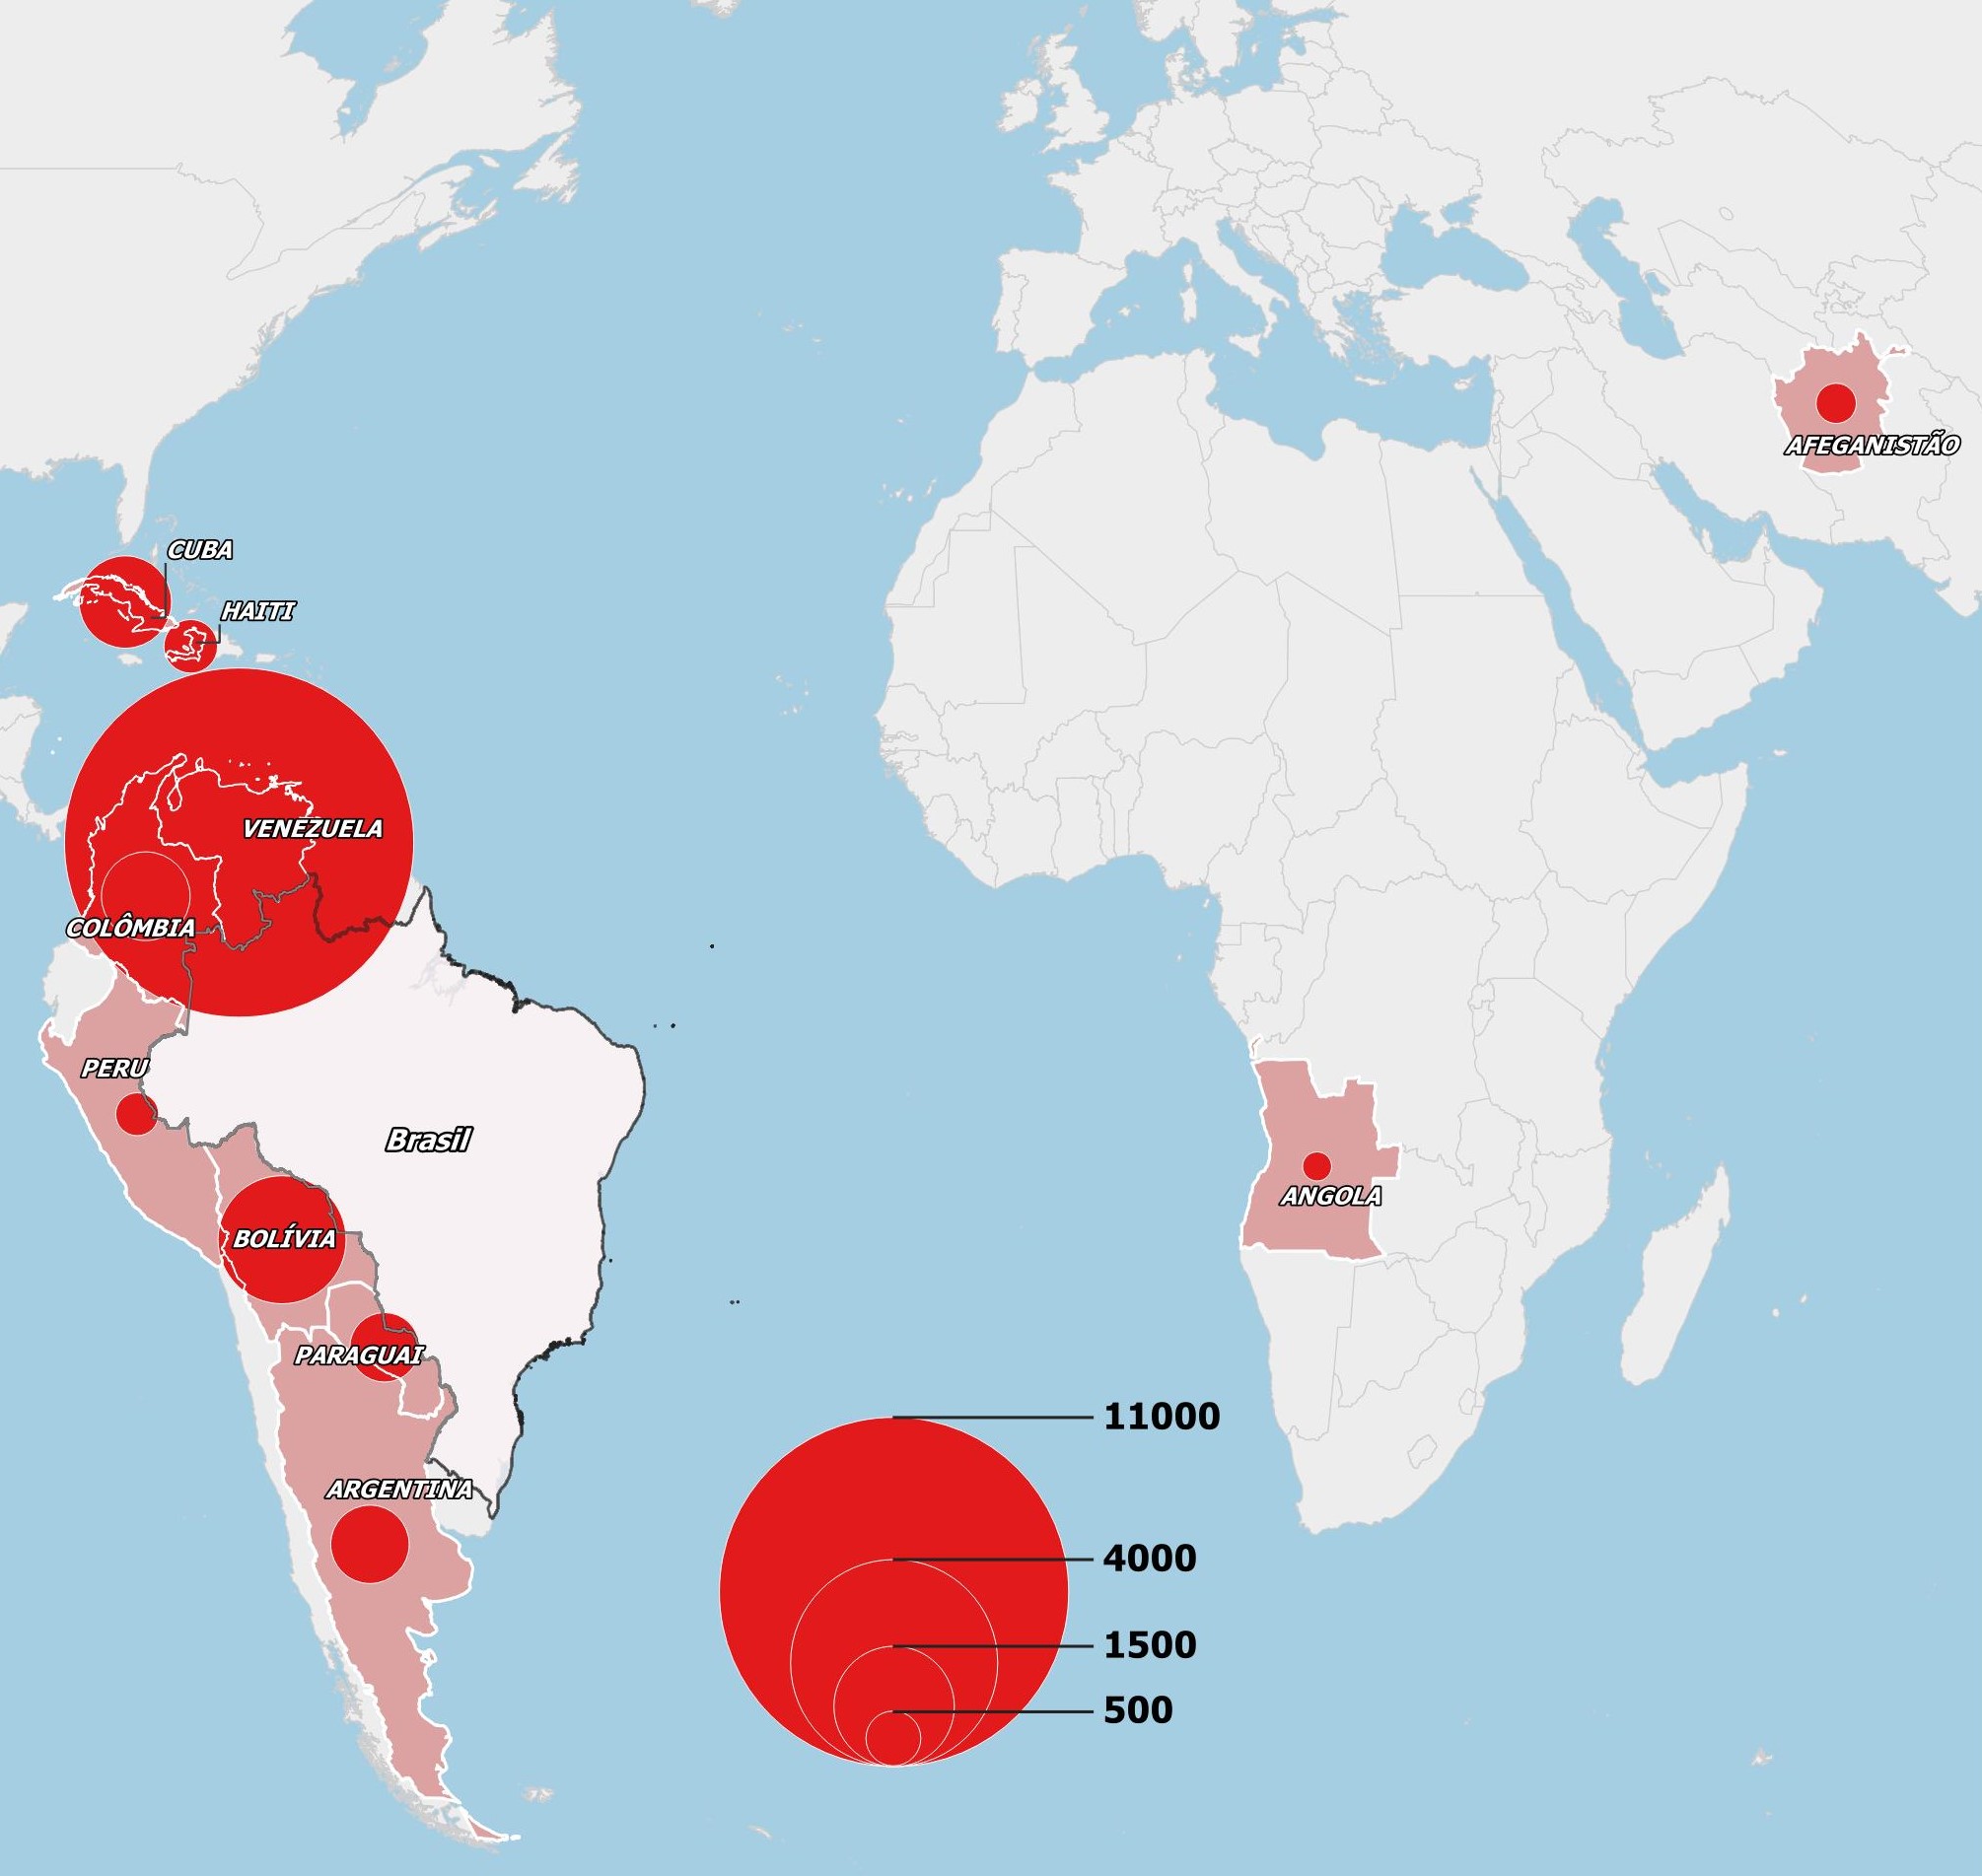
Venezuelans are structurally the main immigration flow into the country, followed by Bolivians, Cubans and Colombians. It is worth mentioning that the top ten nationalities listed in Map 2 do not include any from the Global North.
GRAPH 5
Number of immigrant registrations, by month of registration - Brazil, 2019/2023.
Source: OBMigra (2023), based on data from the Brazilian Federal Police, National Migration Registry System (SISMIGRA).
GRAPH 6
Total number of registrations, according to eligibility grounds, Brazil, July 2023.
Source: OBMigra (2023), based on data from the Brazilian Federal Police, National Migration Registry System (SISMIGRA).
Map 2
Number of immigrant registrations, by main countries of birth, July 2023.
Source: OBMigra (2023), based on data from the Brazilian Federal Police, National Migration Registry System (SISMIGRA).
Solicitantes
Applicants for refugee status recognition
The number of applications for recognition of refugee status continues the downward trend that began last March (Graph 7).
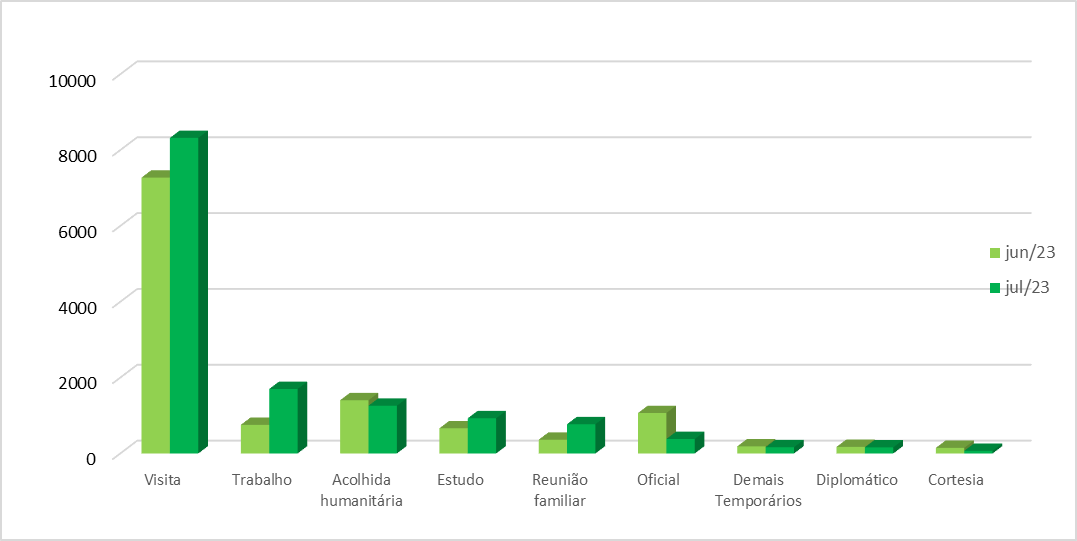
The reduction in the volume of applications was associated with lower demand from Cubans and Vietnamese (Graph 8).
Venezuelans and Cubans were the main nationalities to apply for recognition of refugee status in Brazil (Map 3).
GRAPH 7
Number of applications for recognition of refugee status, by month of registration - Brazil, 2019-2023.
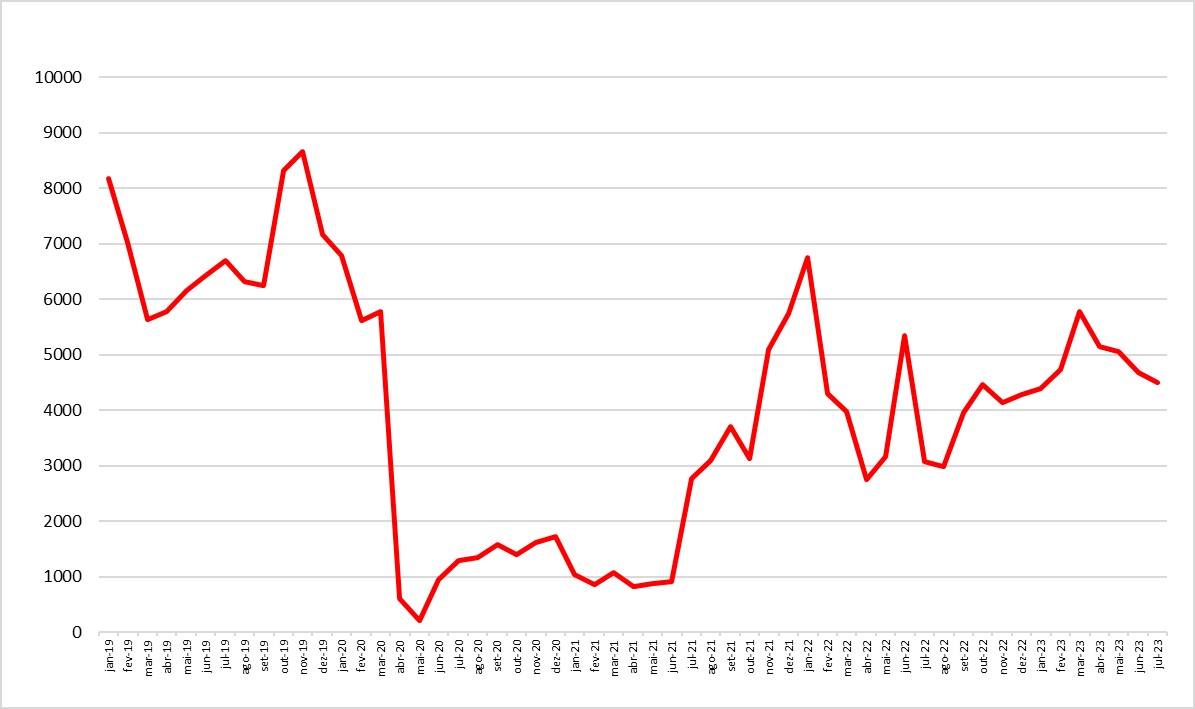
Source: OBMigra (2023), based on data from the Brazilian Federal Police, Asylum Claims, and the System of the National Committee for Refugees (SISCONARE).
GRAPH 8
Number of applications for recognition of refugee status, by month and main countries - Brazil, June and July 2023.
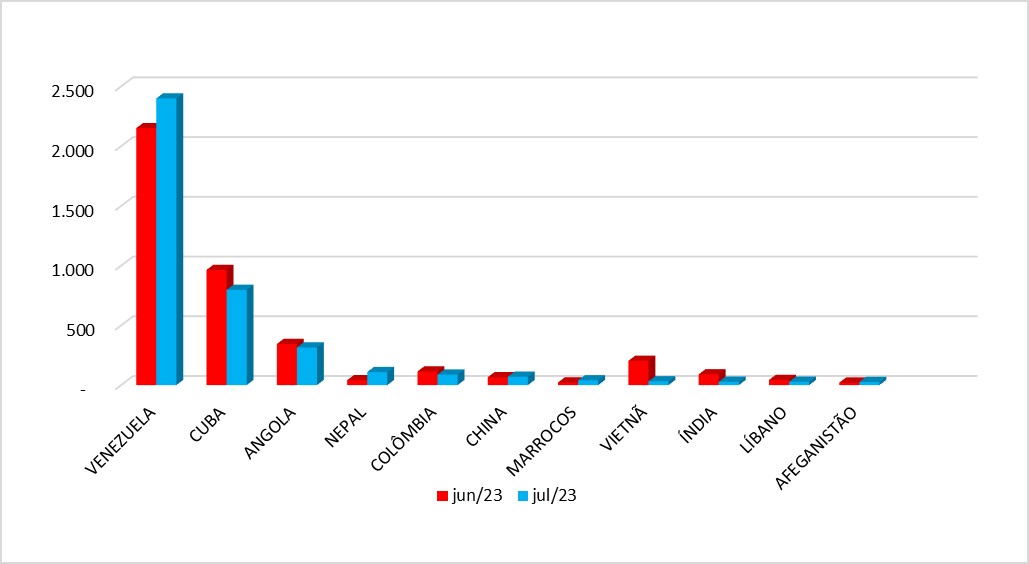
Source: OBMigra (2023), based on data from the Brazilian Federal Police, Asylum Claims, and the System of the National Committee for Refugees (SISCONARE).
MAP 3
Number of applicants for recognition of refugee status, according to main countries, July 2023.
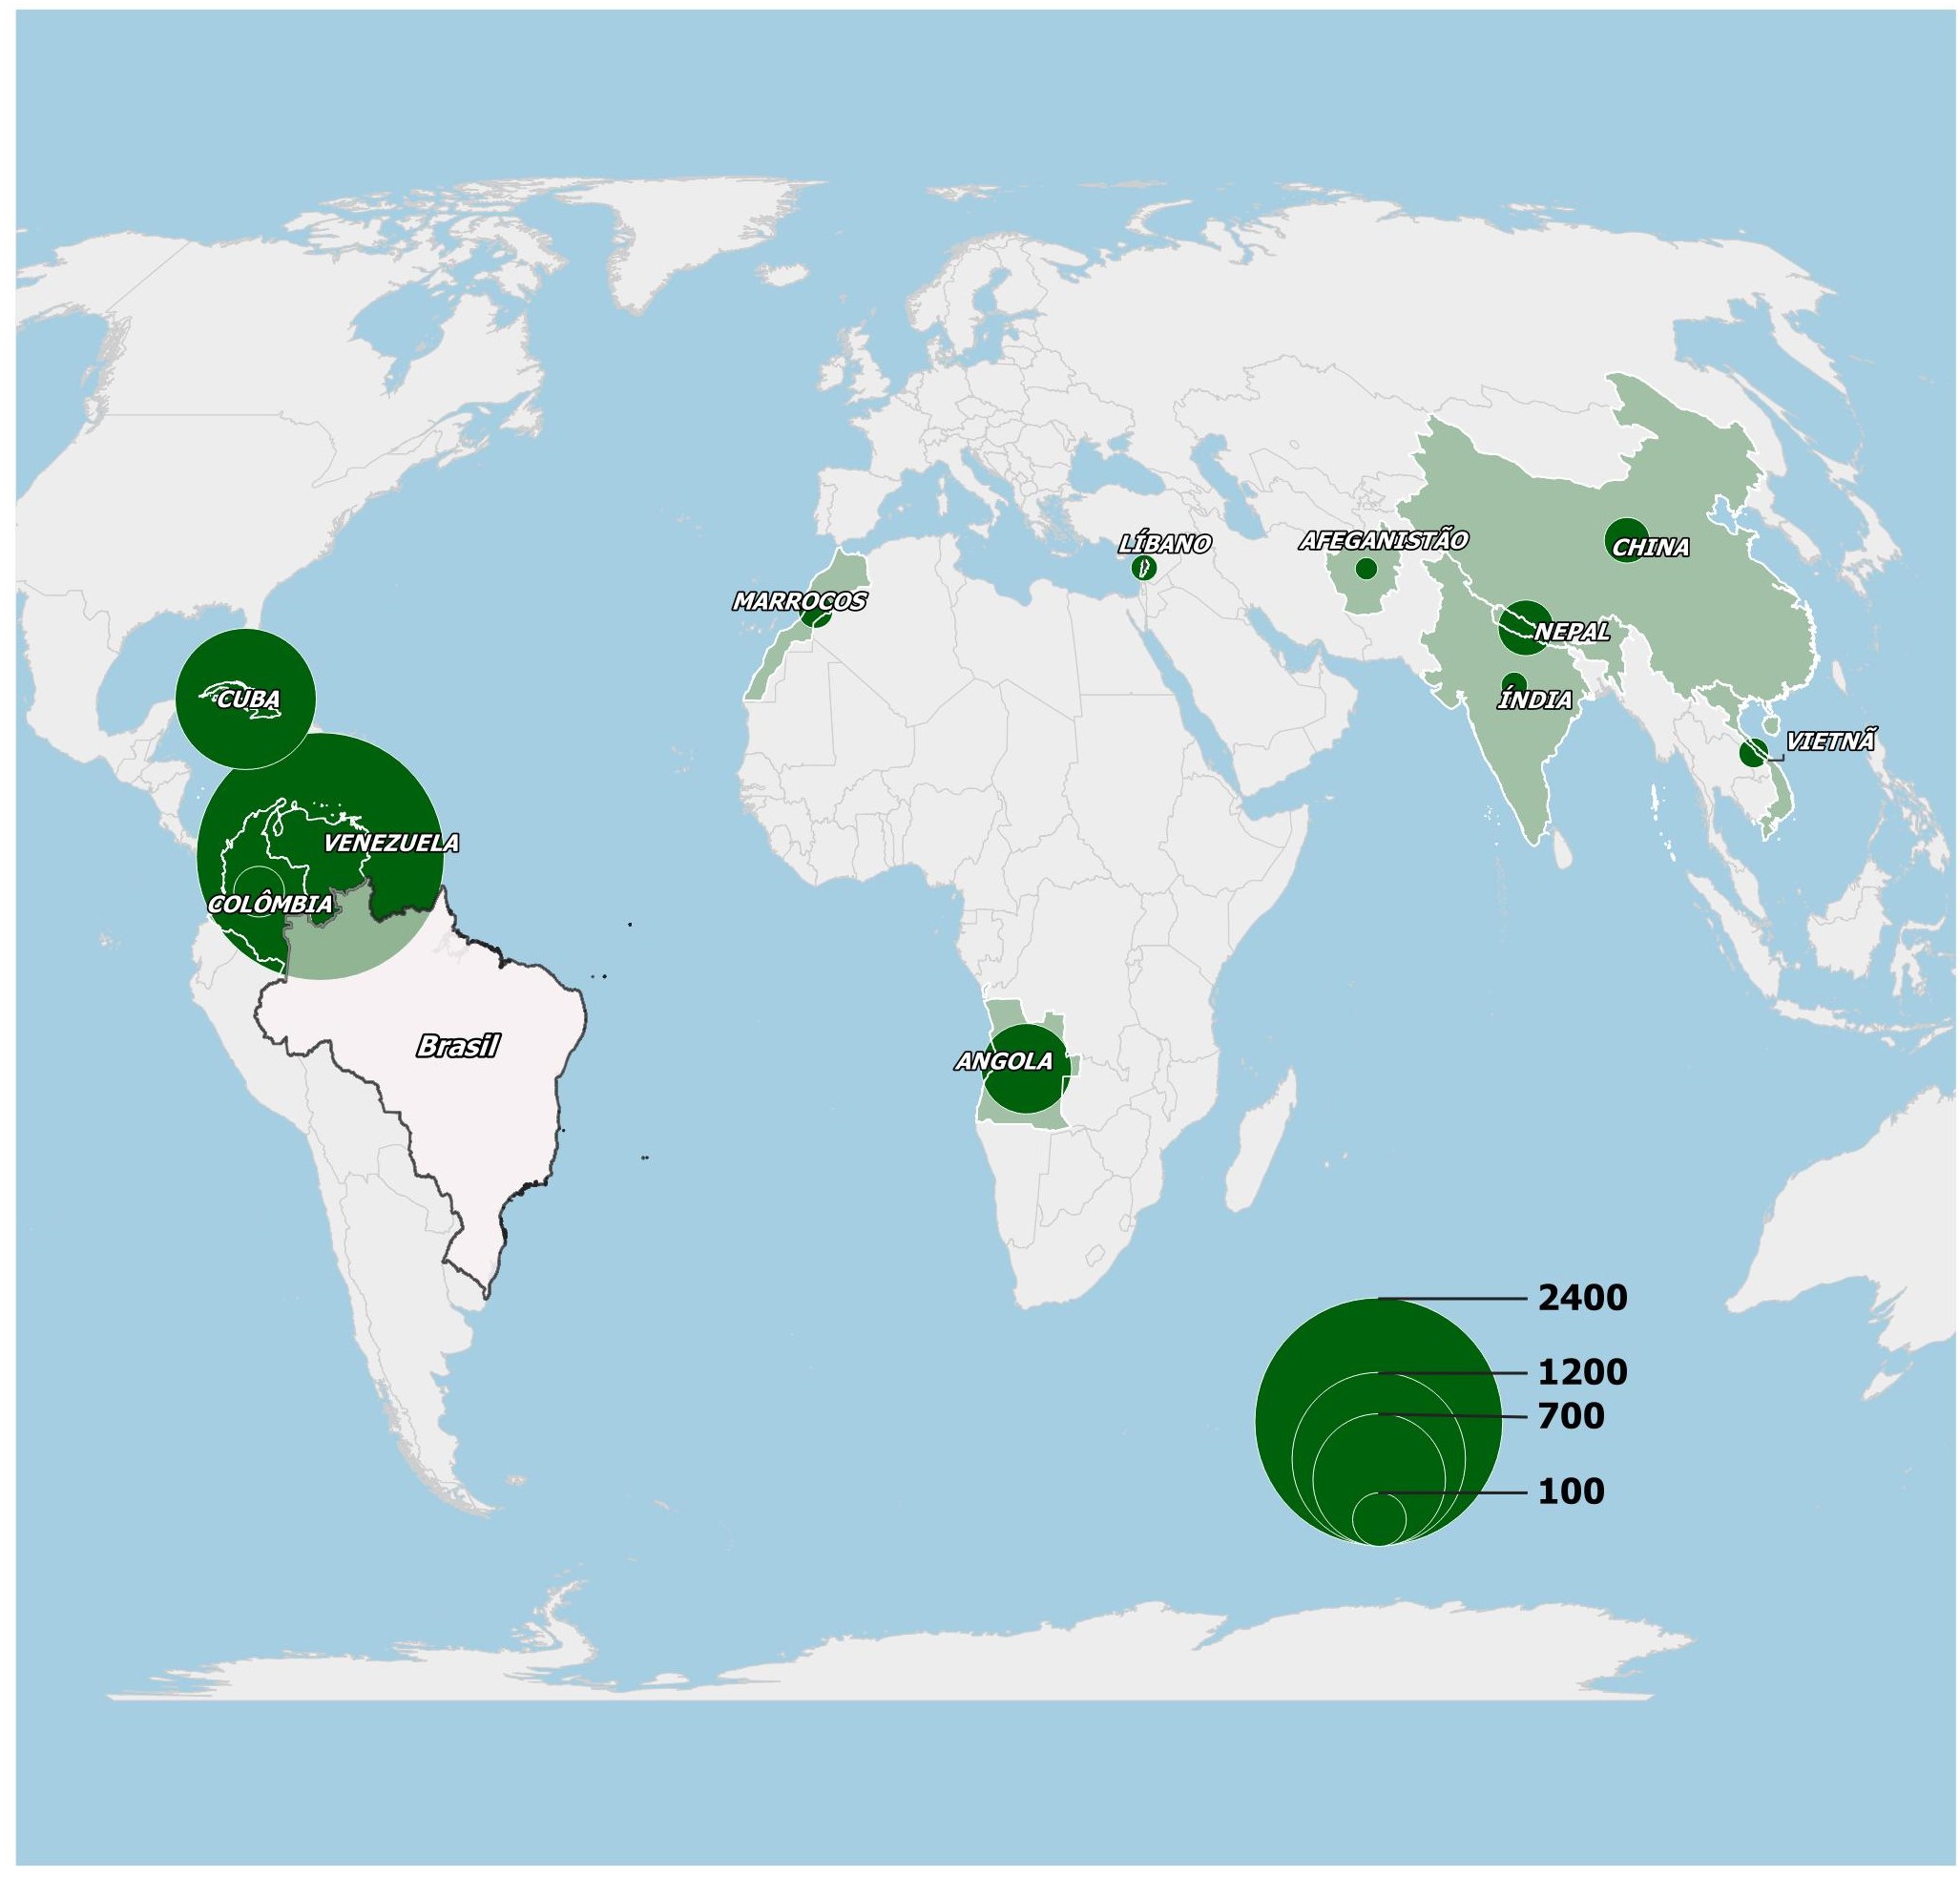
Source: OBMigra (2023), based on data from the Brazilian Federal Police, Asylum Claims, and the System of the National Committee for Refugees (SISCONARE).
CGIL
CGIL (General Coordination of Labor Immigration)
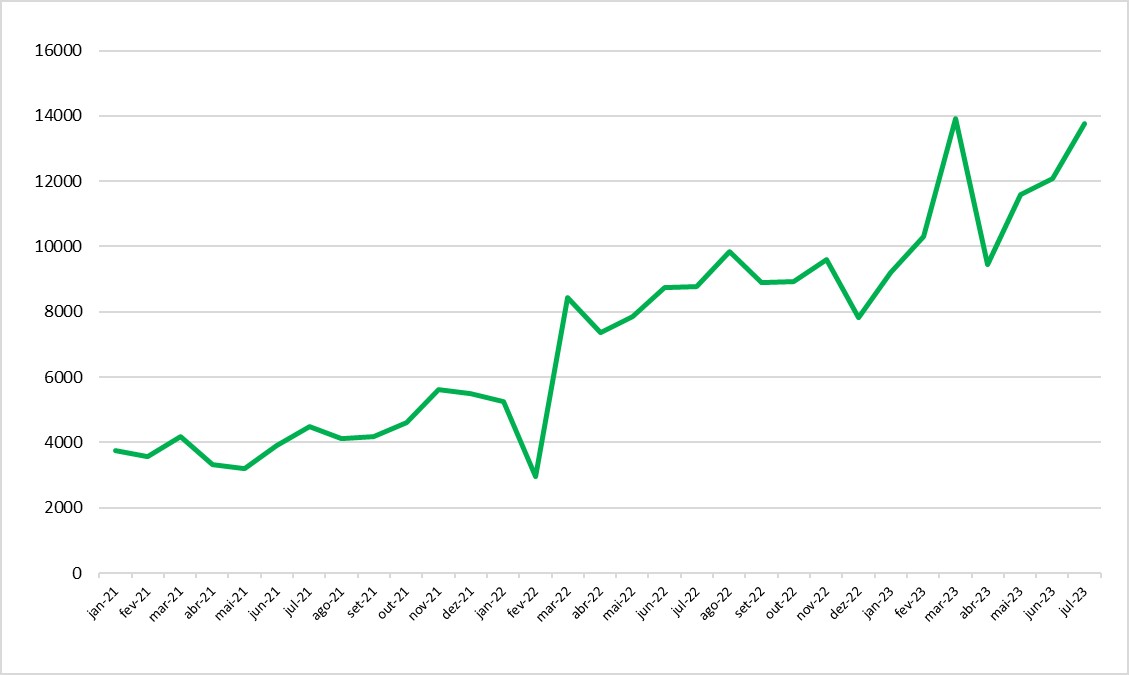
The volume of permits for work and investment purposes increased both on a monthly (10.2%) and annual (7.2%) basis, as shown in Graph 9.
The highest number of grants was given to high-school level workers (39.6%), followed by science and arts professionals (26.0%), as can be seen in Graph 10.
Contrary to the general upward trend in grants, the number of applications among qualified workers fell compared to June for all the Normative Resolutions (Graph 11).
GRAPH 9
Number of work permits for labor and investment purposes, by month of registration - Brazil, 2019-2023
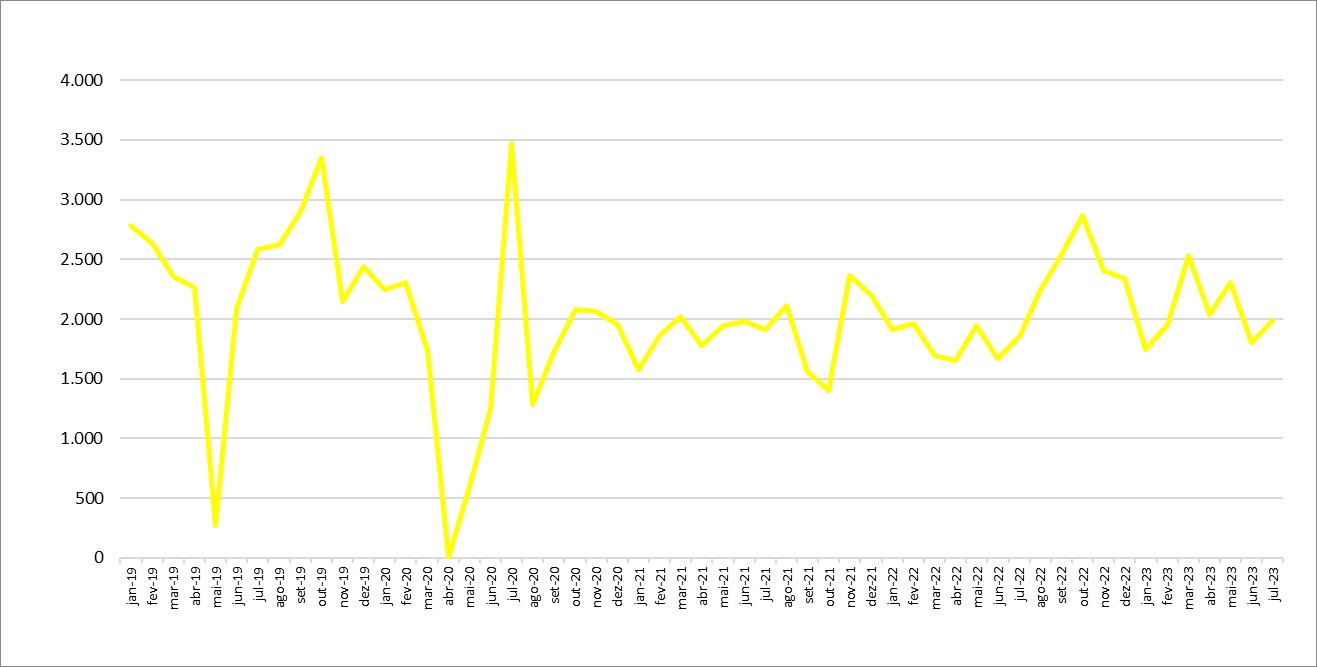
Source: OBMigra (2023), based on data from the General Coordination of Labor Immigration (CGIL).
GRAPH 10
Number of permits granted for work, by occupational group - Brazil, June/2023.
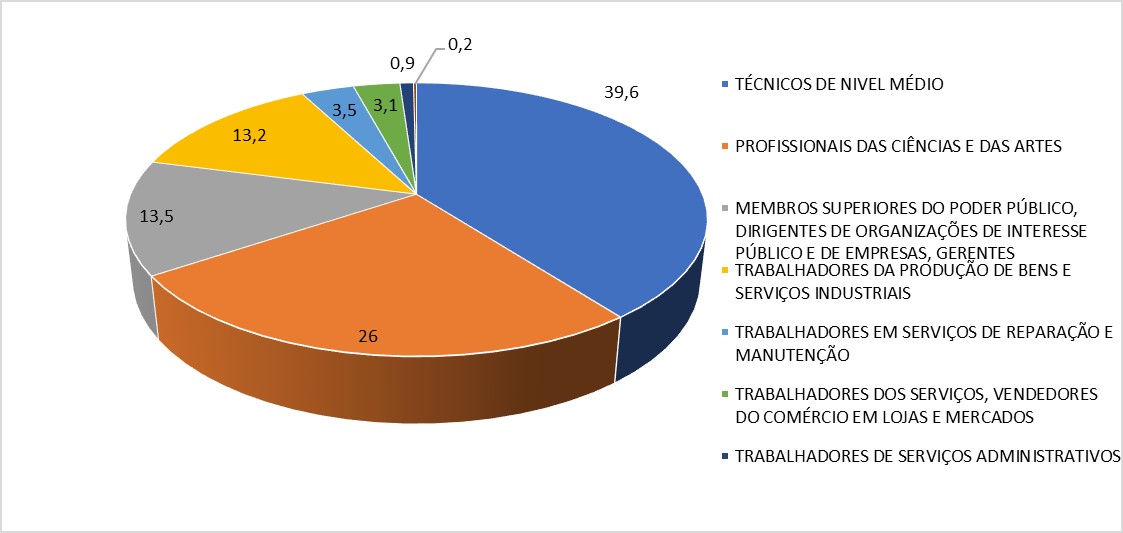
Source: OBMigra (July 2023), based on data from the General Coordination of Labor Immigration/Ministry of Justice and Public Security.nça Pública, julho de 2023.
GRAPH 11
Number of permits granted to skilled workers, by type of permit, Brazil, June and July 2023.
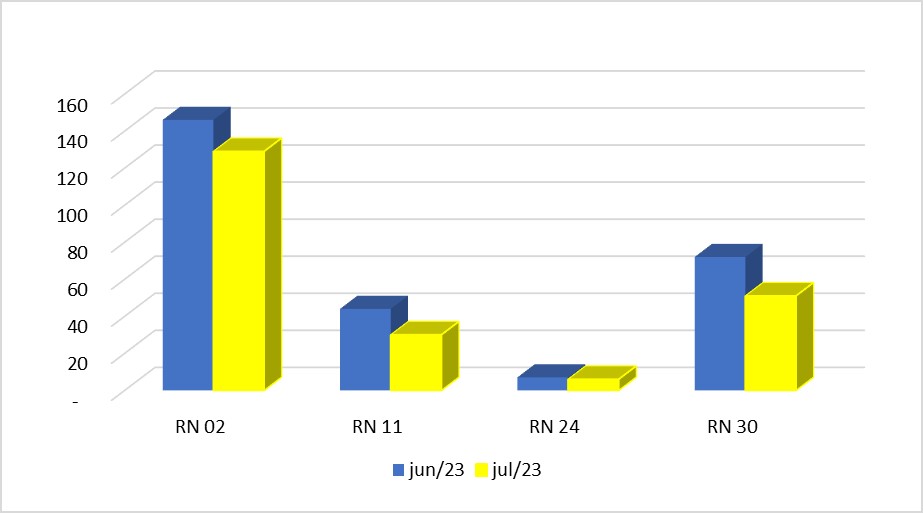
Source: OBMigra (July 2023), based on data from the General Coordination of Labor Immigration/Ministry of Justice and Public Security.
CTPS/RAIS/NOVO CAGED
Harmonized database Work and Social Security Card (CTPS)/Annual Report of Social Information (RAIS)/New General Register of Employed and Unemployed Persons (CAGED)
The number of jobs created for immigrant workers in the informal market fluctuated negatively in June (-5.3%), after successive months of growth, although the balance remains positive (Graph 12).
The month's performance was largely determined by the reduction in job creation for workers with high school and university degrees (Graph 13).
In the South, the number of jobs created was over three times higher than in the Southeast, which was in second place (Map 4).
.
GRAPH 12
Jobs created for immigrants in the formal labor market, by month - Brazil, 2019/2023.
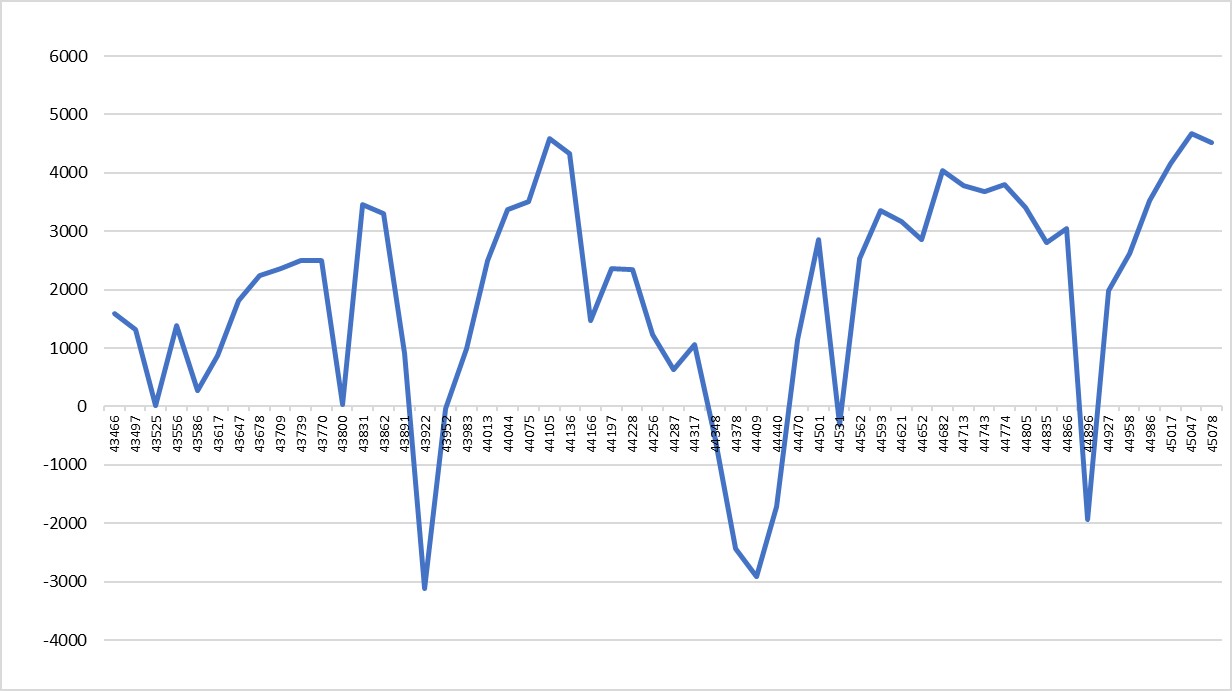
Source: OBMigra (2023), based on data from the harmonized database RAIS-CTPS-CAGED and the Digital System of Tax, Social Security and Labor Obligations (eSocial).
GRAPH 13
Number of jobs created in the formal labor market for immigrants, according to education level - Brazil, May and June 2023.
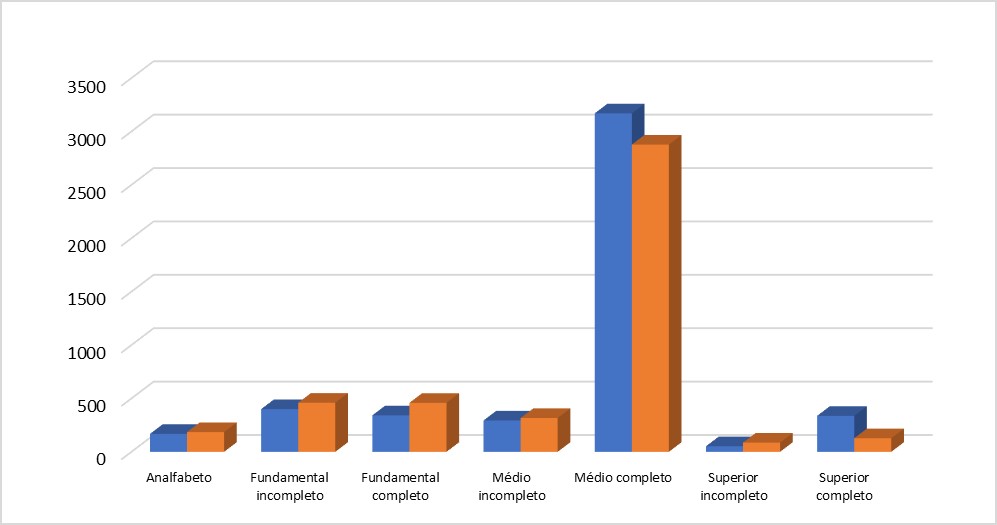
Source: OBMigra (June 2023), based on data from the Ministry of Economy, Harmonized database RAIS-CTPS-CAGED.
MAP 4
Number of jobs created for immigrants, according to Regions, June 2023.
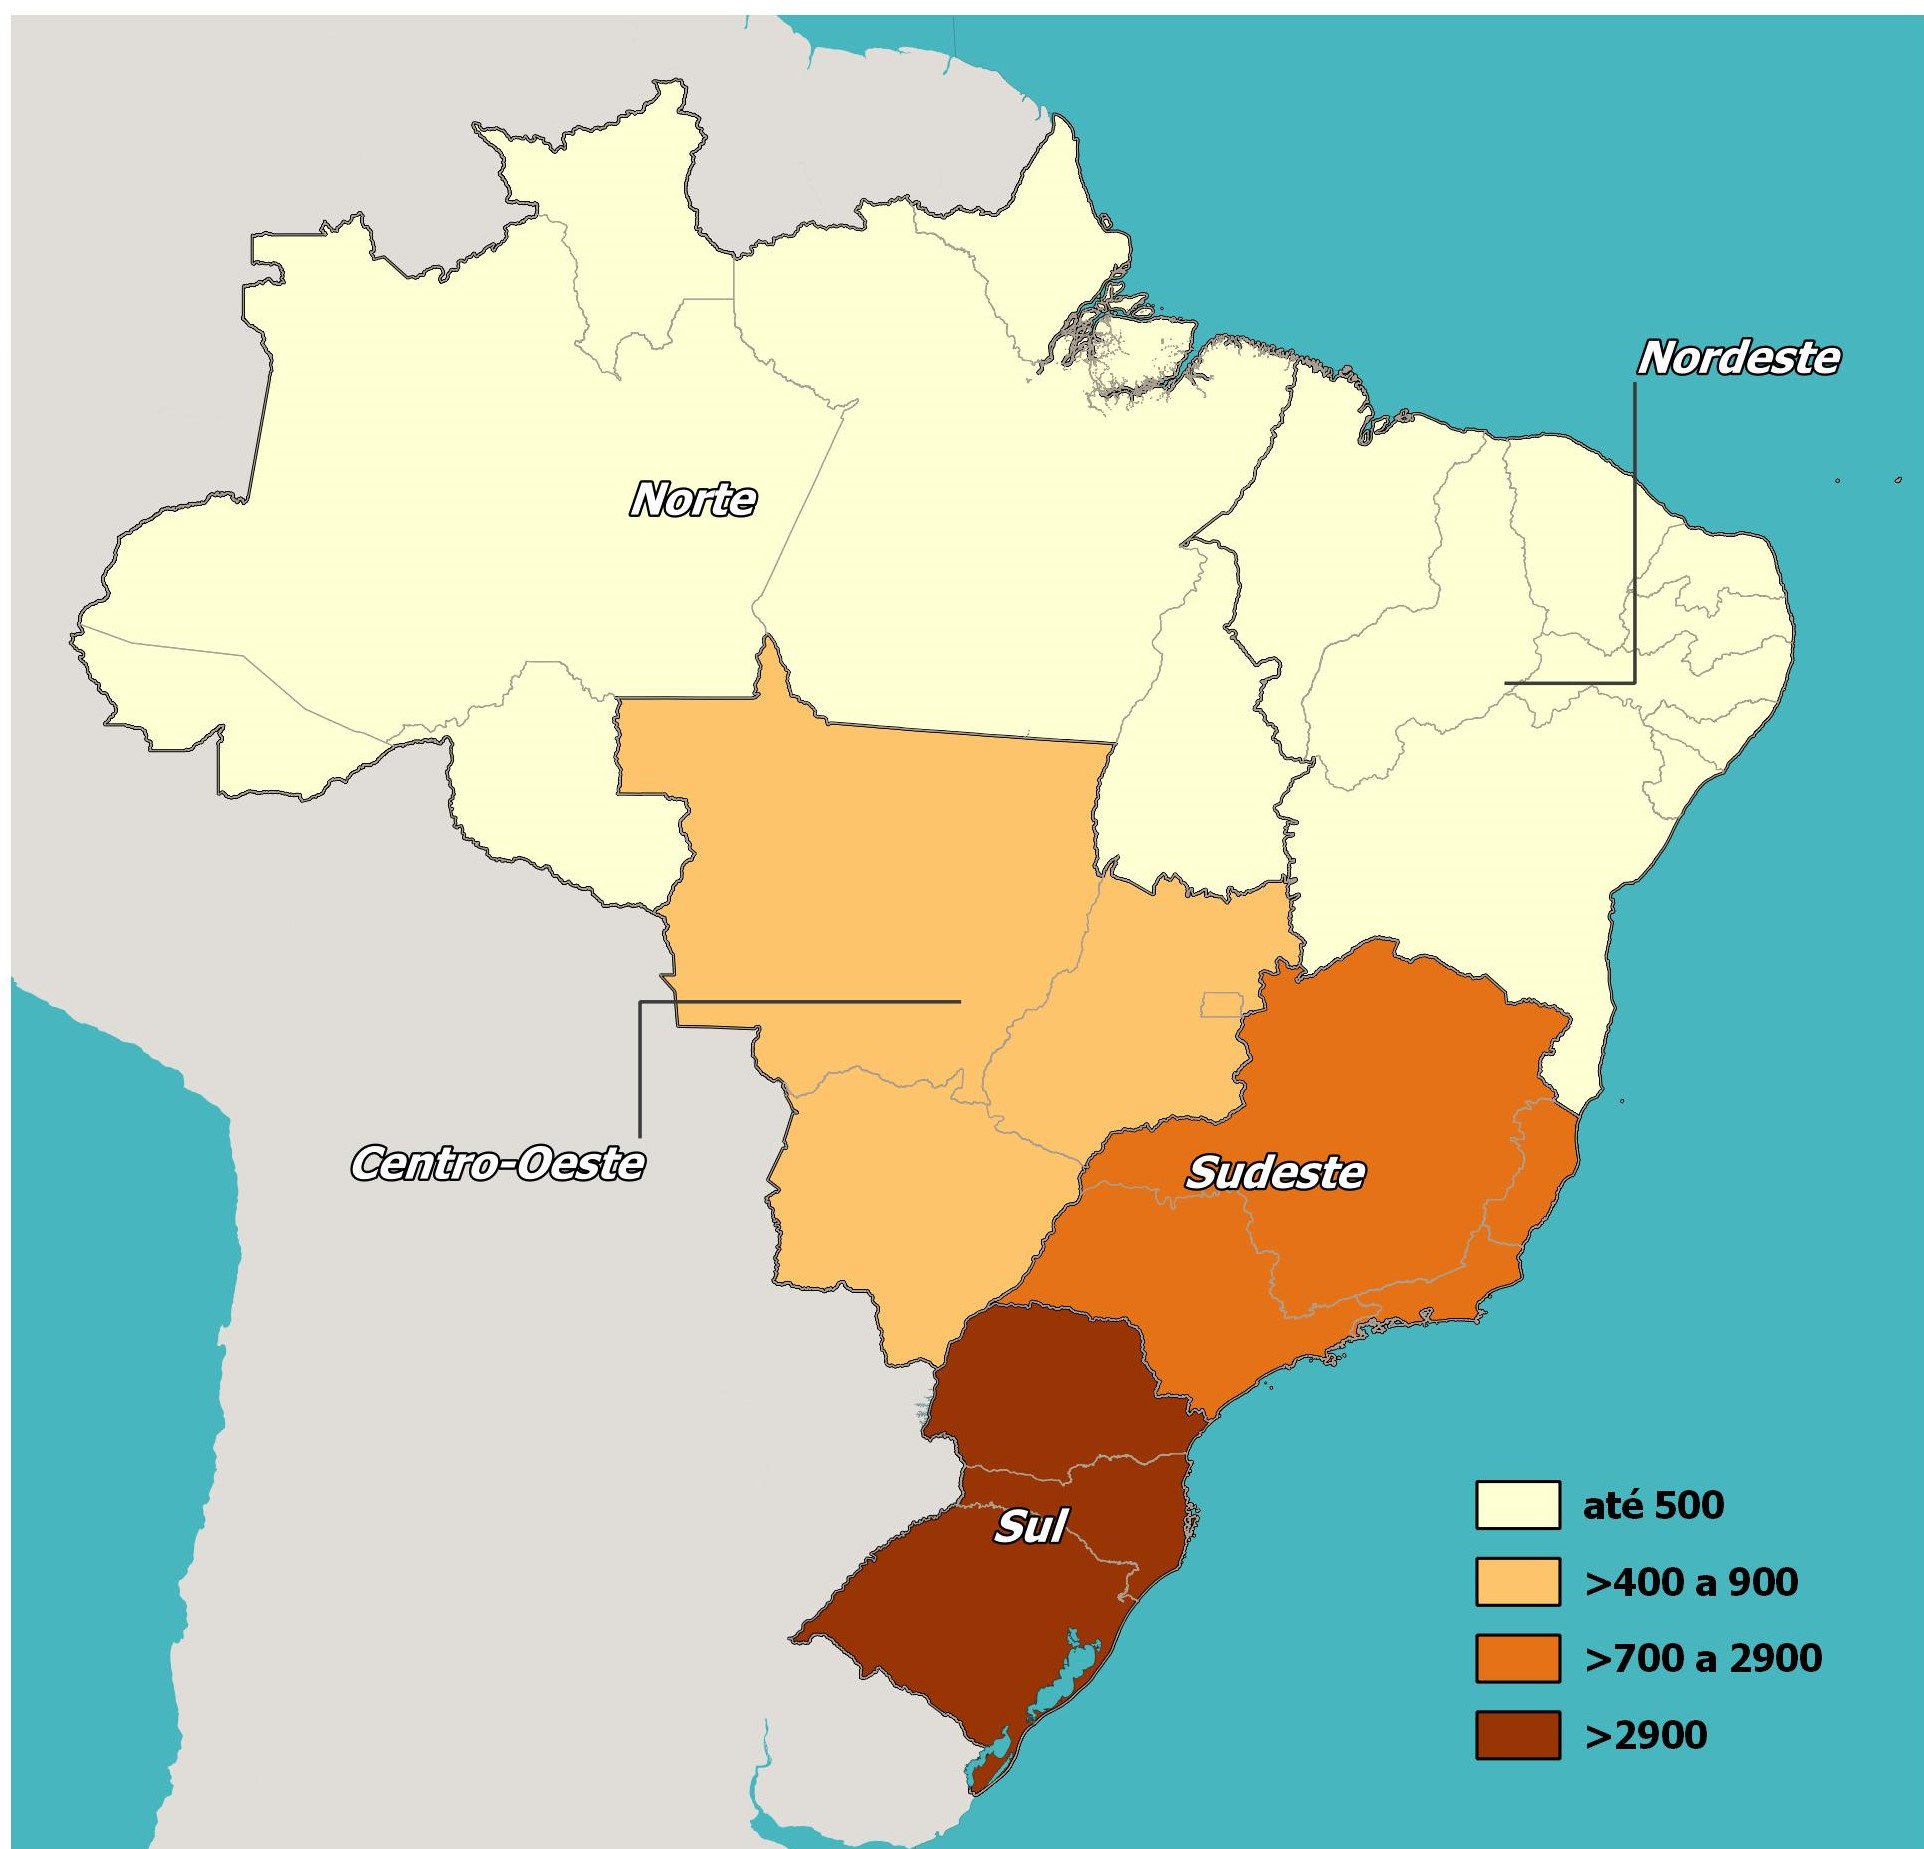
Source: OBMigra (June 2023), based on data from the Ministry of Economy, Harmonized database RAIS-CTPS-CAGED.
BACEN - Transferências Pessoais
BACEN - Personal Bank Transfer
This year, the balance of transfers from personal accounts has fluctuated a lot, averaging around 200 million dollars (Graph 14). As a rule, there has been a reduction in inflows and an increase in outflows.
The United States of America is the main source of funds coming into the country, followed at a distance by Portugal, the United Kingdom and Switzerland (Map 5).
In terms of outflows of resources, these are mostly destined for the United States of America, with Portugal, the United Kingdom and Canada coming in second (Map 6).
GRAPH 14
Balance of transfers via personal accounts in US$ (millions), by month of remittance - Brazil, 2019-2023.
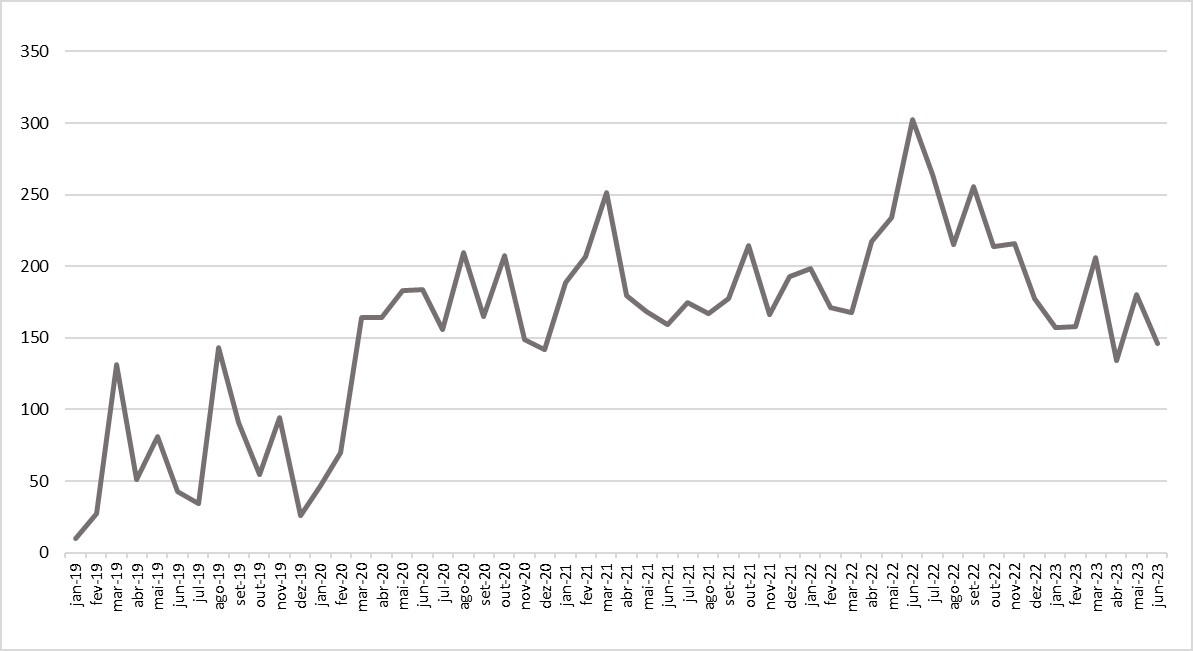
Source:OBMigra (2023), based on data from the Central Bank of Brazil, Department of Statistics.
Map 5
Transfers via personal accounts in US$ (millions), by inflows and by main countries - Brazil, June 2023.
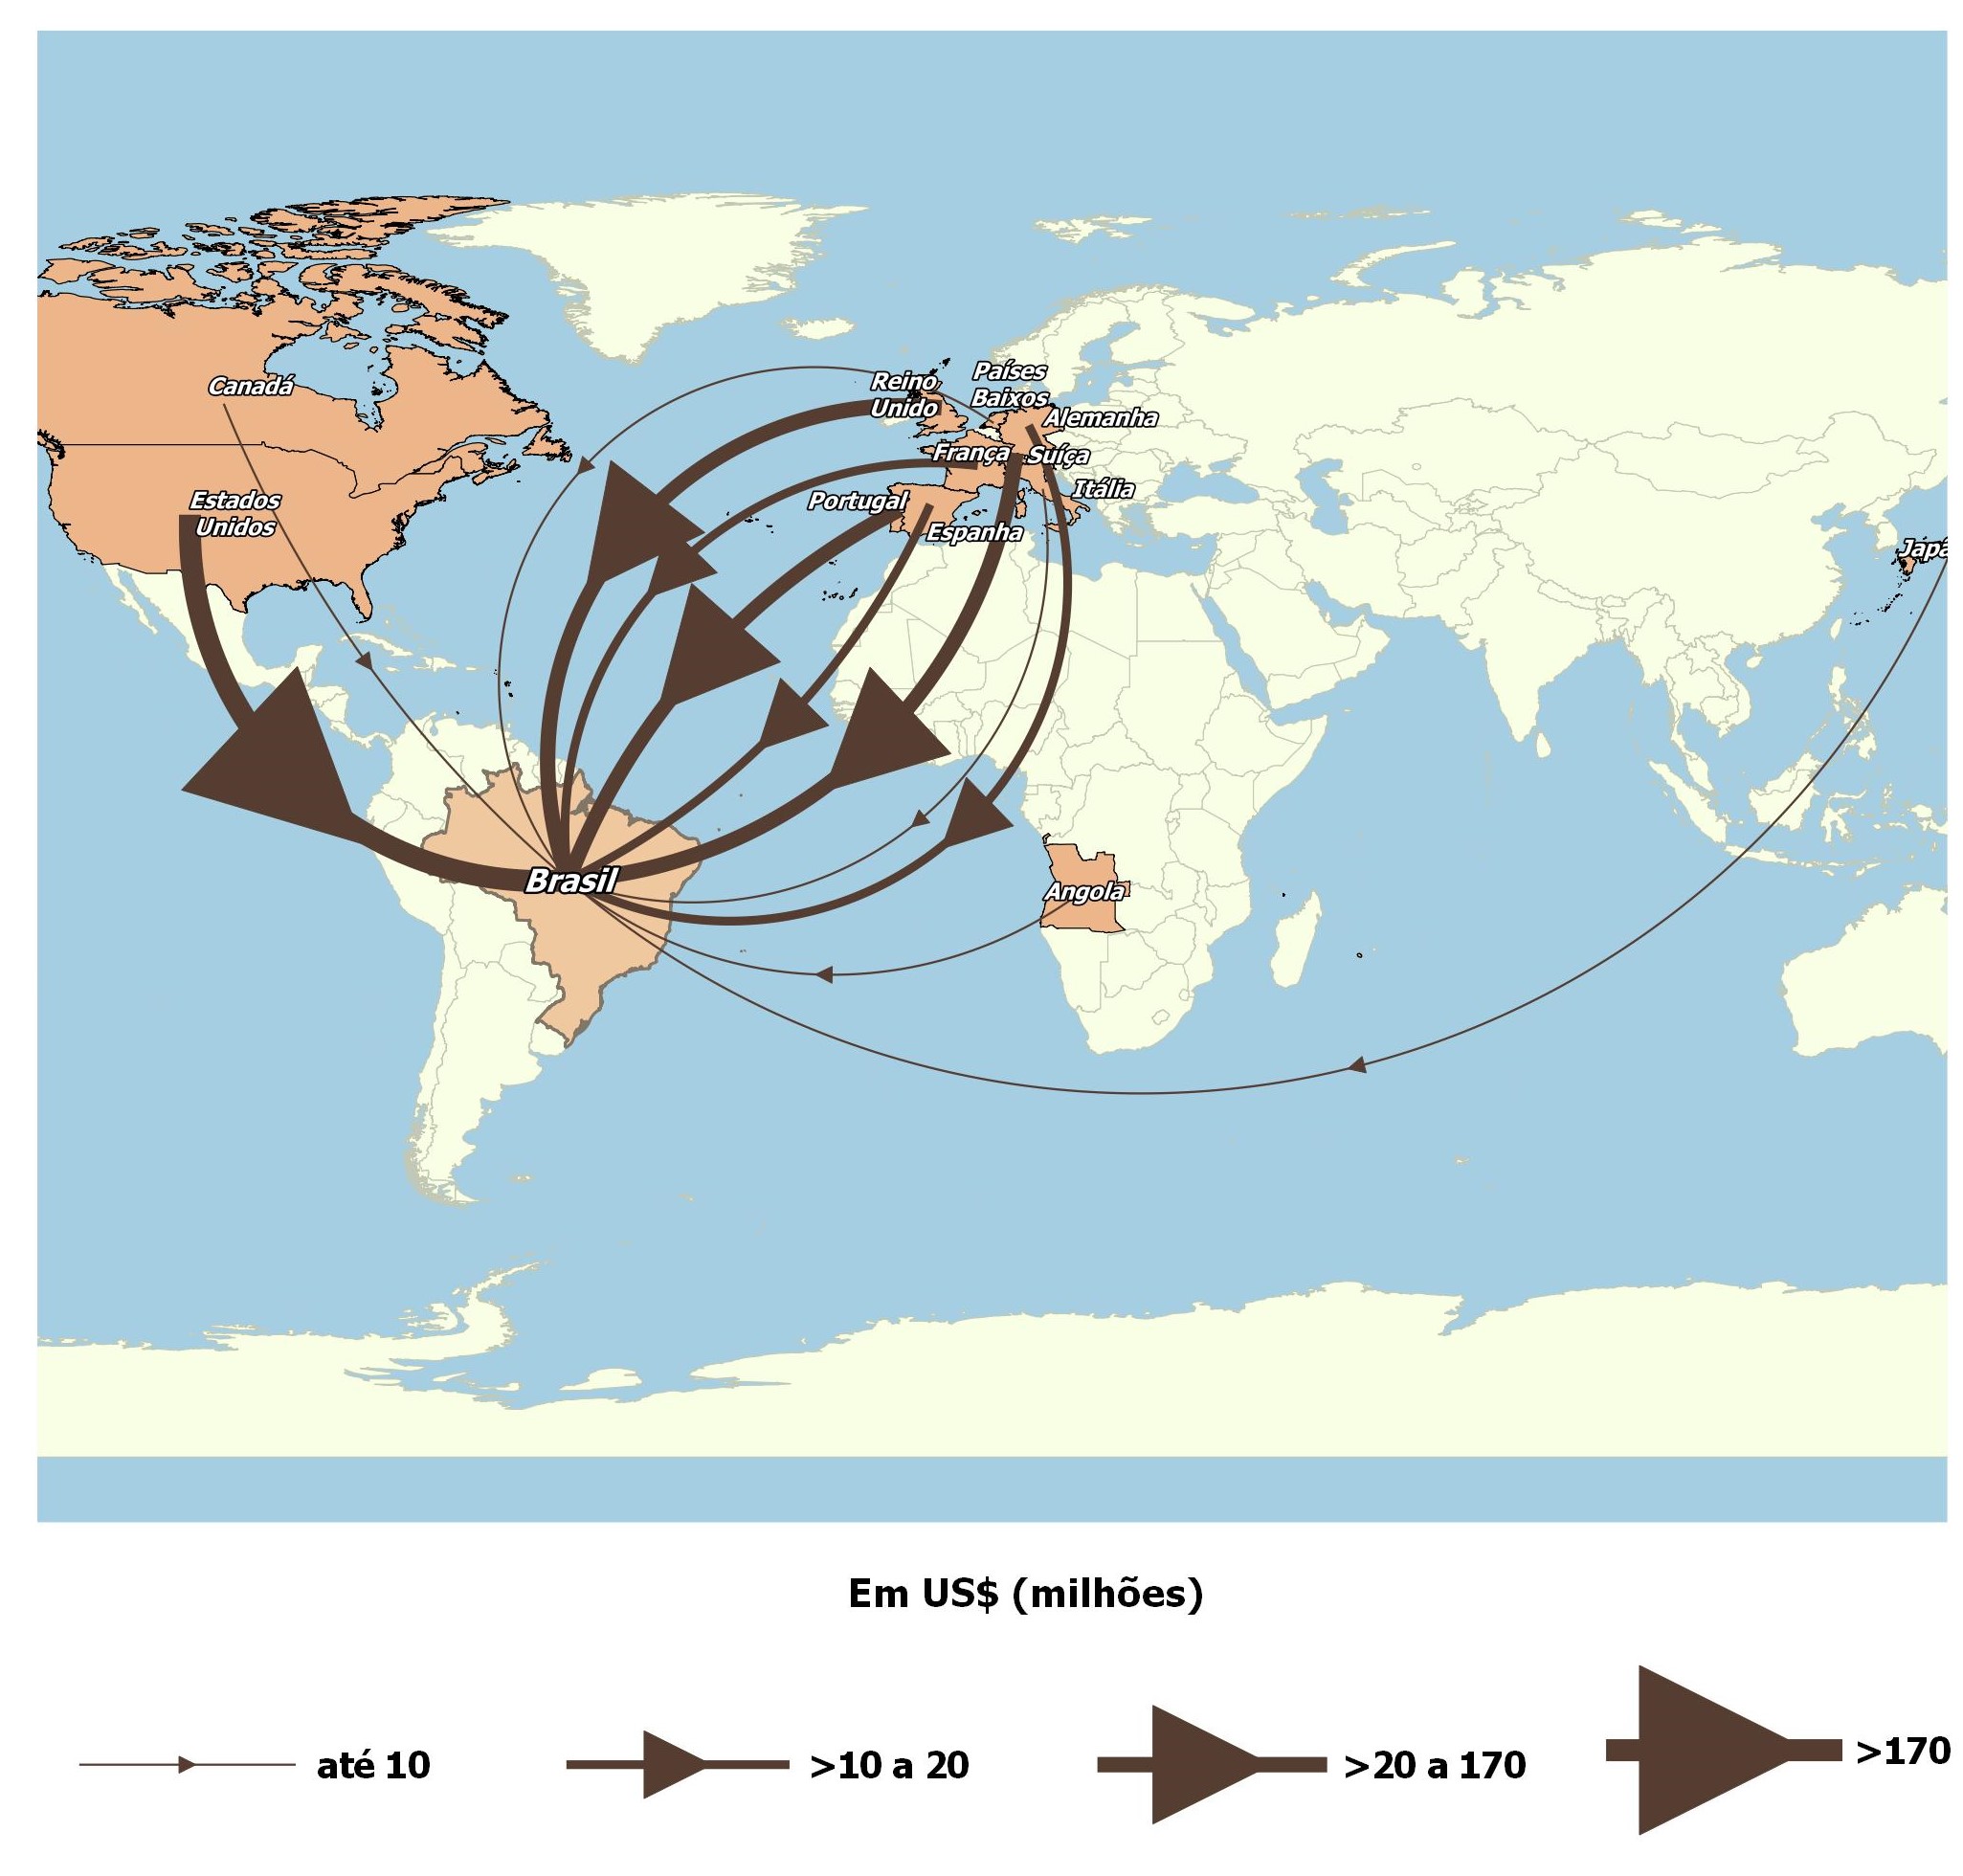
Source: OBMigra (June 2023), based on data from the Central Bank of Brazil, Department of Statistics.
Map 6
Transfers via personal accounts in US$ (millions), by outflows and by main countries - Brazil, June 2023.
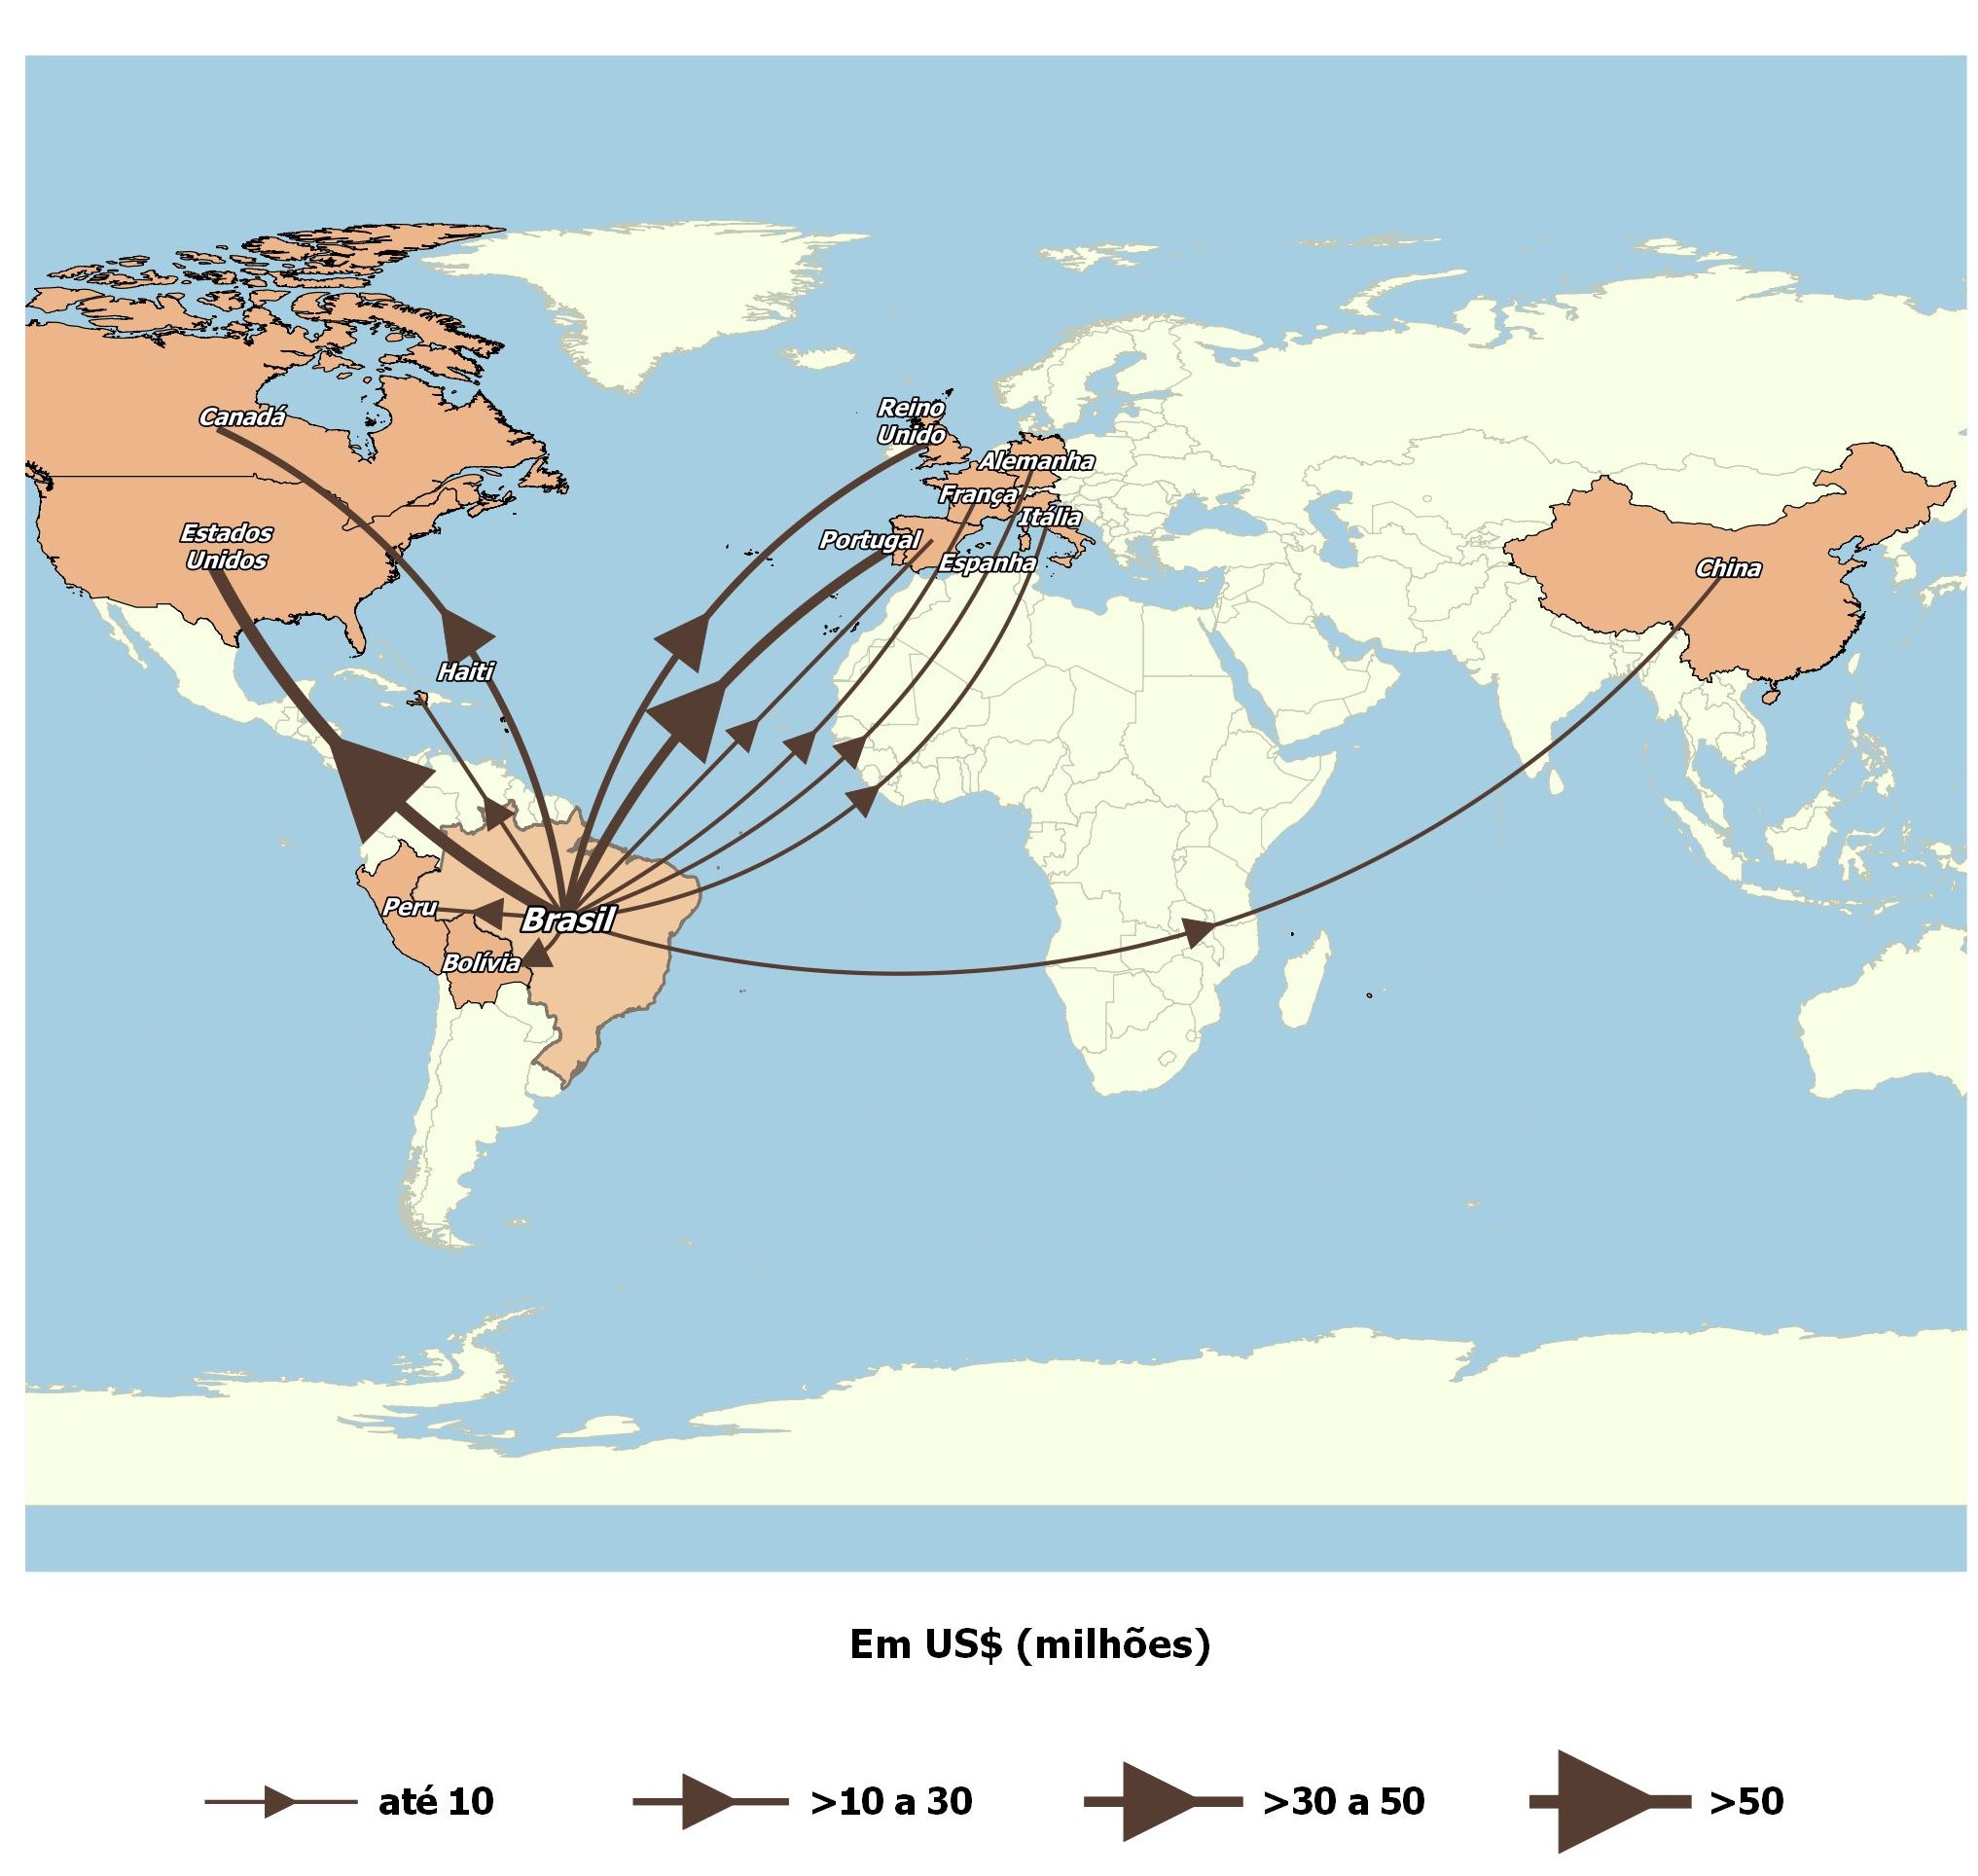
Source: OBMigra (June 2023), based on data from the Central Bank of Brazil, Department of Statistics.
COMO CITAR
The reproduction of this text and the data contained therein is permitted, provided that proper citation of the source is included. Reproduction for commercial use is prohibited.
How to cite this text:
| CAVALCANTI, L; OLIVEIRA, T; FURTADO, A; DICK, P; QUINTINO, F; SILVA, S. Acompanhamento de fluxo e empregabilidade dos imigrantes no Brasil: Relatório Mensal do OBMigra Ano 4, Número 3, março de 2023/ Observatório das Migrações Internacionais; Brasília, DF: OBMigra, 2023. Available at: https://portaldeimigracao.mj.gov.br/pt/dados/relatorios-mensais |

