CGIL
CGIL (General Coordination of Labor Immigration)
The number of work permits for work and investment purposes decreased by 12.9% compared to December, showing a positive year-on-year variation of
21.4%. Since October 2020, the historical series has been progressing toward stability, demonstrating both negative and positive oscillations (Graph 1).
Amidst a decline in the number of permits, Chinese immigrants stood out prominently among the major nationalities, exhibiting a positive trend (Graph 2).
Regarding skilled workers, the situation has remained relatively stable, experiencing a decrease of 9.4% compared to December and an increase of 48.4%
compared to January 2021. As for nationalities, the highlights were Chinese and Spaniards (Graph 3).
GRAPH 1
Number of work permits for labor and investment purposes, by month of registration - Brazil, 2019-2022

Source: OBMigra (2022), based on data from the General Coordination of Labor Immigration (CGIL).
GRAPH 2
Number of permits granted, by month and sex, according to main countries - Brazil, January 2022.

Source: General Coordination of Labor Immigration / Ministry of Justice and Public Security, January 2022.
GRAPH 3
Number of permits granted, by month and sex, according to main countries - Brazil, January 2022.

Source: General Coordination of Labor Immigration / Ministry of Justice and Public Security, January 2022.
CTPS/RAIS/NOVO CAGED
Harmonized database Work and Social Security Card (CTPS)/Annual Report of Social Information (RAIS)/New General Register of Employed and Unemployed Persons (CAGED)
Following two consecutive months of job creation for immigrants in the formal market, December witnessed a reversal with a decline in employment
opportunities within this segment of workers. However, the annual balance was mildly positive in 2021. (Graph 4).
The South Region continued to lead in terms of the concentration of immigrant labor force, followed by the Southeast and Midwest, both of which
surpassed the North (Map 1).
Despite facing an adverse scenario, Florianopolis, Curitiba, Cascavel, and Joinville, among the major cities, generated employment opportunities for
immigrants (Graph 5).
GRAPH 4
Jobs created for immigrants, by month - Brazil, 2019/2021

Source: OBMigra (2021), based on data from the harmonized database RAIS-CTPS-CAGED and the Digital System of Tax, Social Security and Labor
Obligations (eSocial).
GRAPH 5
Job positions created for immigrants in the formal labor market, according to main cities - Brazil, May 2021.

Source: OBMigra (2021), based on data from the Ministry of Economy, Harmonized database RAIS-CTPS-CAGED
MAP 1
Movements of immigrant workers in the formal labor market, by main Regions – Brazil, December 2021
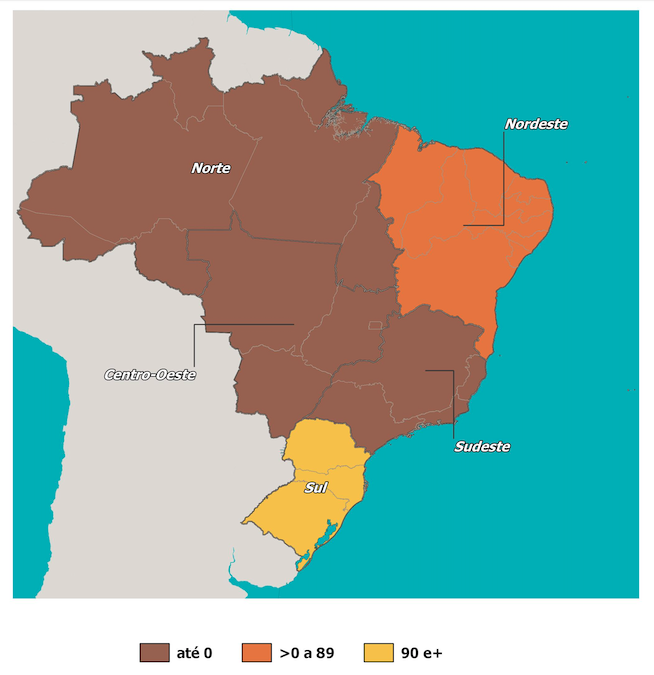
Source: OBMigra (December 2021), based on data from the Ministry of Economy, Harmonized database RAIS-CTPS-CAGED
STI
STI (International Traffic System)
The cross-border movement of people has been experiencing an upward trend since April 2021, although it has not yet reached the levels observed before
the pandemic (Graph 6).
Similar to previous months, the number of Brazilian citizens departing the country has surpassed the number of arrivals. Another important aspect is the
positive balance observed in the movement of residents and temporary immigrants (Graph 7).
GRAPH 6
Cross-border movements, by month of registration, Brazil 2019/2022

Source: OBMigra (2022), based on data from the Brazilian Federal Police, International Traffic System (STI).
GRAPH 7
Cross-border entries and exits from Brazilian territory, by month, according to classification typologies - Brazil, January 2022.
Source: OBMigra (Jan and Dec/2021, and Jan 2022), based on data from the Brazilian Federal Police, International Traffic System (STI).
SISMIGRA
SisMigra (National Migration Registry System)
Residence registrations witnessed a slight decline of 9.2% compared to December but displayed remarkable growth in the year-on-year comparison,
reaching an increase of 174.3%. Moreover, the registrations have consistently remained higher than those observed before the health crisis (Graph 8).
The eligibility ground that regulated the entry of Venezuelans into the country (273) emerged as the most popular, followed by the regularization of the
Mercosur Residency Agreement (209), as depicted in Graph 9.
Not surprisingly, Venezuelans were the main nationality to obtain residence registrations, followed by Haitians, and with meaningful participation of
Colombians, Bolivians, and Argentineans (Map 2).
GRAPH 8
Number of immigrant registrations, by month of registration - Brazil, 2019/2022

Source: OBMigra (2022), based on data from the Brazilian Federal Police, National Migration Registry System (SISMIGRA).
GRAPH 9
Total number of registrations, by month of registration, according to eligibility grounds, Brazil, January 2022.

Source: OBMigra (January 2022), based on data from the Brazilian Federal Police, National Migration Registry System (SISMIGRA).
MAP 2
Number of immigrant registrations, by main countries of birth, January 2022.
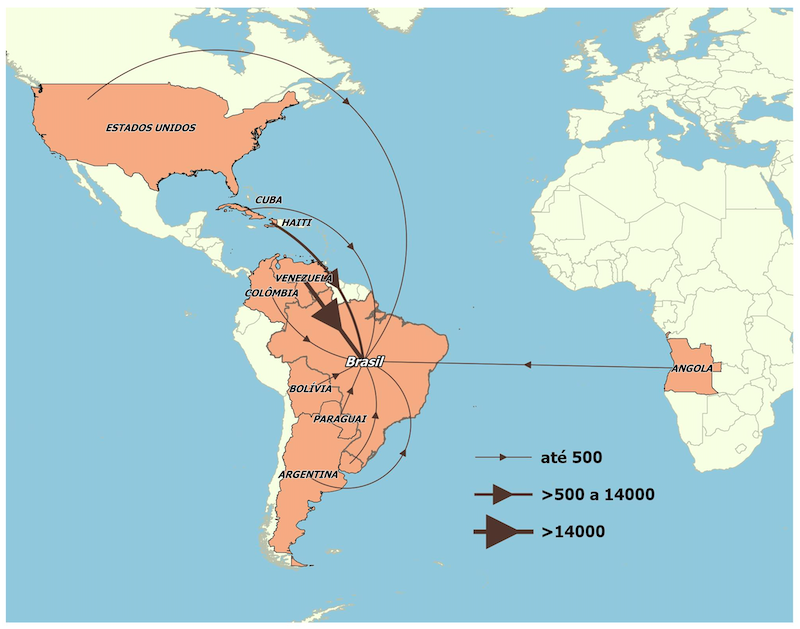
Source: OBMigra (January 2022), based on data from the Brazilian Federal Police, National Migration Registry System (SISMIGRA).
STI-MAR
STI-MAR (International Traffic System - Warning and Restrictions Module)
The number of requests for recognition of refugee status in January exhibited a robust positive variation both over the year (547.8%) and compared to the
previous month (17.5%). The historical series indicates that the recovery, which commenced in July 2021, maintains an upward trend (Graph 10).
Venezuelans remain the main nationality seeking asylum in Brazil (Map 3).
One notable aspect that has consistently stood out among asylum seekers is the growing participation of children and adolescents. This fact requires
attention from migration policy managers in terms of directing resources to ensure assistance to this population segment (Graph 11).
GRAPH 10
Number of applications for recognition of refugee status, by month of registration - Brazil, 2019-2022
Source: OBMigra (2022), based on data from the International Traffic System - Warning and Restrictions Module.
GRAPH 11
Number of applications for recognition of refugee status, by age groups, December 2022.
Source: OBMigra (January 2022), based on data from the Brazilian Federal Police, International Traffic System - Warning and Restrictions Module (STI-MAR).
MAP 3
Number of asylum claims, by main countries of nationality, January 2022.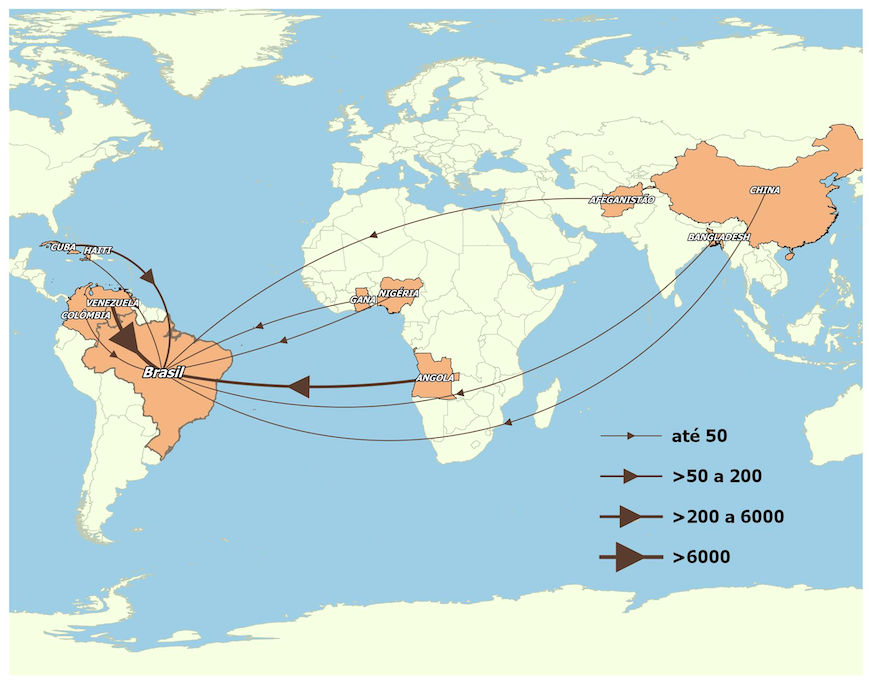
Source: OBMigra (January 2022), based on data from the Brazilian Federal Police, Asylum Claims
COMO CITAR
The reproduction of this text and the data contained therein is permitted, provided that proper citation of the source is included. Reproduction for
commercial use is prohibited.
How to cite this text:
CAVALCANTI, L; OLIVEIRA, T; FURTADO, A; DICK, P; QUINTINO, F; GUIMARÃES, B. Acompanhamento de fluxo e empregabilidade dos imigrantes no Brasil:
Relatório Mensal do OBMigra Ano 3, Número 1, janeiro de 2022/ Observatório das Migrações Internacionais; Brasília, DF: OBMigra, 2022. Available at:
https://portaldeimigracao.mj.gov.br/pt/dados/relatorios-mensais