YEAR 2 l NUMBER 2 l JANUARY 2021
YEAR 2 | NUMBER 2 | FEBRUARY 2021
|
Execution: OBMigra - International Migration Observatory Coordination: Technical Team: Translation (English) - Júlia Lima |
Support: MJSP – Ministry of Justice and Public Security PF – Brazilian Federal Police CONARE – National Committee for Refugees CGIL – General Coordination of Labor Immigration (DEMIG/SENAJUS/MJSP) ME – Ministry of Economy IBGE – Brazilian Institute of Geography and Statistics |
CGIL (General Coordination of Labor Immigration)
February showed a positive variation compared to January, with the number of granted residence permits for work and investment purposes increasing 18.0%, but still below the level observed 12 months ago (Graph 1).
Filipino and Chinese workers, in particular, have contributed to the growth in the number of granted permits (Graph 2).
Among skilled workers, the most notable group includes those in the occupational groups of directors and managers, as well as professionals in the sciences and arts (Graph 3).
GRAPH 1
Number of work permits granted for labor and investment purposes, by month of registration - Brazil, 2019-2021
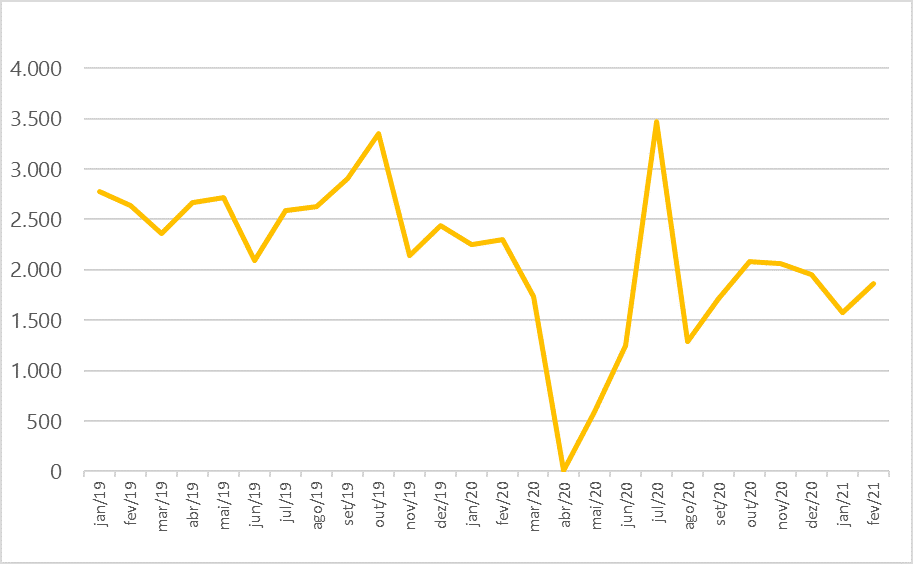
Source: OBMigra (2021), based on data from the General Coordination of Labor Immigration - CGIL.
GRAPH 2
Number of permits granted, by main countries of birth - Brazil, February/21
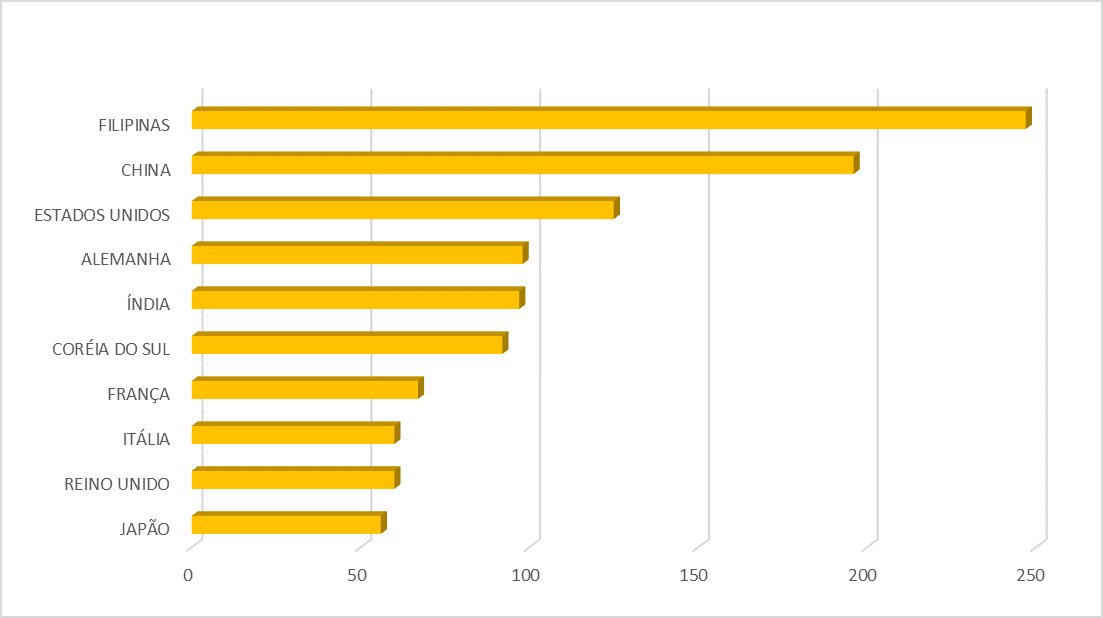
Source: OBMigra (2021), based on data from the General Coordination of Labor Immigration - CGIL.
GRAPH 3
Number of permits granted to skilled workers, by occupational groups, Brazil, February/2021
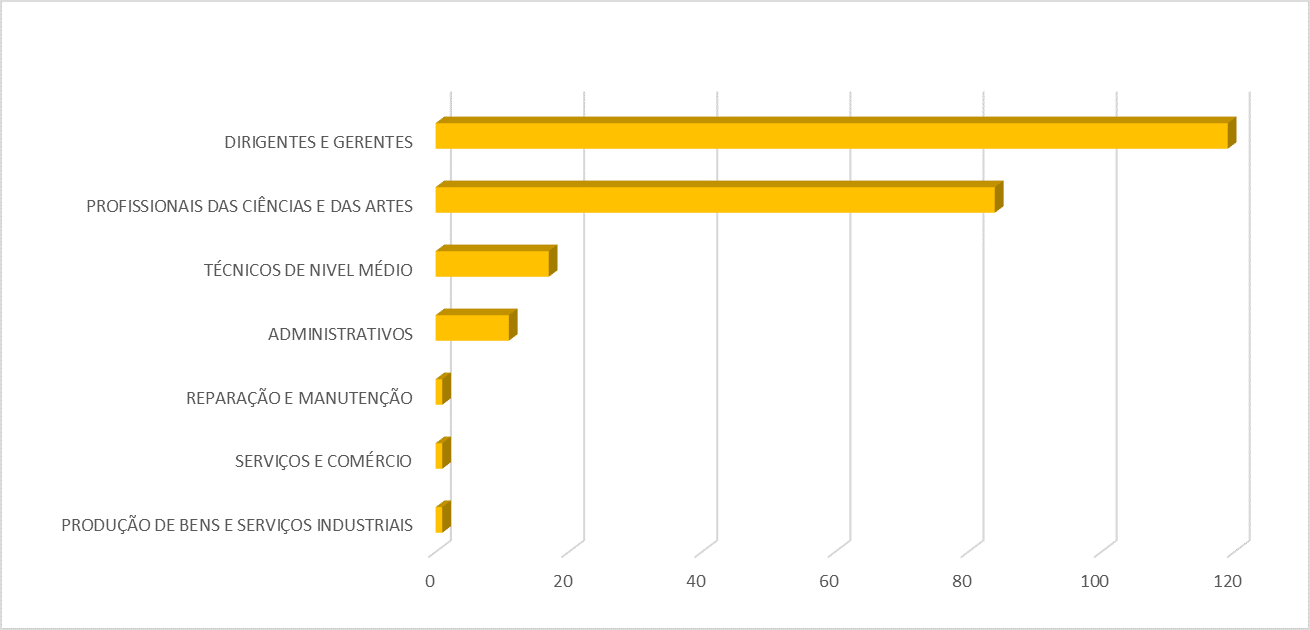
Source: OBMigra (2021), based on data from the General Coordination of Labor Immigration - CGIL.
Harmonized database Work and Social Security Card (CTPS)/Annual Report of Social Information (RAIS)/New General Register of Employed and Unemployed Persons (CAGED)
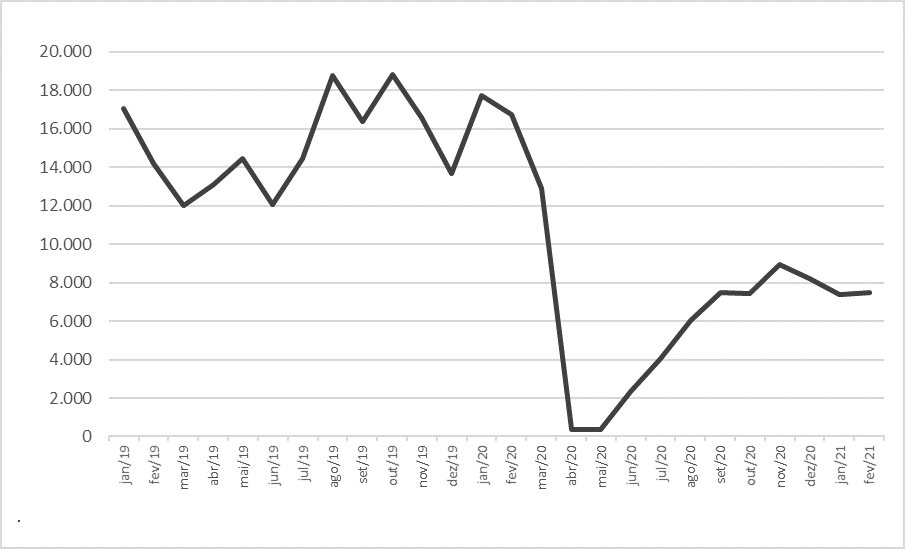
The movements of immigrant workers in the formal market in January showed a recovery when compared with the previous month (15.5%) and 12 months ago (5.1%). Overall, 2,369 new jobs for immigrant workers were created (Graph 4).
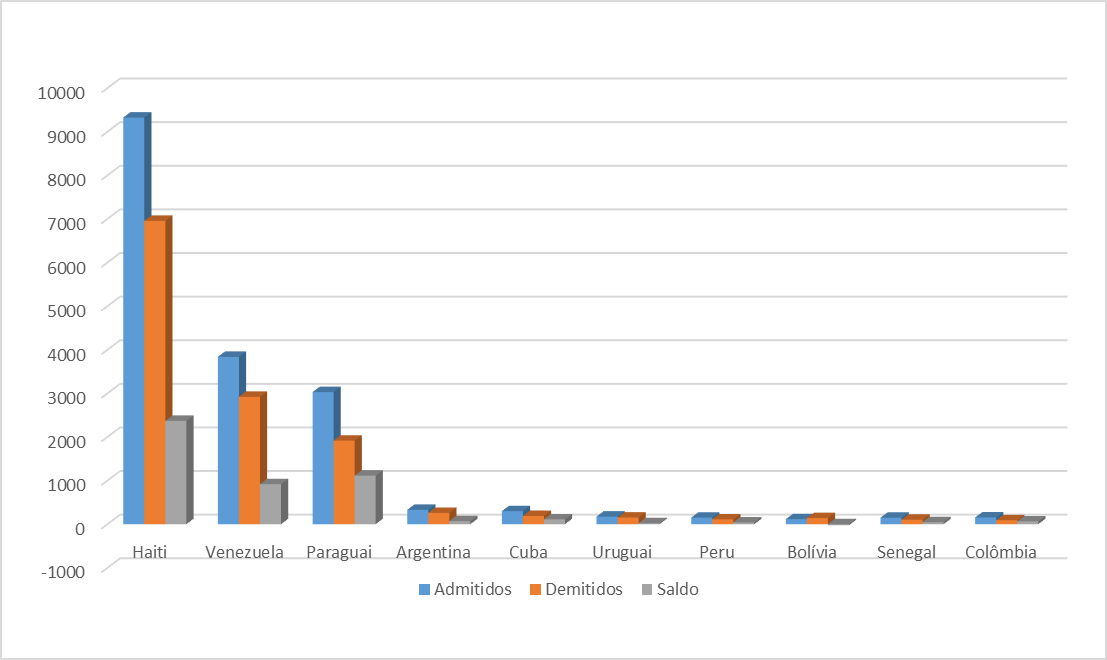
Haitians and Venezuelans continued to be the nationalities with the largest presence in the formal labor market. It is worth noting the participation of the Paraguayan labor force (Graph 5).
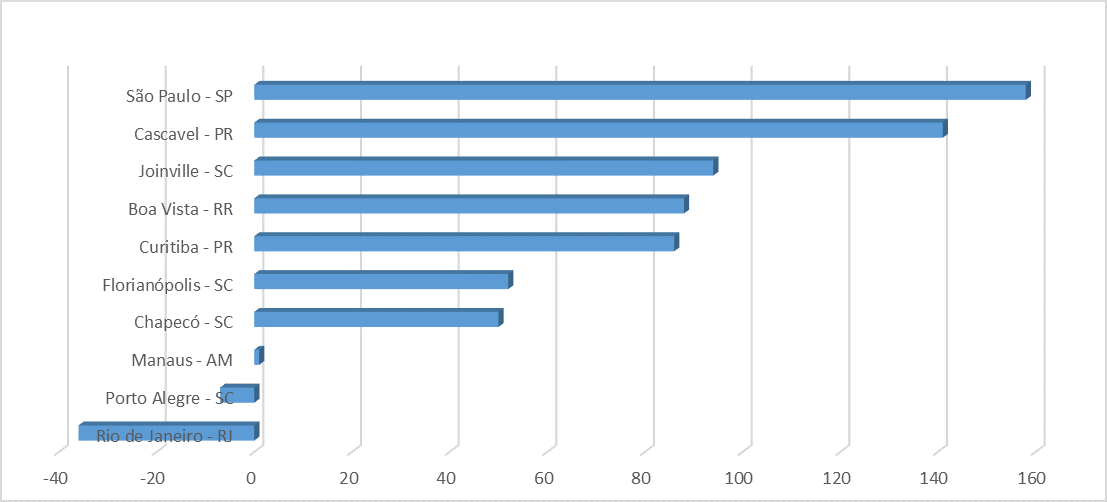
Among the main cities in terms of immigrant workers in the formal market, São Paulo/SP and Cascavel/PR stand out in terms of job creation (Graphic 6).
GRAPH 4
Jobs created for immigrants, by month - Brazil, 2019/2020
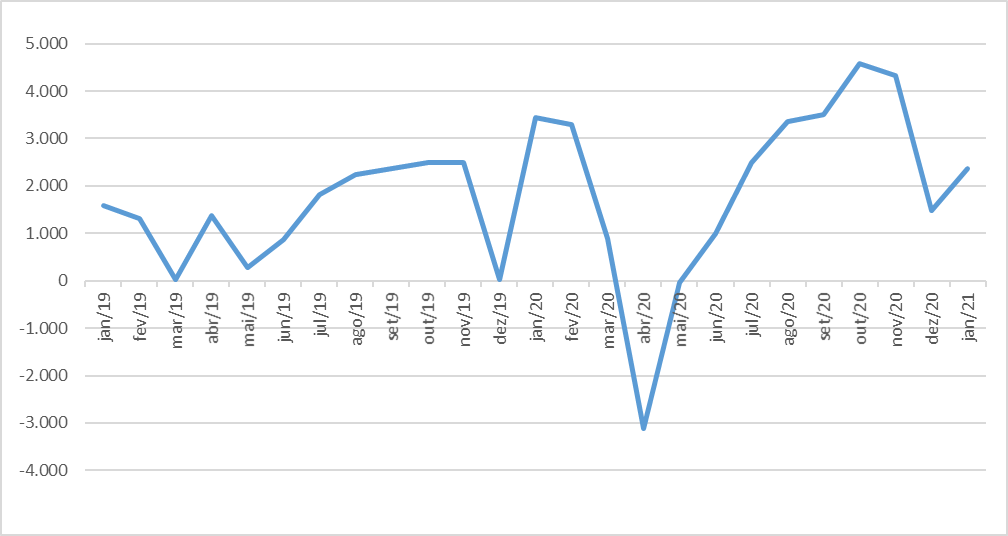
Source: OBMigra (2020), based on data from the harmonized database RAIS-CTPS-CAGED and the Digital System of Tax, Social Security and Labor Obligations (eSocial).
GRAPH 5
Movements of migrant workers in the formal labor market, by main countries - Brazil, January 2021
Source: OBMigra (2020), based on data from the harmonized database RAIS-CTPS-CAGED and the Digital System of Tax, Social Security, and Labor Obligations (eSocial).
GRAPH 6
Movements of migrant workers in the formal labor market, by major cities, January 2021
Source: OBMigra (2020), based on data from the harmonized database RAIS-CTPS-CAGED and the Digital System of Tax, Social Security, and Labor Obligations (eSocial).
SisMigra (National Migration Registry System)
The effects of the health crisis continued to be felt in the regularization of immigrant residents during February. This month's numbers remained stable compared to the previous month and were significantly lower than those recorded a year ago (Graph 7).
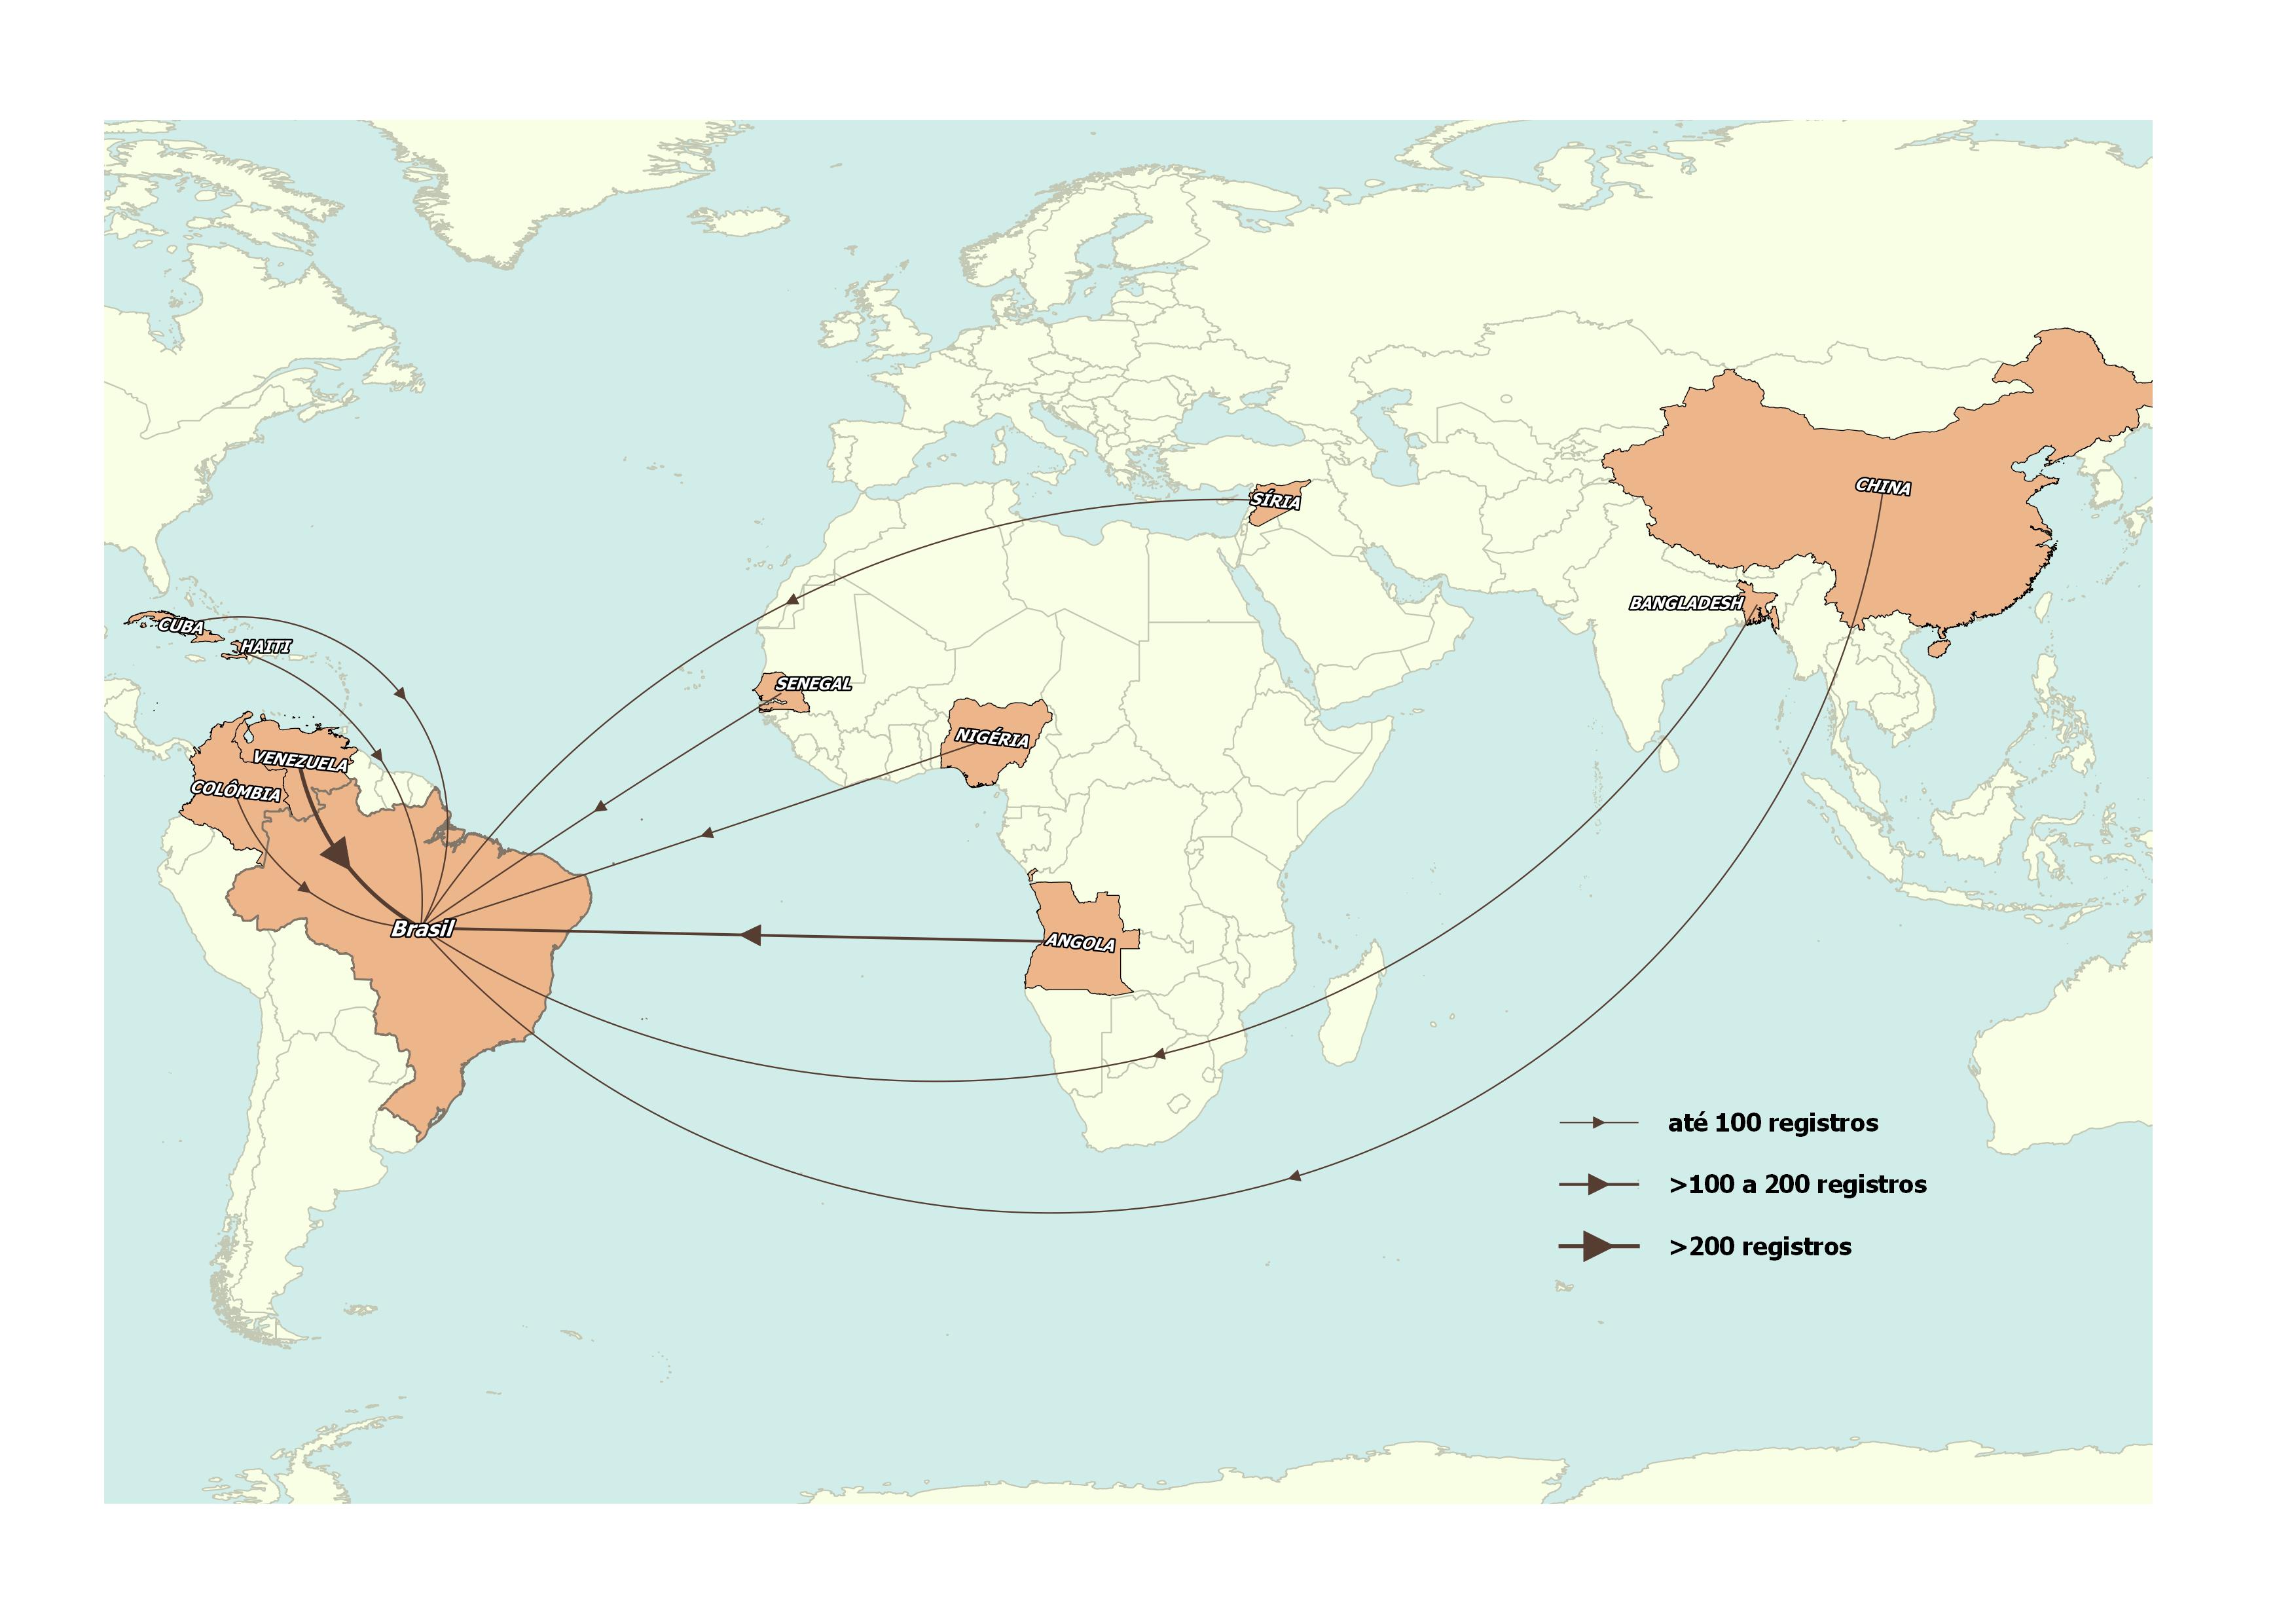
Map 1 shows the main countries of birth, reinforcing the Venezuelan and Haitian nationalities as the ones that have been granted the most residence permits.
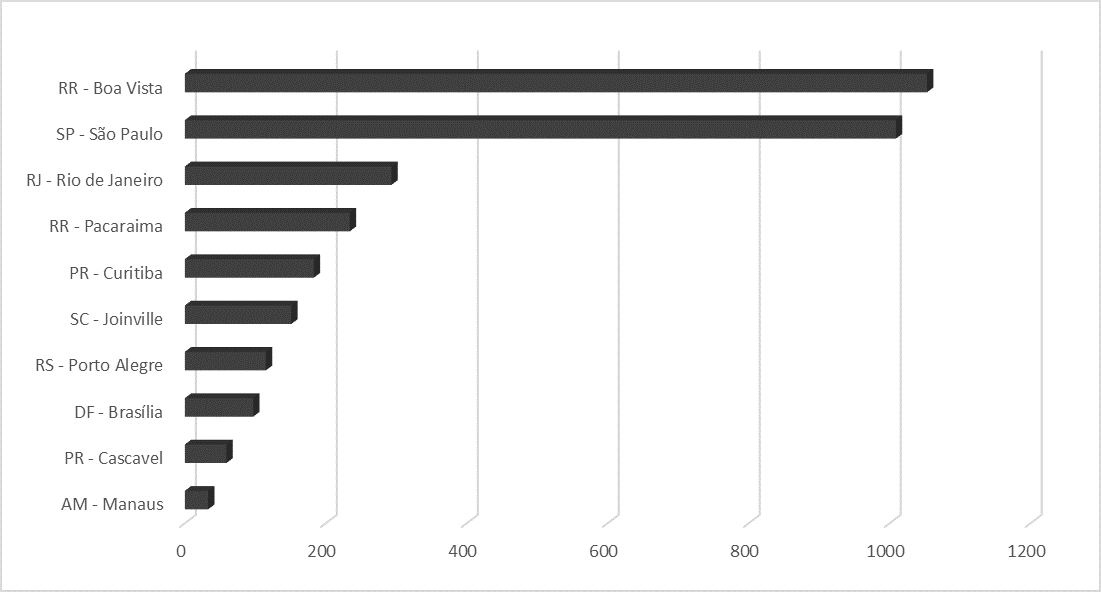
The cities that received the most residence registrations in February were Boa Vista/RR and São Paulo (Graphic 8).
GRAPH 7
Number of immigrant registrations, by month of registration - Brazil, 2019-2021
Source: OBMigra (2021), based on data from the Brazilian Federal Police, National Migration Registry System (SISMIGRA).
GRAPH 8
Number of migrant registrations, by main municipalities, February 2021
Source: OBMigra (2021), based on data from the Brazilian Federal Police, National Migration Registry System (SISMIGRA).
MAP 1
Number of immigrant registrations, by main countries of birth, February 2021
Source: OBMigra (2021), based on data from the Brazilian Federal Police, National Migration Registry System (SISMIGRA).
STI (International Traffic System)
After a slight upturn, but at still low levels, in August 2020, February recorded the lowest cross-border movement activity - just over 260,000 movements in and out of the territory (Graph 9).
Restrictions due to the health emergency strongly impacted the physical mobility of individuals. In Graph 10, it is possible to observe the small movement figures across various classification typologies in which Brazilians stand out. The low mobility of resident and temporary immigrants was another aspect that stood out.
GRAPH 9
Cross-border movements, by month of registration, Brazil 2019/2021
Source: OBMigra (2021), based on data from the Brazilian Federal Police, STI.
GRAPH 10
Cross-border entries and exits from Brazilian territory, according to classification typologies - Brazil, February 2021
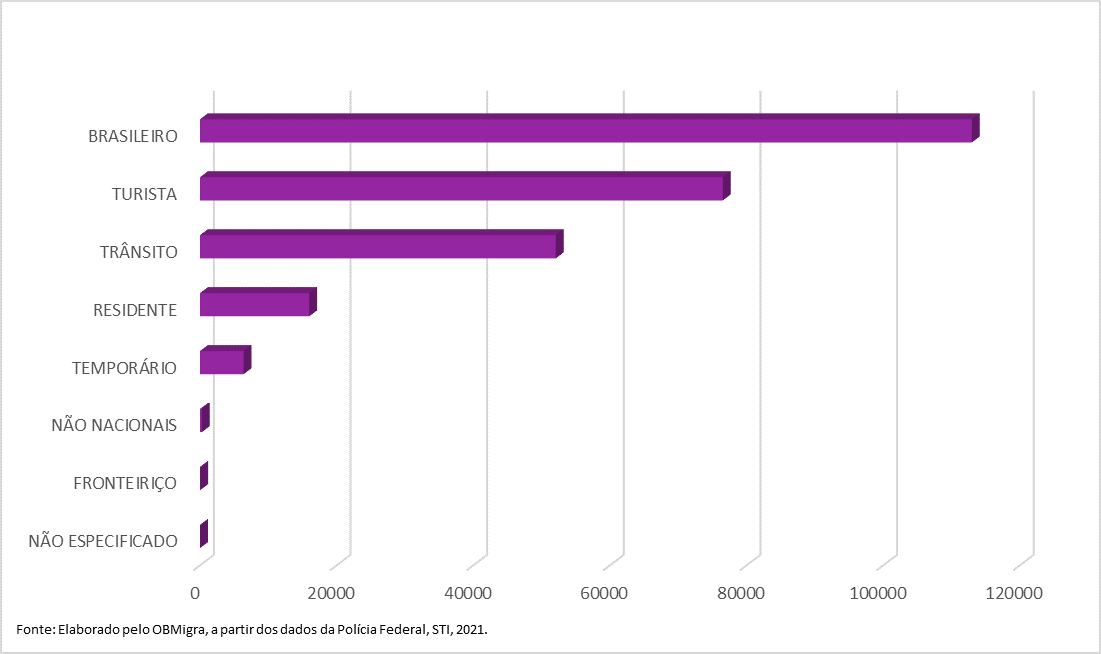
Source: OBMigra (2021), based on data from the Brazilian Federal Police, STI.
STI-MAR (International Traffic System - Warning and Restrictions Module)
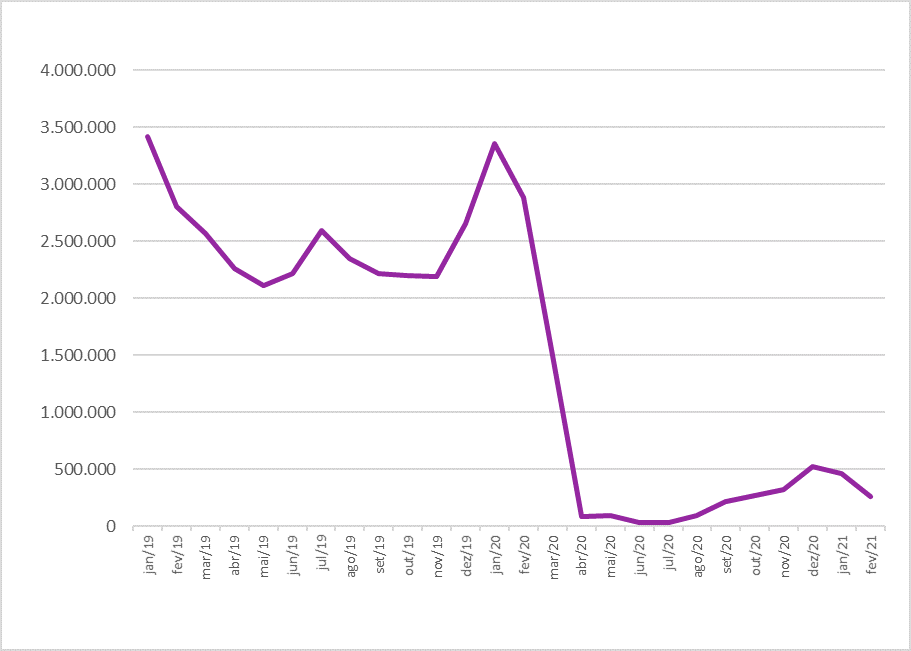
The number of applications for recognition of refugee status in the month of February was not lower than the figures recorded during the two most challenging months of the SARS-COV-2 crisis, namely April and May 2020, according to Graph 11 This result indicates the dimension of the impacts of the pandemic on this type of administrative classification.
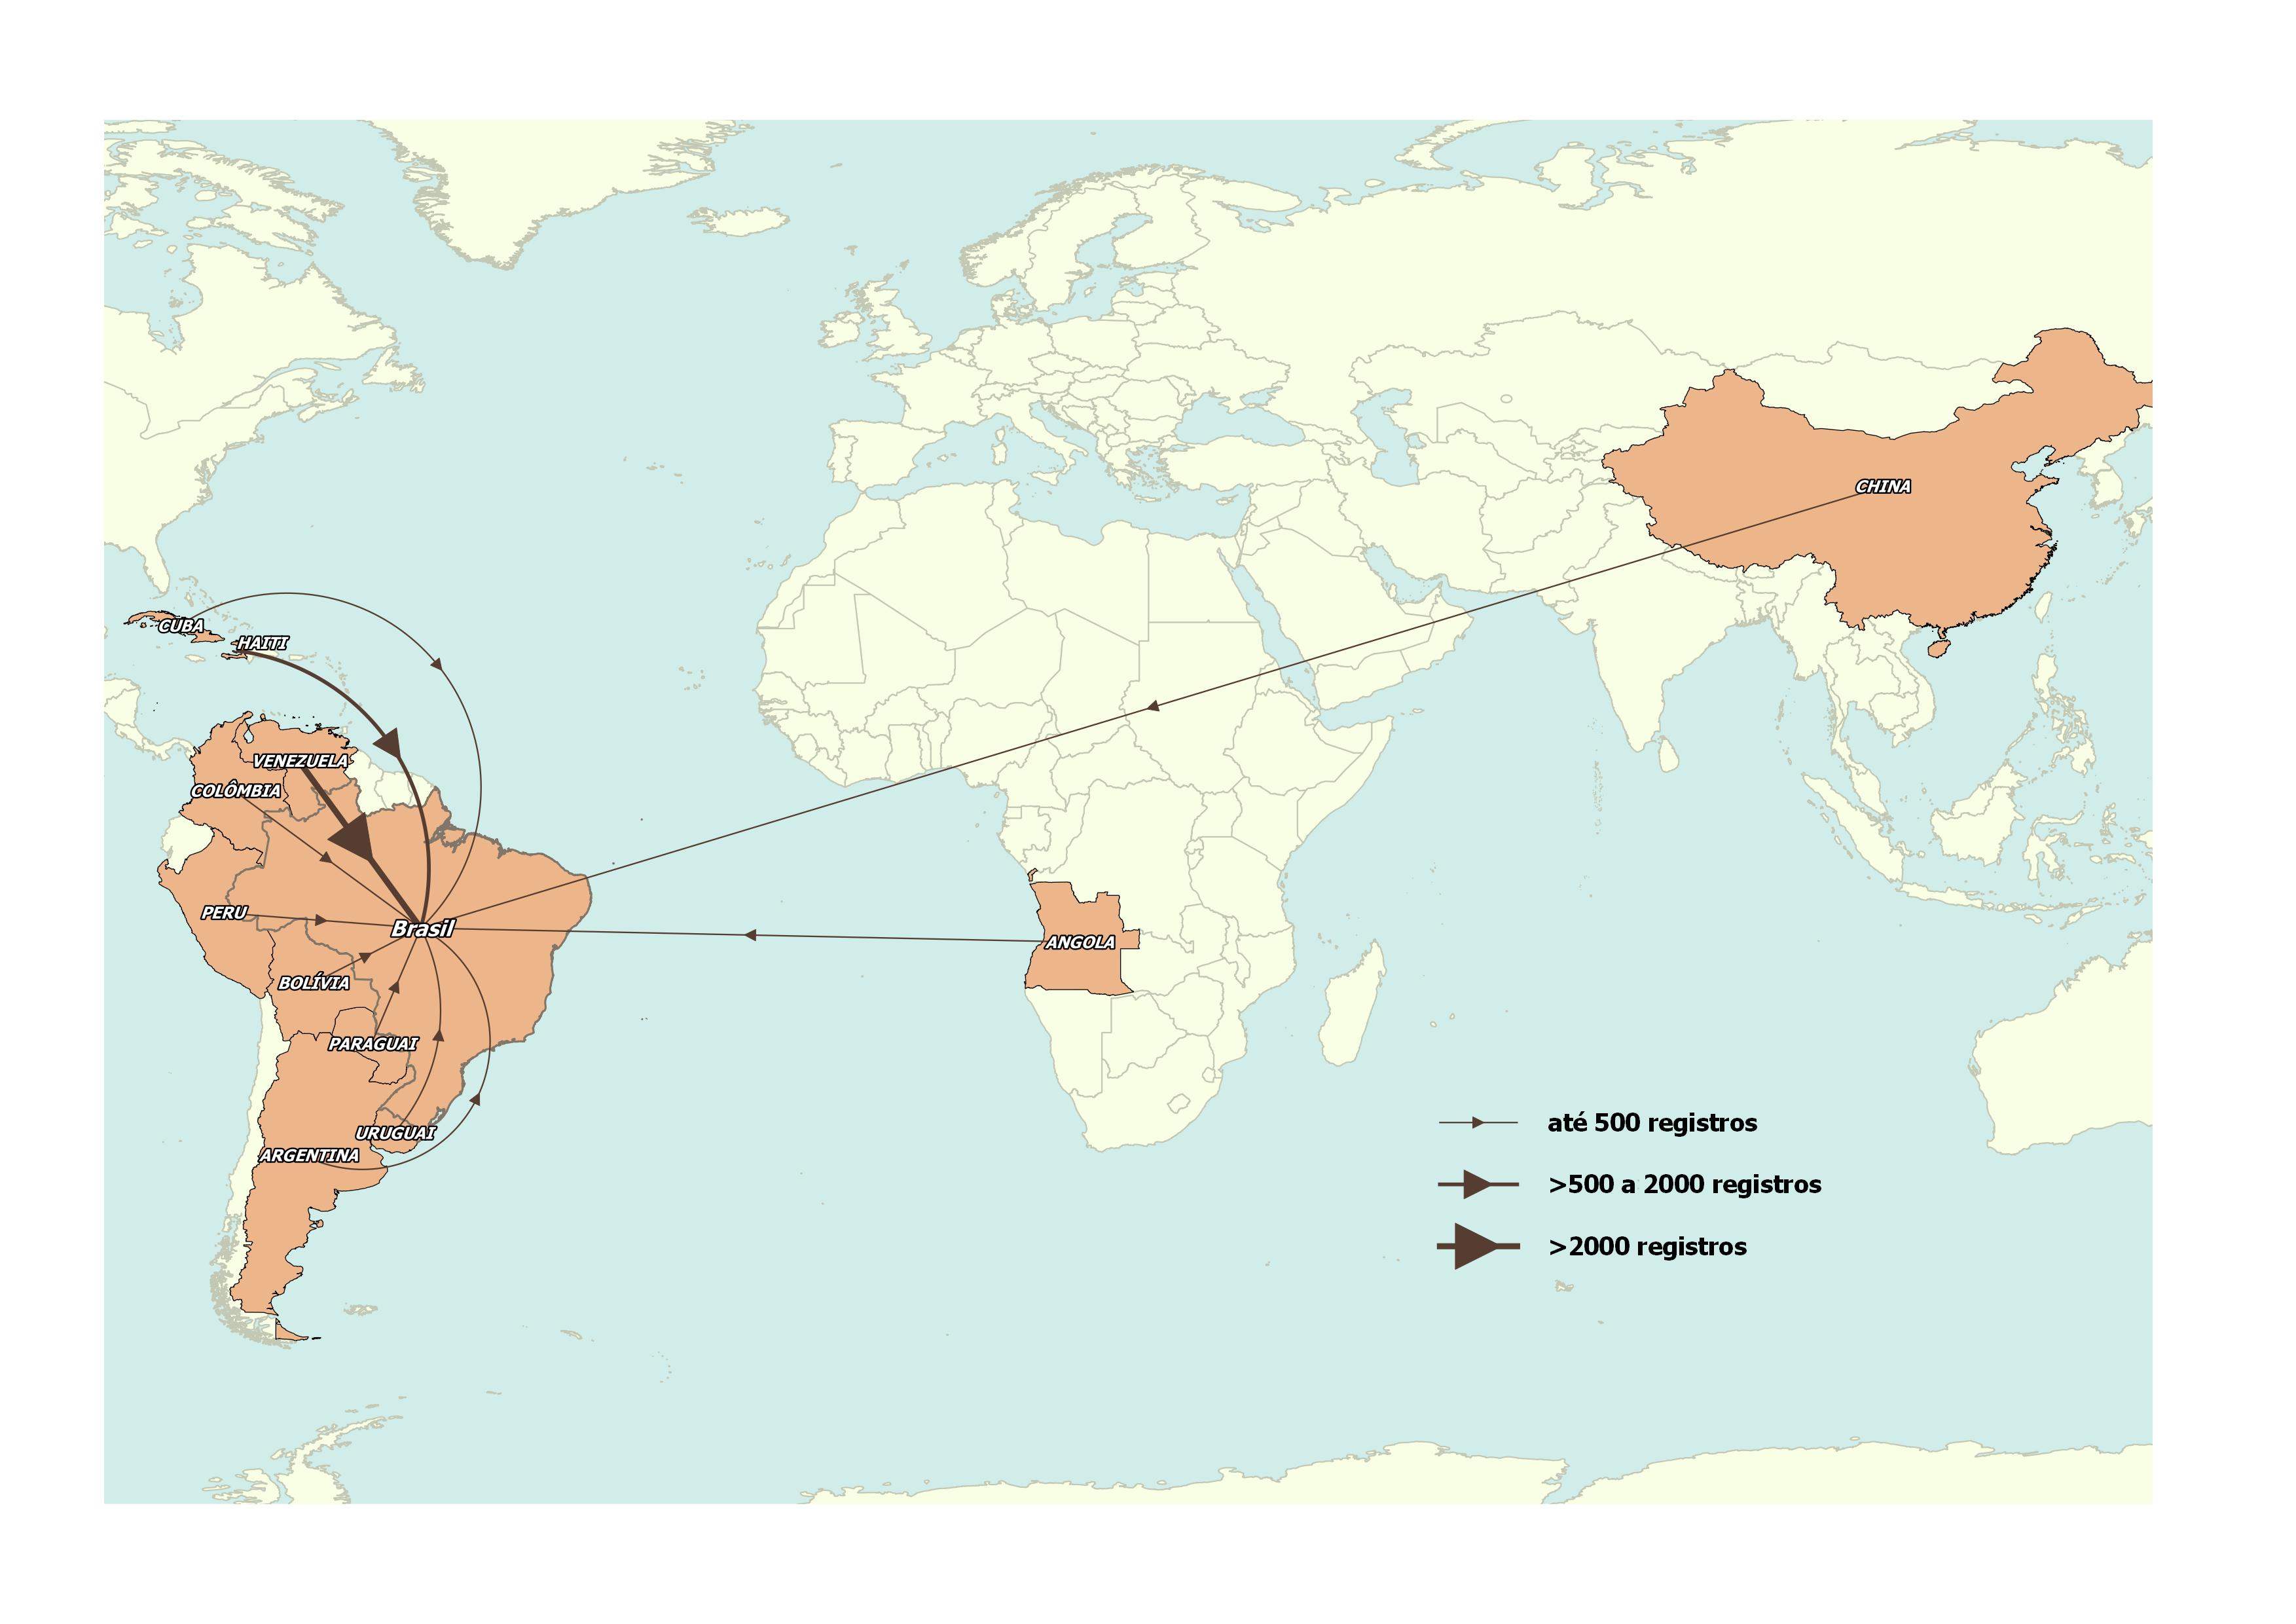
Venezuelans and Haitians remained the main nationalities among asylum seekers (Map 2).
Pacaraima/RR and Guarulhos/SP stood out as the cities that registered the highest number of asylum applications in February (Graph 12).
GRAPH 11
Number of asylum claims, by month of registration - Brazil, 2019-2021

Source: OBMigra (2021), based on data from the Brazilian Federal Police, International Traffic System - Warning and Restrictions Module (STI-MAR).
GRAPH 12
Number of asylum claims, according to main municipalities - Brazil, February 2021
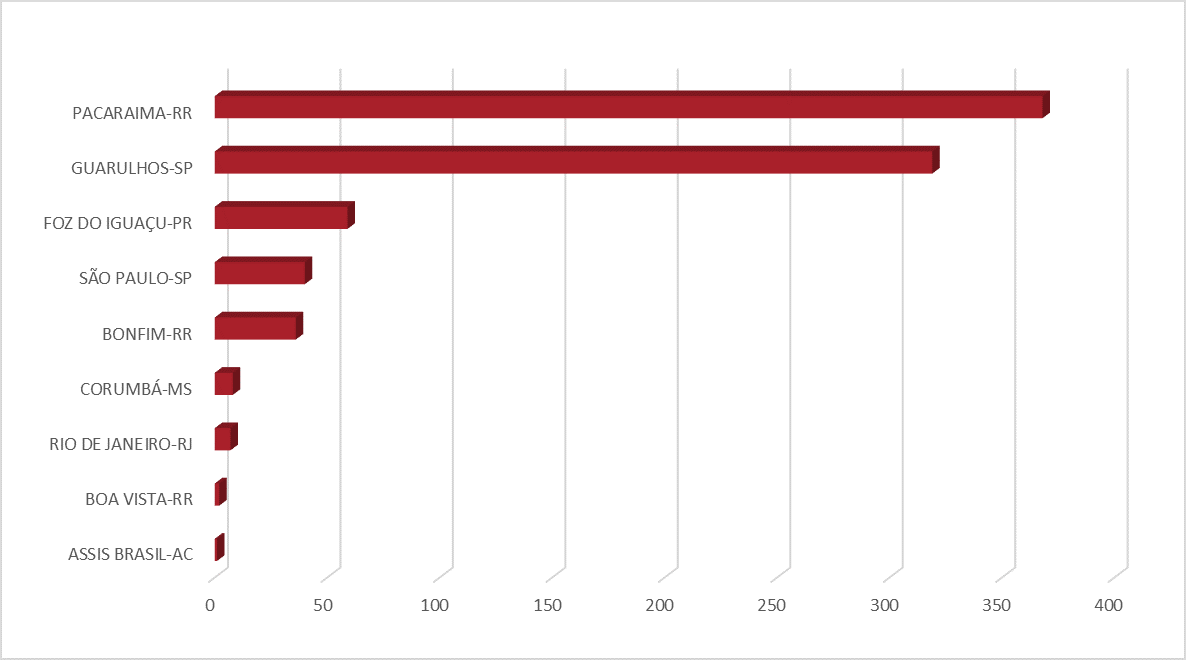
Source: OBMigra (2021), based on data from the Brazilian Federal Police, International Traffic System - Warning and Restrictions Module (STI-MAR).
MAP 2
Number of asylum claims, by main countries of nationality, January 2021
Source: OBMigra (2021), based on data from the Brazilian Federal Police, International Traffic System - Warning and Restrictions Module (STI-MAR).
The reproduction of this text and the data contained therein is permitted, provided that proper citation of the source is included. Reproduction for commercial use is prohibited.
How to cite this text:
|
CAVALCANTI, L; OLIVEIRA, T; FURTADO, A; DICK, P; QUINTINO, F; MACEDO, M Acompanhamento de fluxo e empregabilidade dos imigrantes no Brasil: Relatório Mensal do OBMigra Ano 2, Número 2, fevereiro de 2021/ Observatório das Migrações Internacionais; Brasília, DF: OBMigra, 2021. Available at: https://portaldeimigracao.mj.gov.br/pt/dados/relatorios-mensais |