CGIL
CGIL (General Coordination of Labor Immigration)
The number of residence permits for work and investment purposes experienced a decrease in both comparisons with May (-14.4%) and June 2021 (-15.8%). Graph 1 indicates the oscillations observed since 2020, but with a downward trend starting in December 2021.
In a scenario of reduced volume of granting, what stands out is the positive performance of Filipinos and Chinese, most likely engaged in maritime activities (Graph 2).
Among skilled workers, those in the science and arts occupational group registered a positive variation in comparison with May (Graph 3).
GRAPH 1
Number of work permits for labor and investment purposes, by month of registration - Brazil, 2019-2022
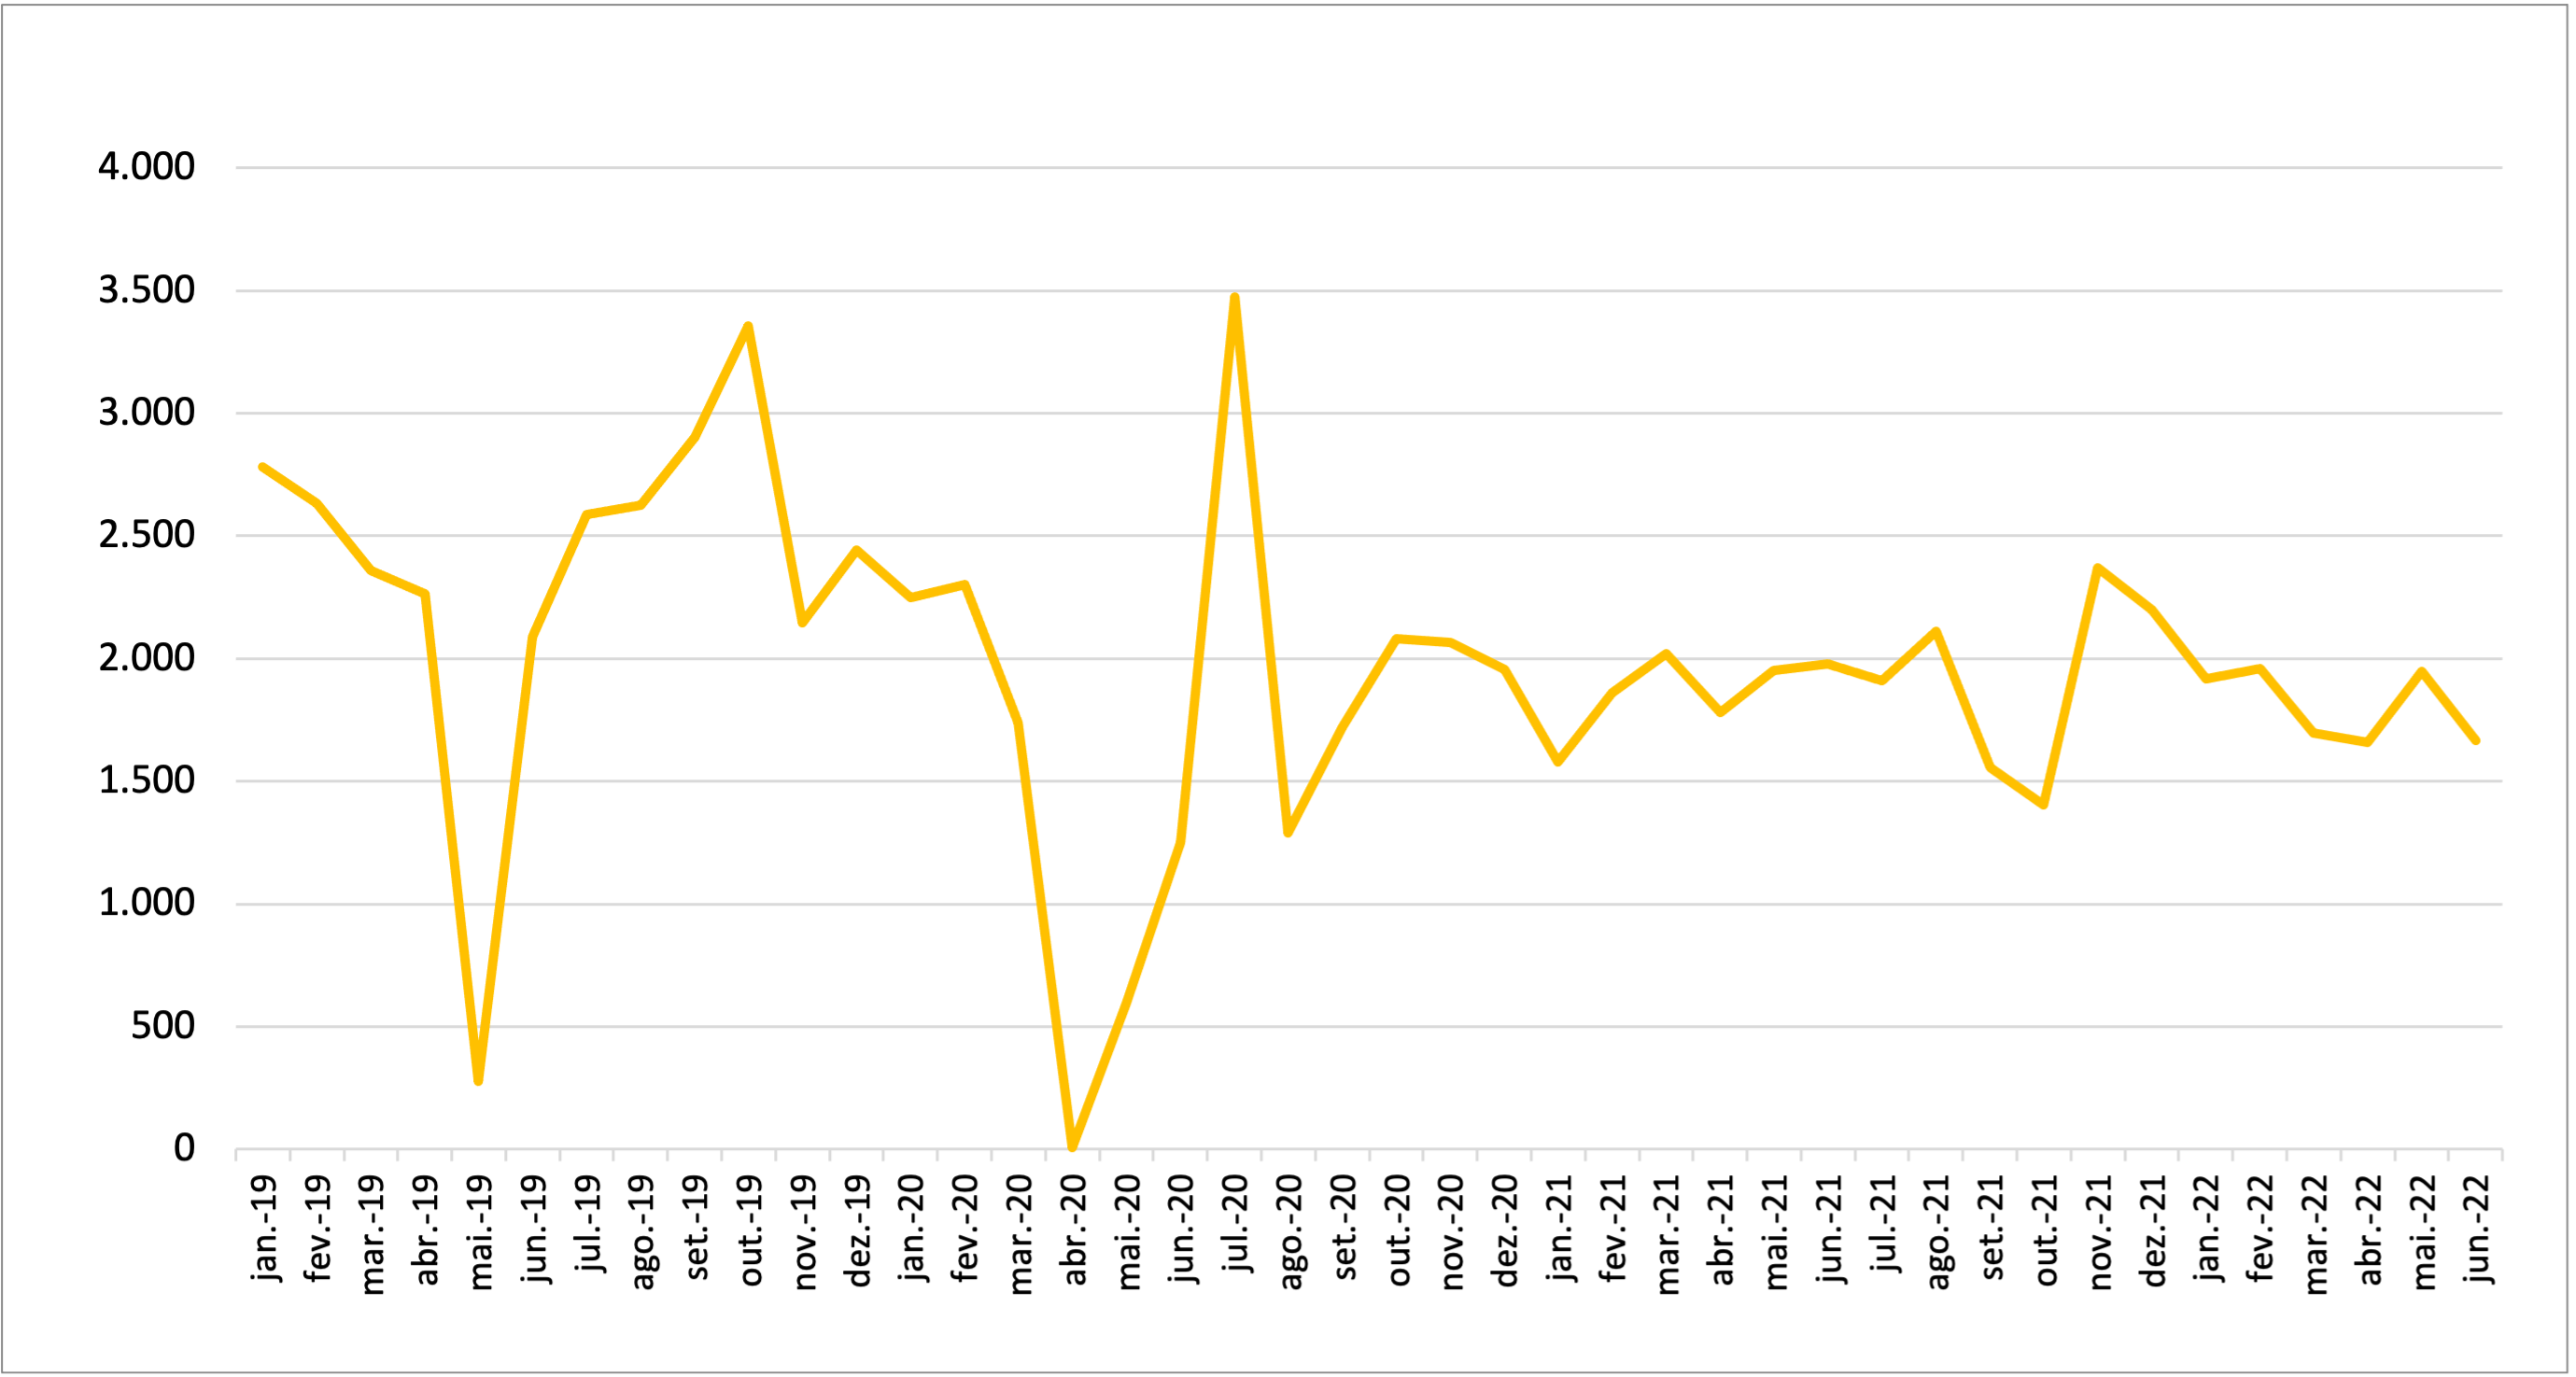
Source: OBMigra (2022), based on data from the General Coordination of Labor Immigration (CGIL).
GRAPH 2
Number of permits granted, by month, according to main countries - Brazil, May and June 2022.
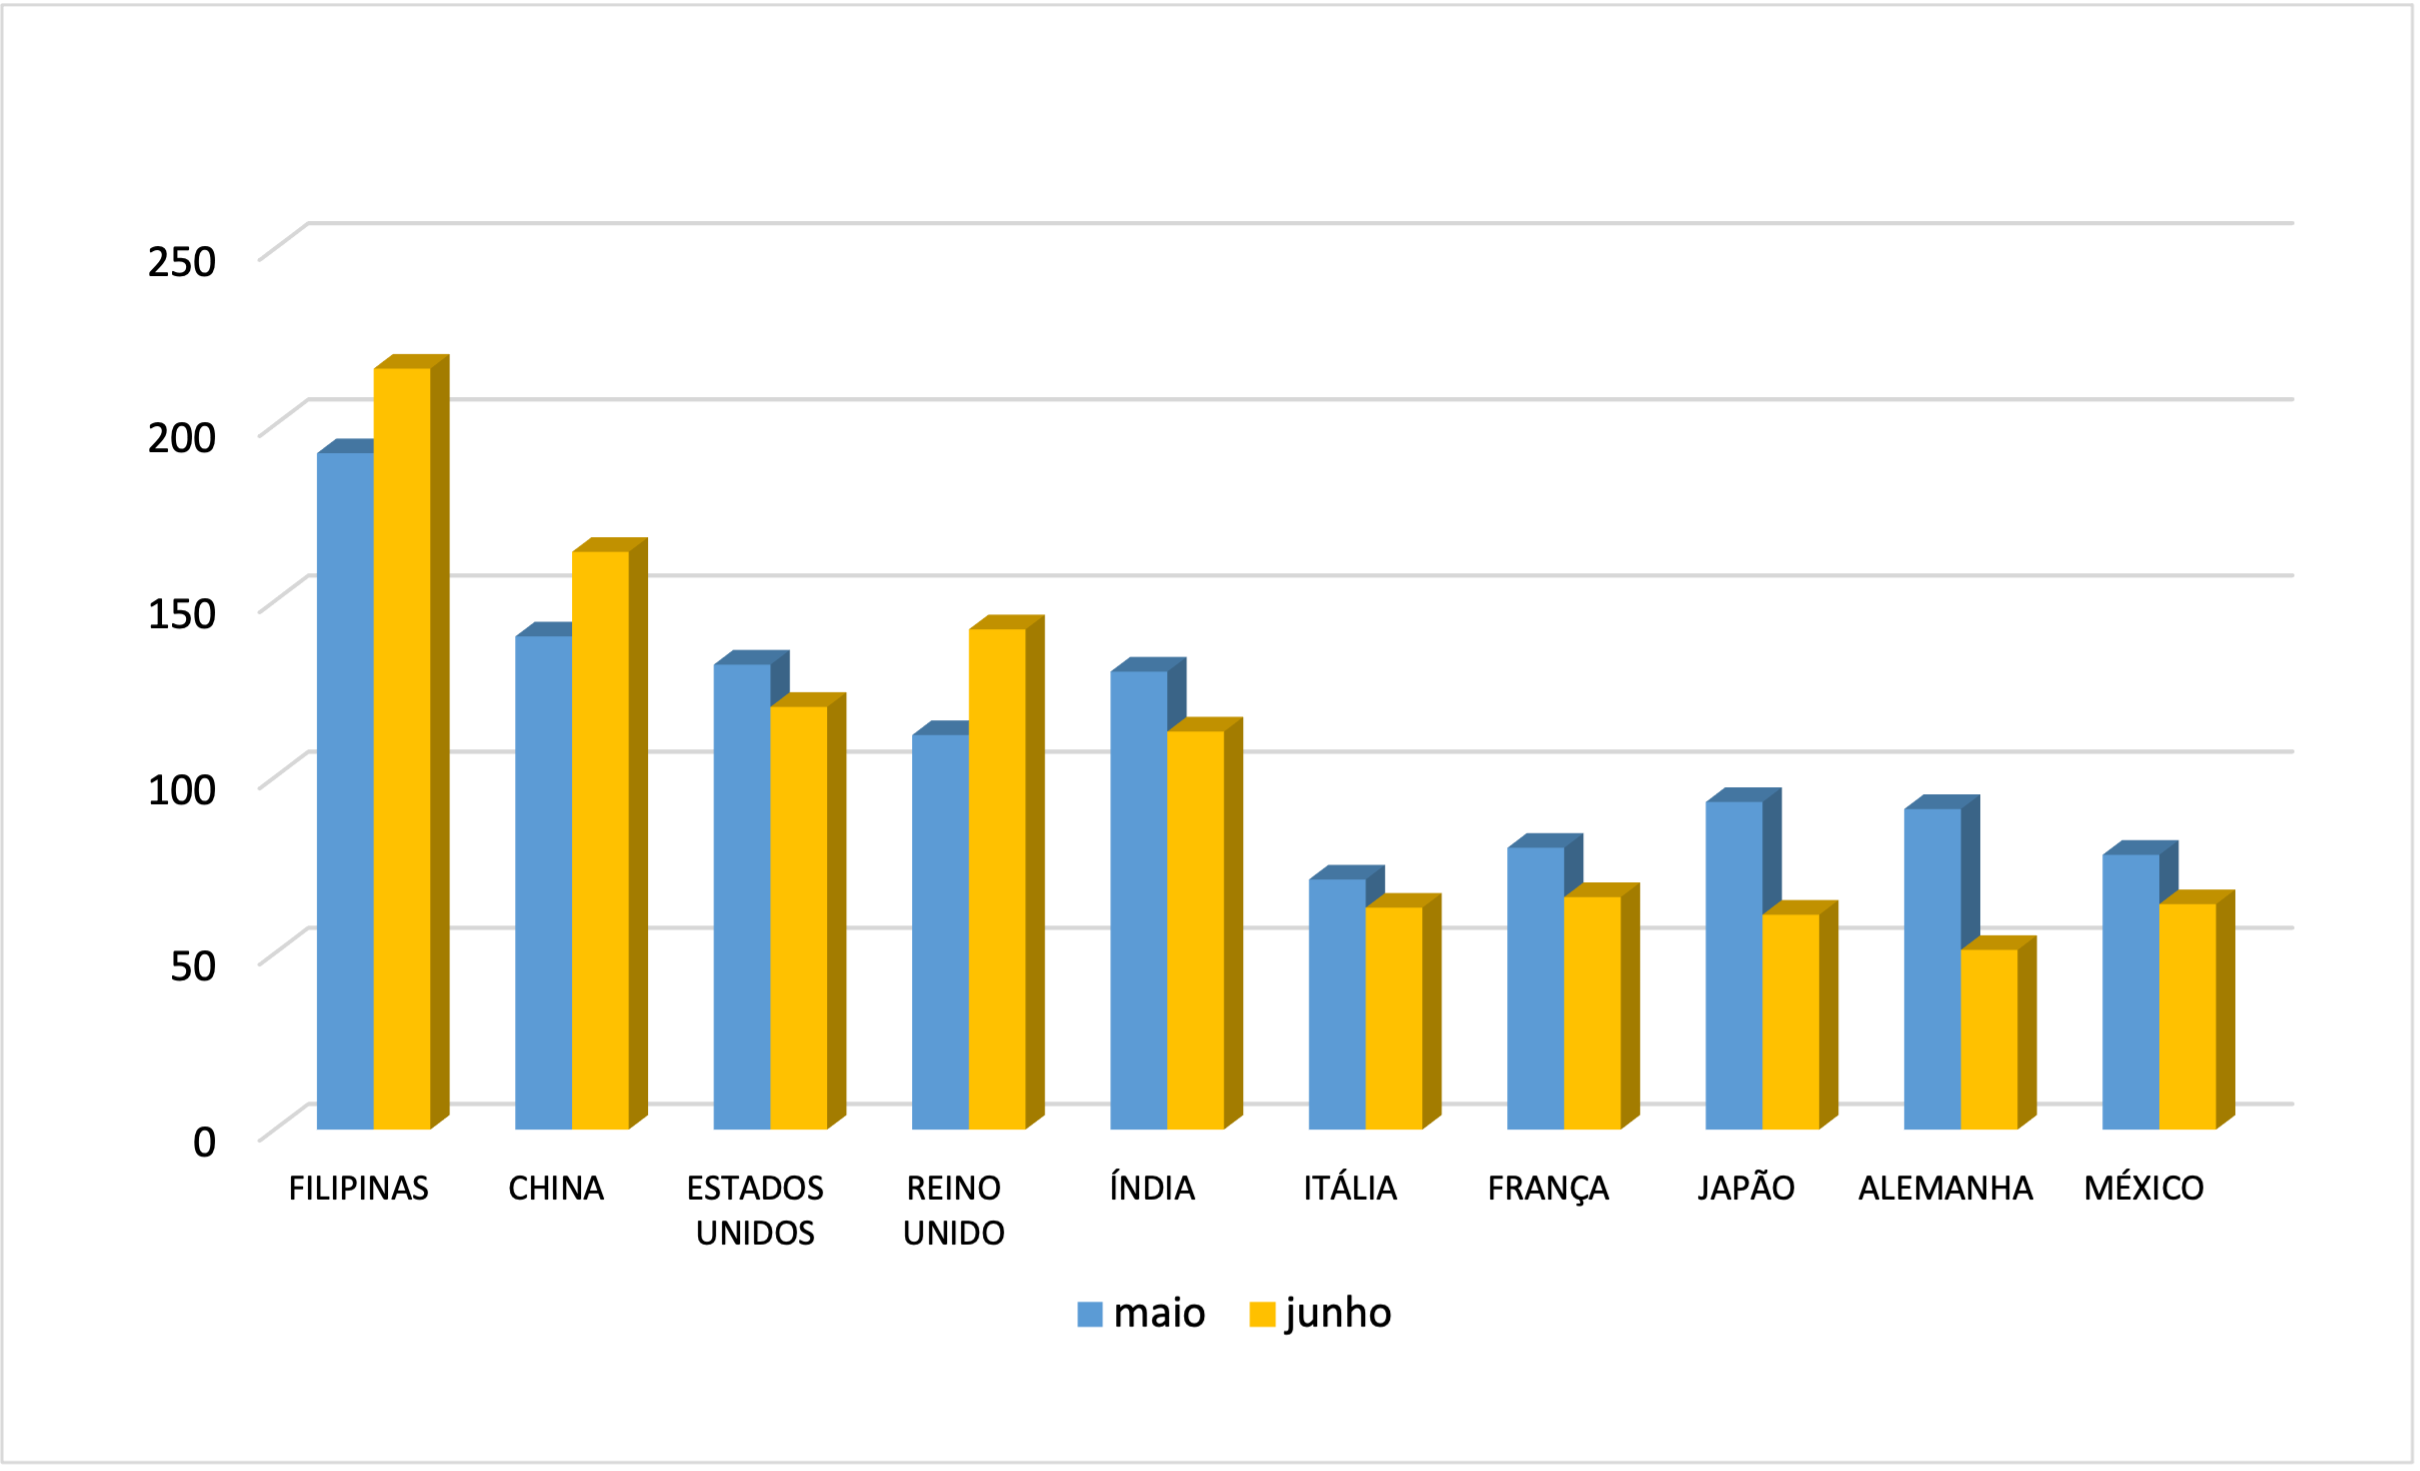
Source: General Coordination of Labor Immigration / Ministry of Justice and Public Security, June 2022.
GRAPH 3
Number of permits granted to skilled workers, by month and occupational groups, Brazil, May and June/2022.
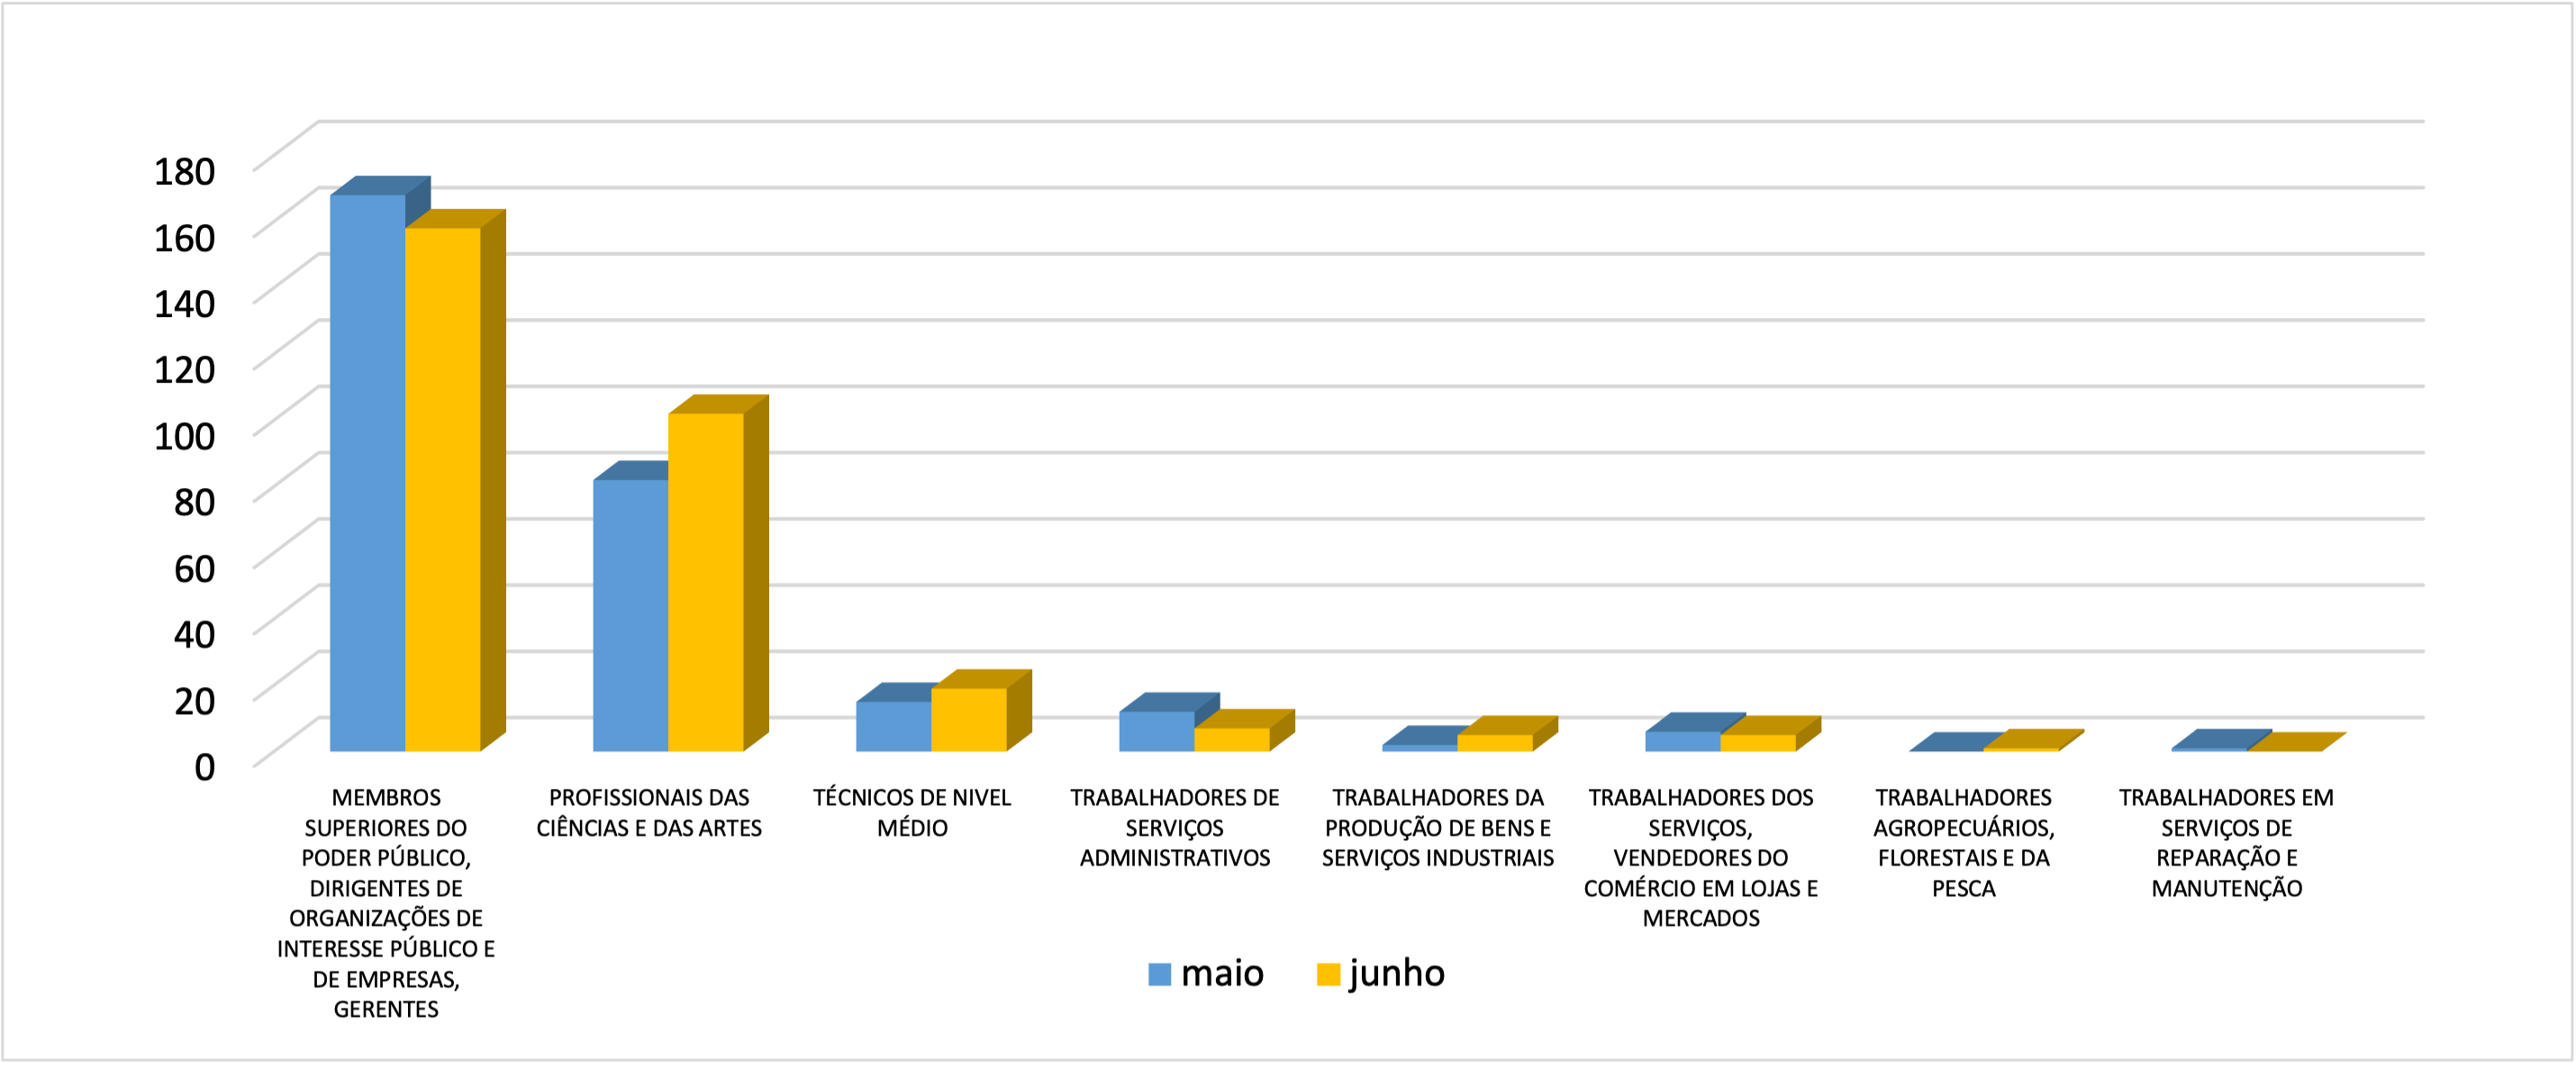
Source: General Coordination of Labor Immigration / Ministry of Justice and Public Security, June 2022.
CTPS/RAIS/NOVO CAGED
Harmonized database Work and Social Security Card (CTPS)/Annual Report of Social Information (RAIS)/New General Register of Employed and Unemployed Persons (CAGED)
Despite experiencing a negative fluctuation in April, the creation of jobs for immigrants has maintained an upward trend that began in January of this year, significantly surpassing the performance observed in May 2021 (Graph 4).
The occupation of production line feeder was the one that saw the highest movement of immigrant workers in the formal market in May (Graph 5).
The South Region continued to be the most dynamic in terms of generating job opportunities for immigrants, followed by the Southeast Region (Map 1).
GRAPH 4
Jobs created for immigrants in the formal labor market, by month - Brazil, 2019/2022
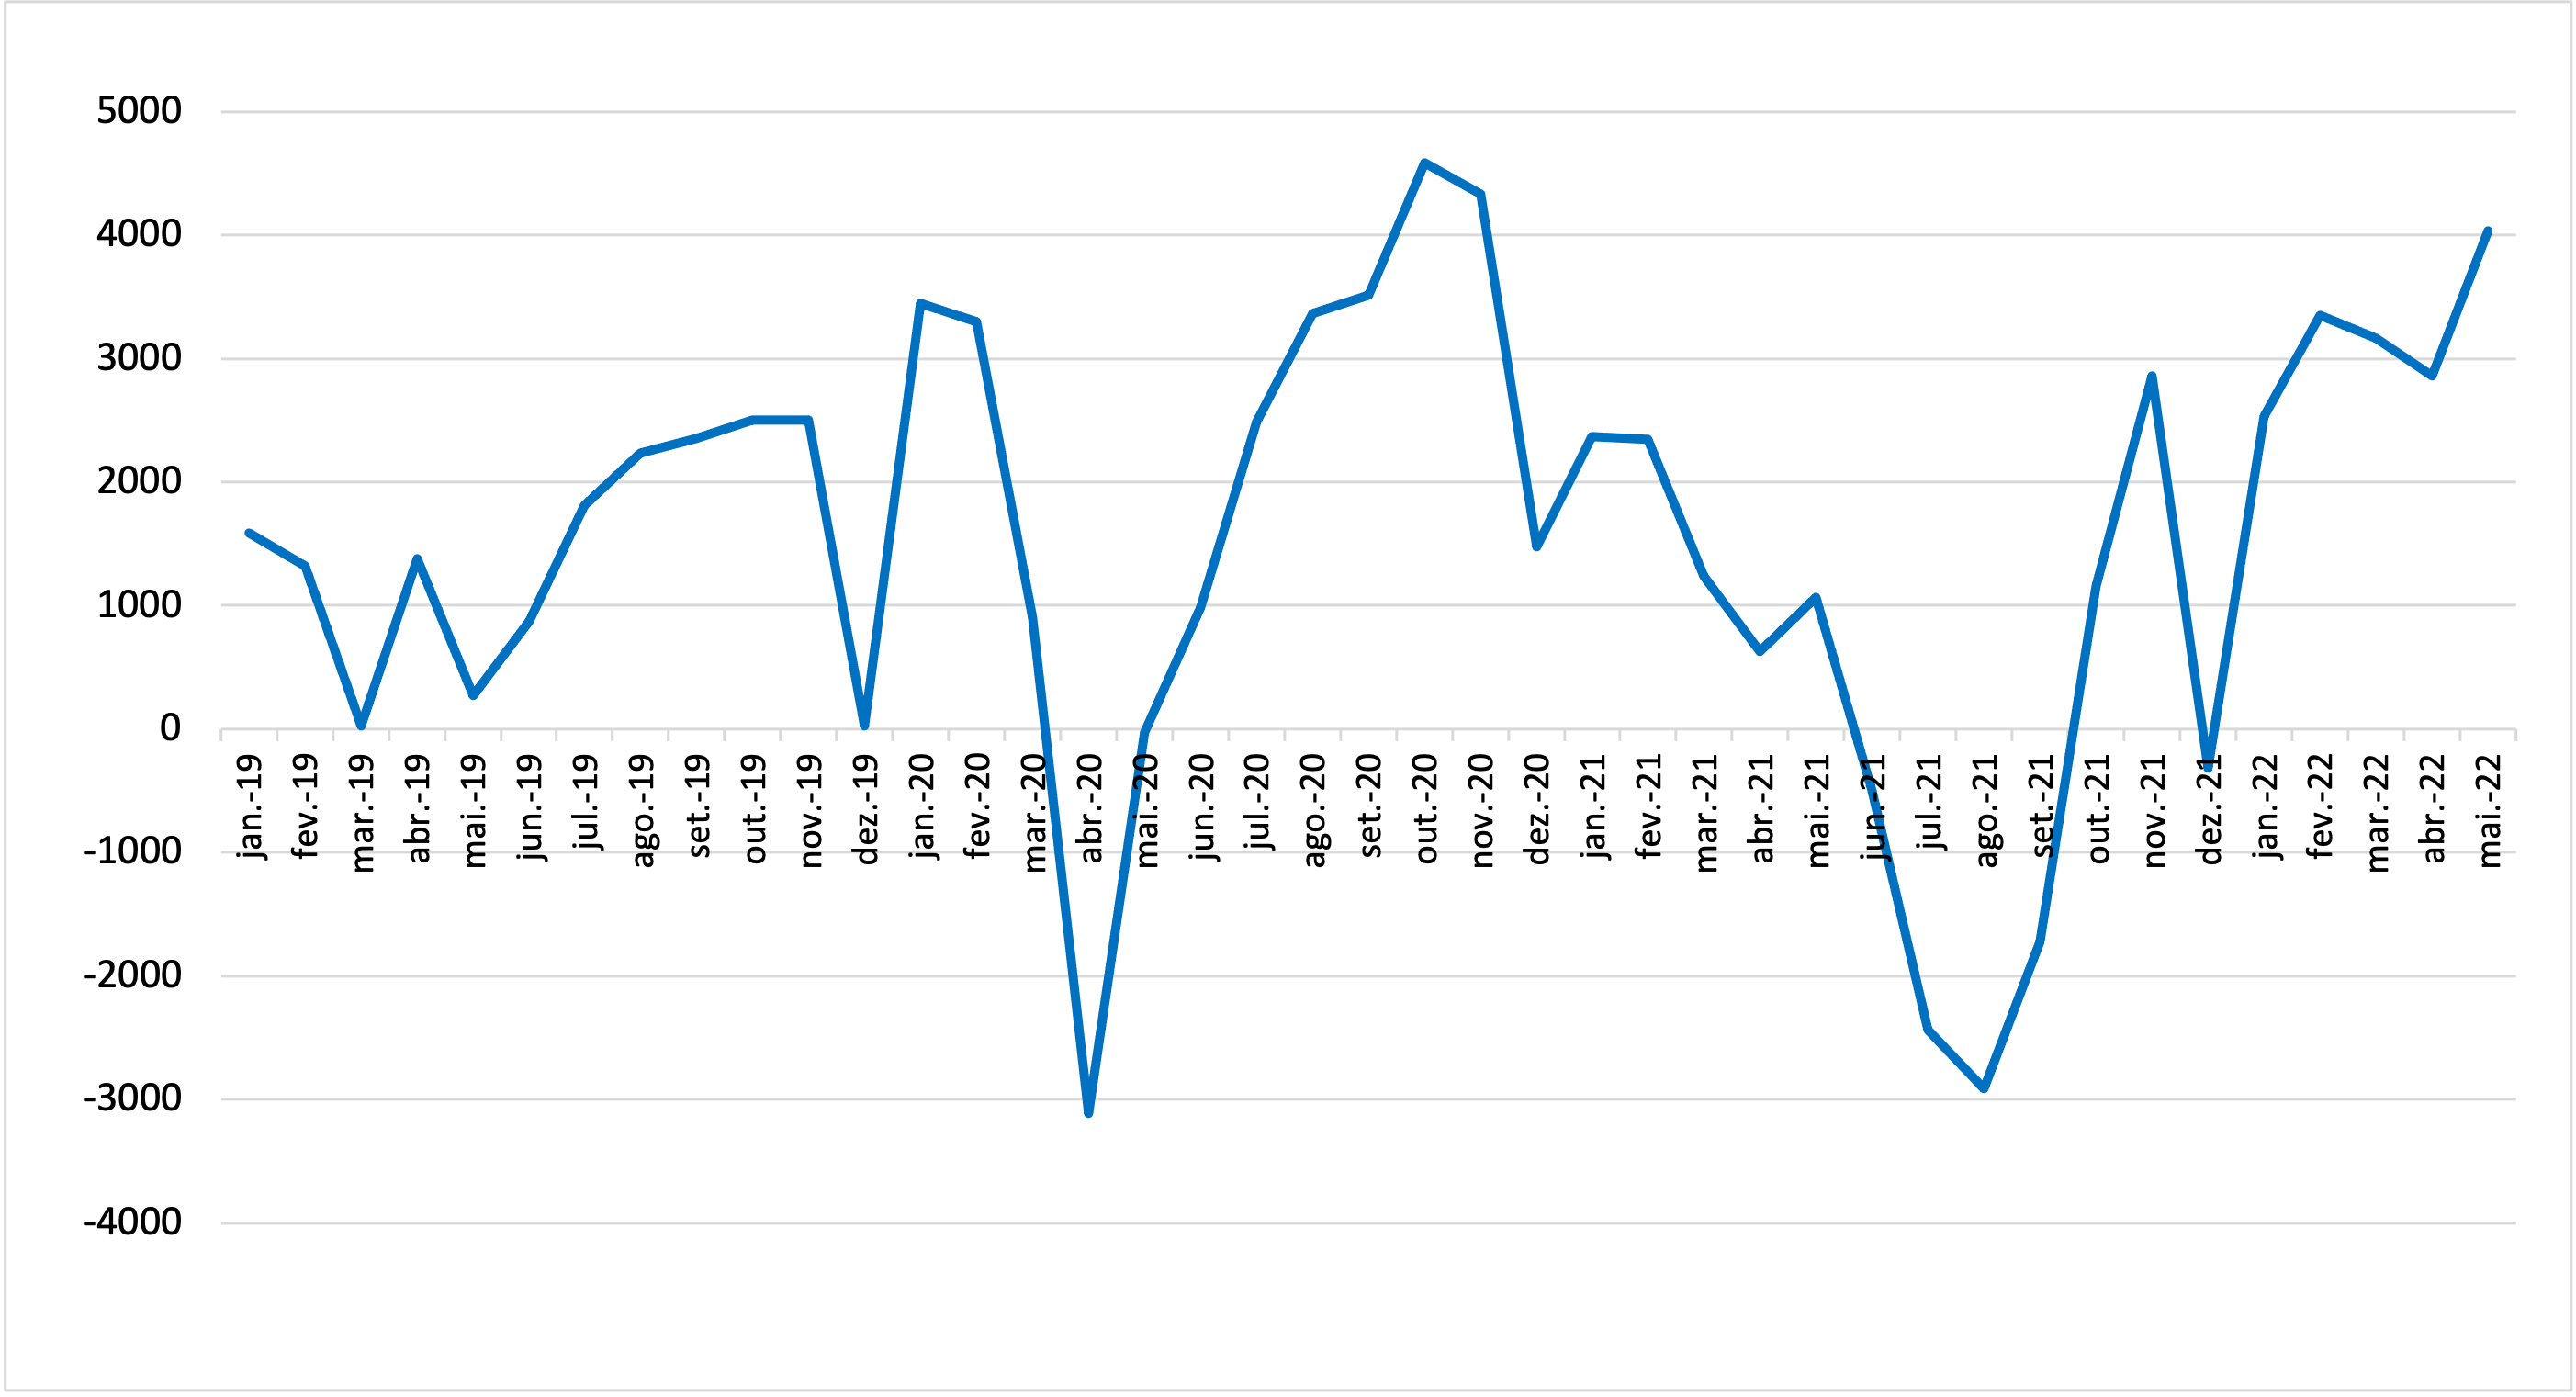
Source: OBMigra (2022), based on data from the harmonized database RAIS-CTPS-CAGED and the Digital System of Tax, Social Security and Labor
Obligations (eSocial).
GRAPH 5
Movements of migrant workers in the formal labor market, by month and main occupations - Brazil, May 2022.
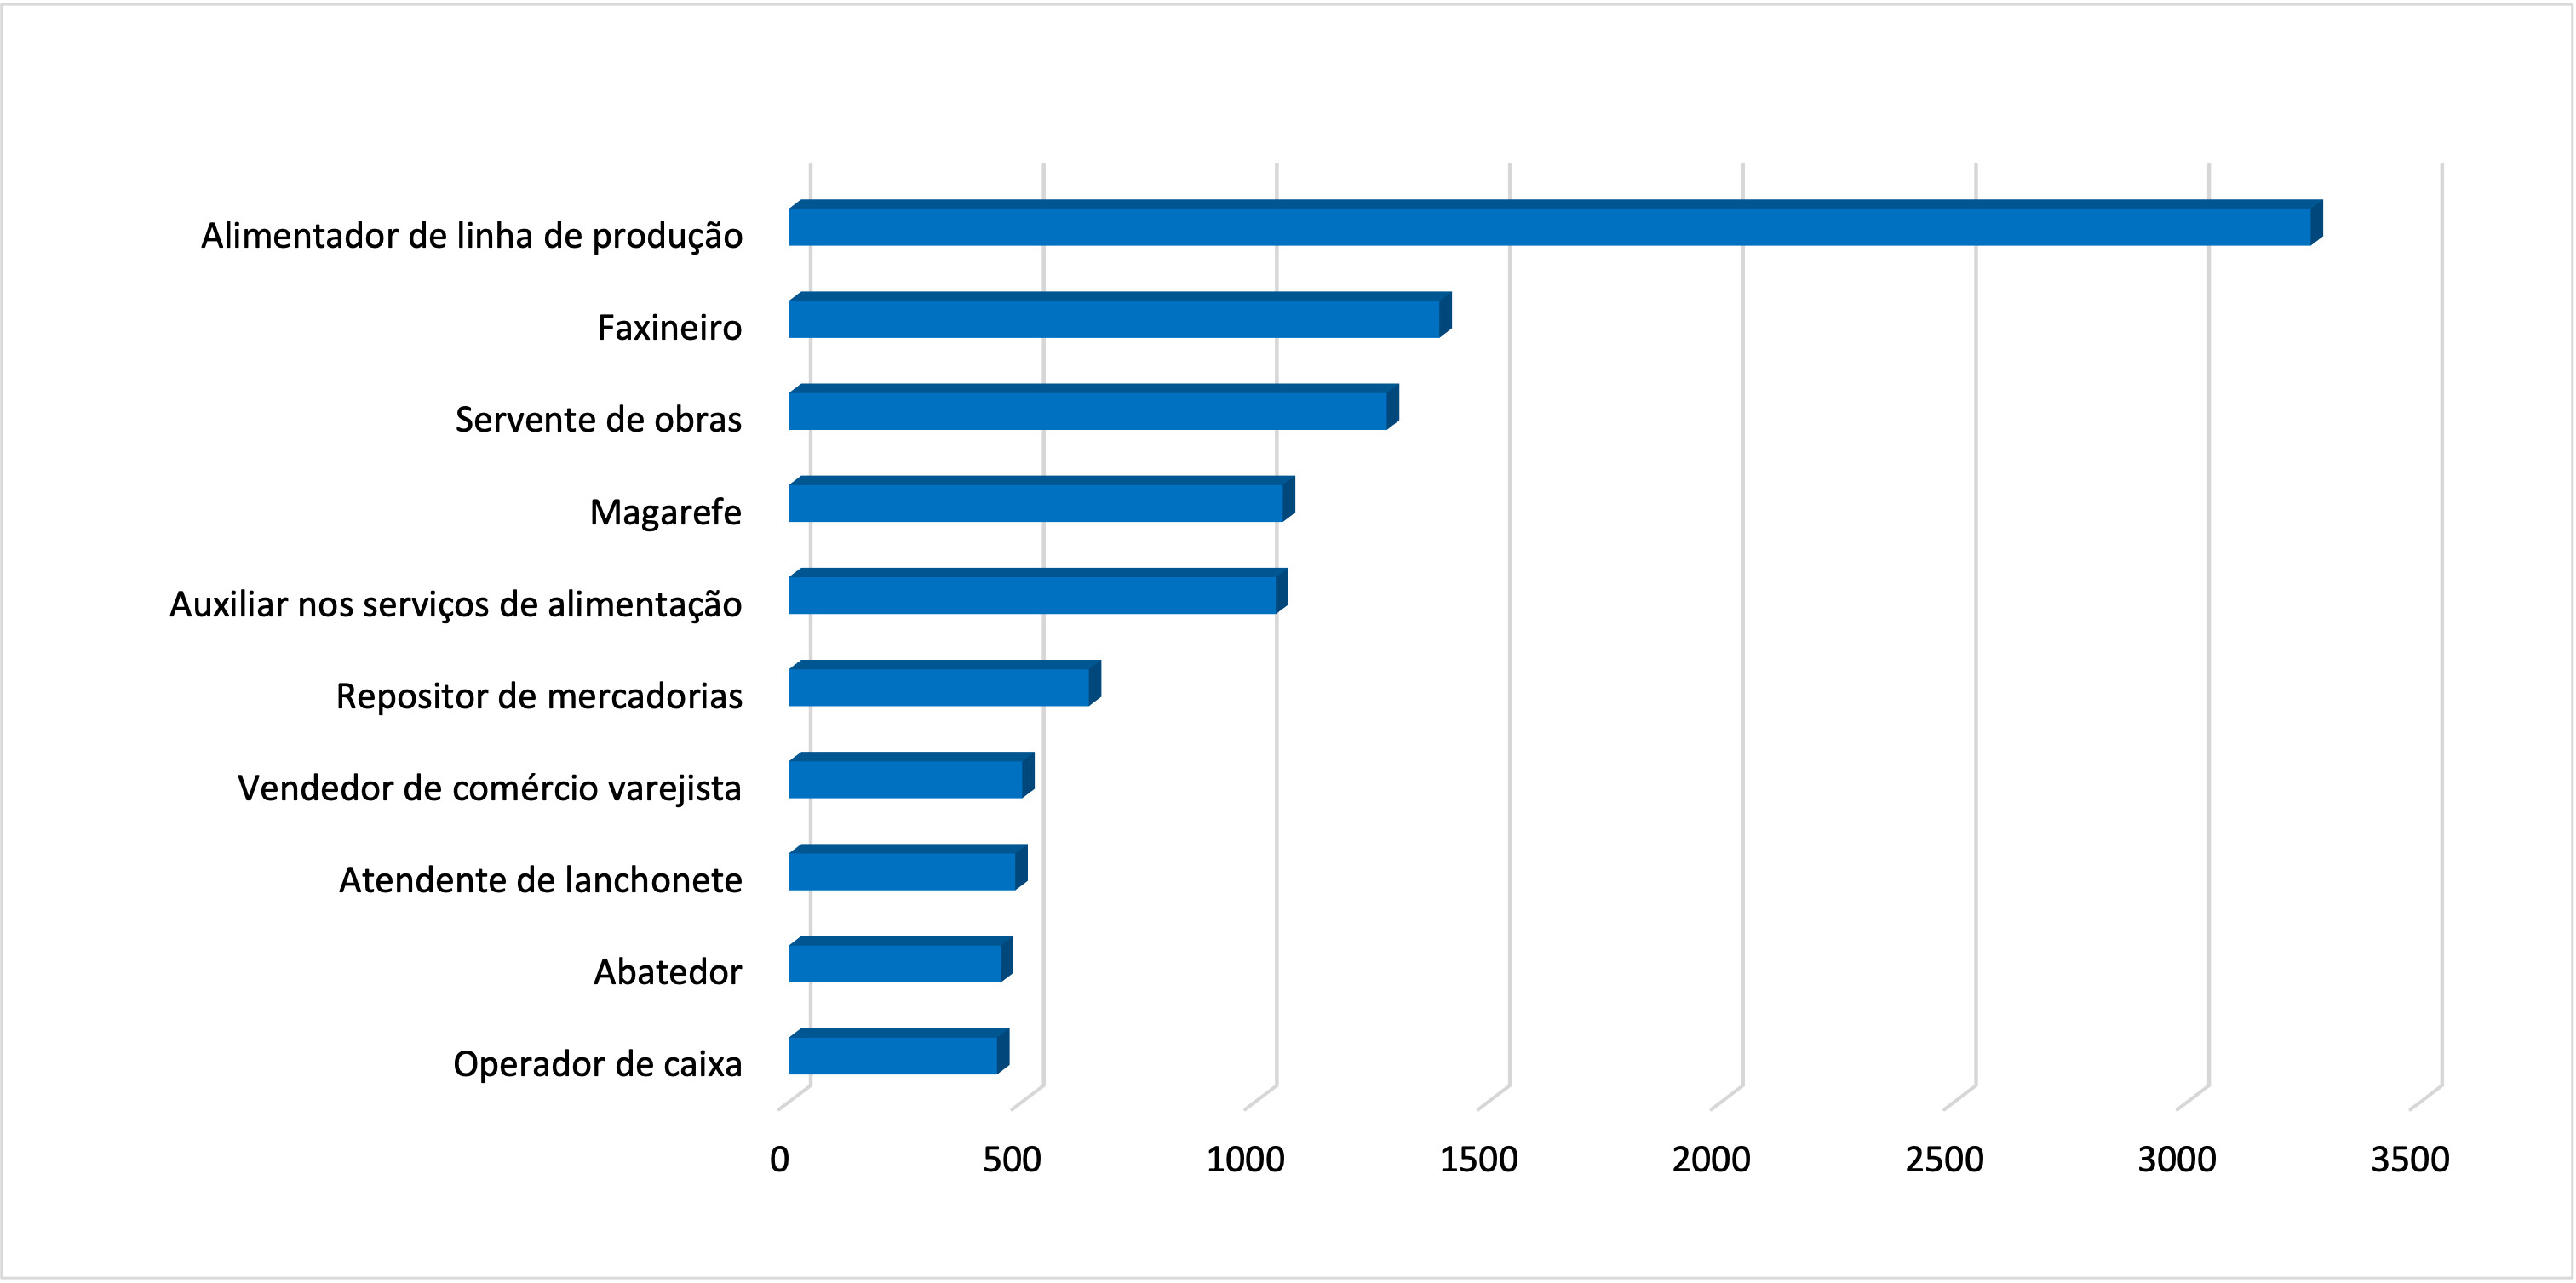
Source: OBMigra (May 2022), based on data from the Ministry of Economy, Harmonized database RAIS-CTPS-CAGED
MAP 1
Number of jobs created, according to Regions, May 2022.
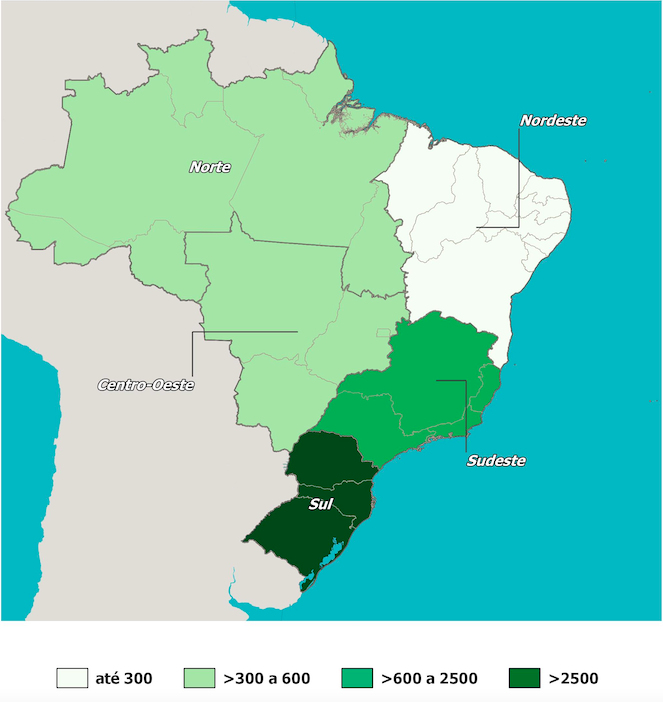
Source: OBMigra (May 2022), based on data from the Ministry of Economy, Harmonized database RAIS-CTPS-CAGED
STI
STI (International Traffic System)
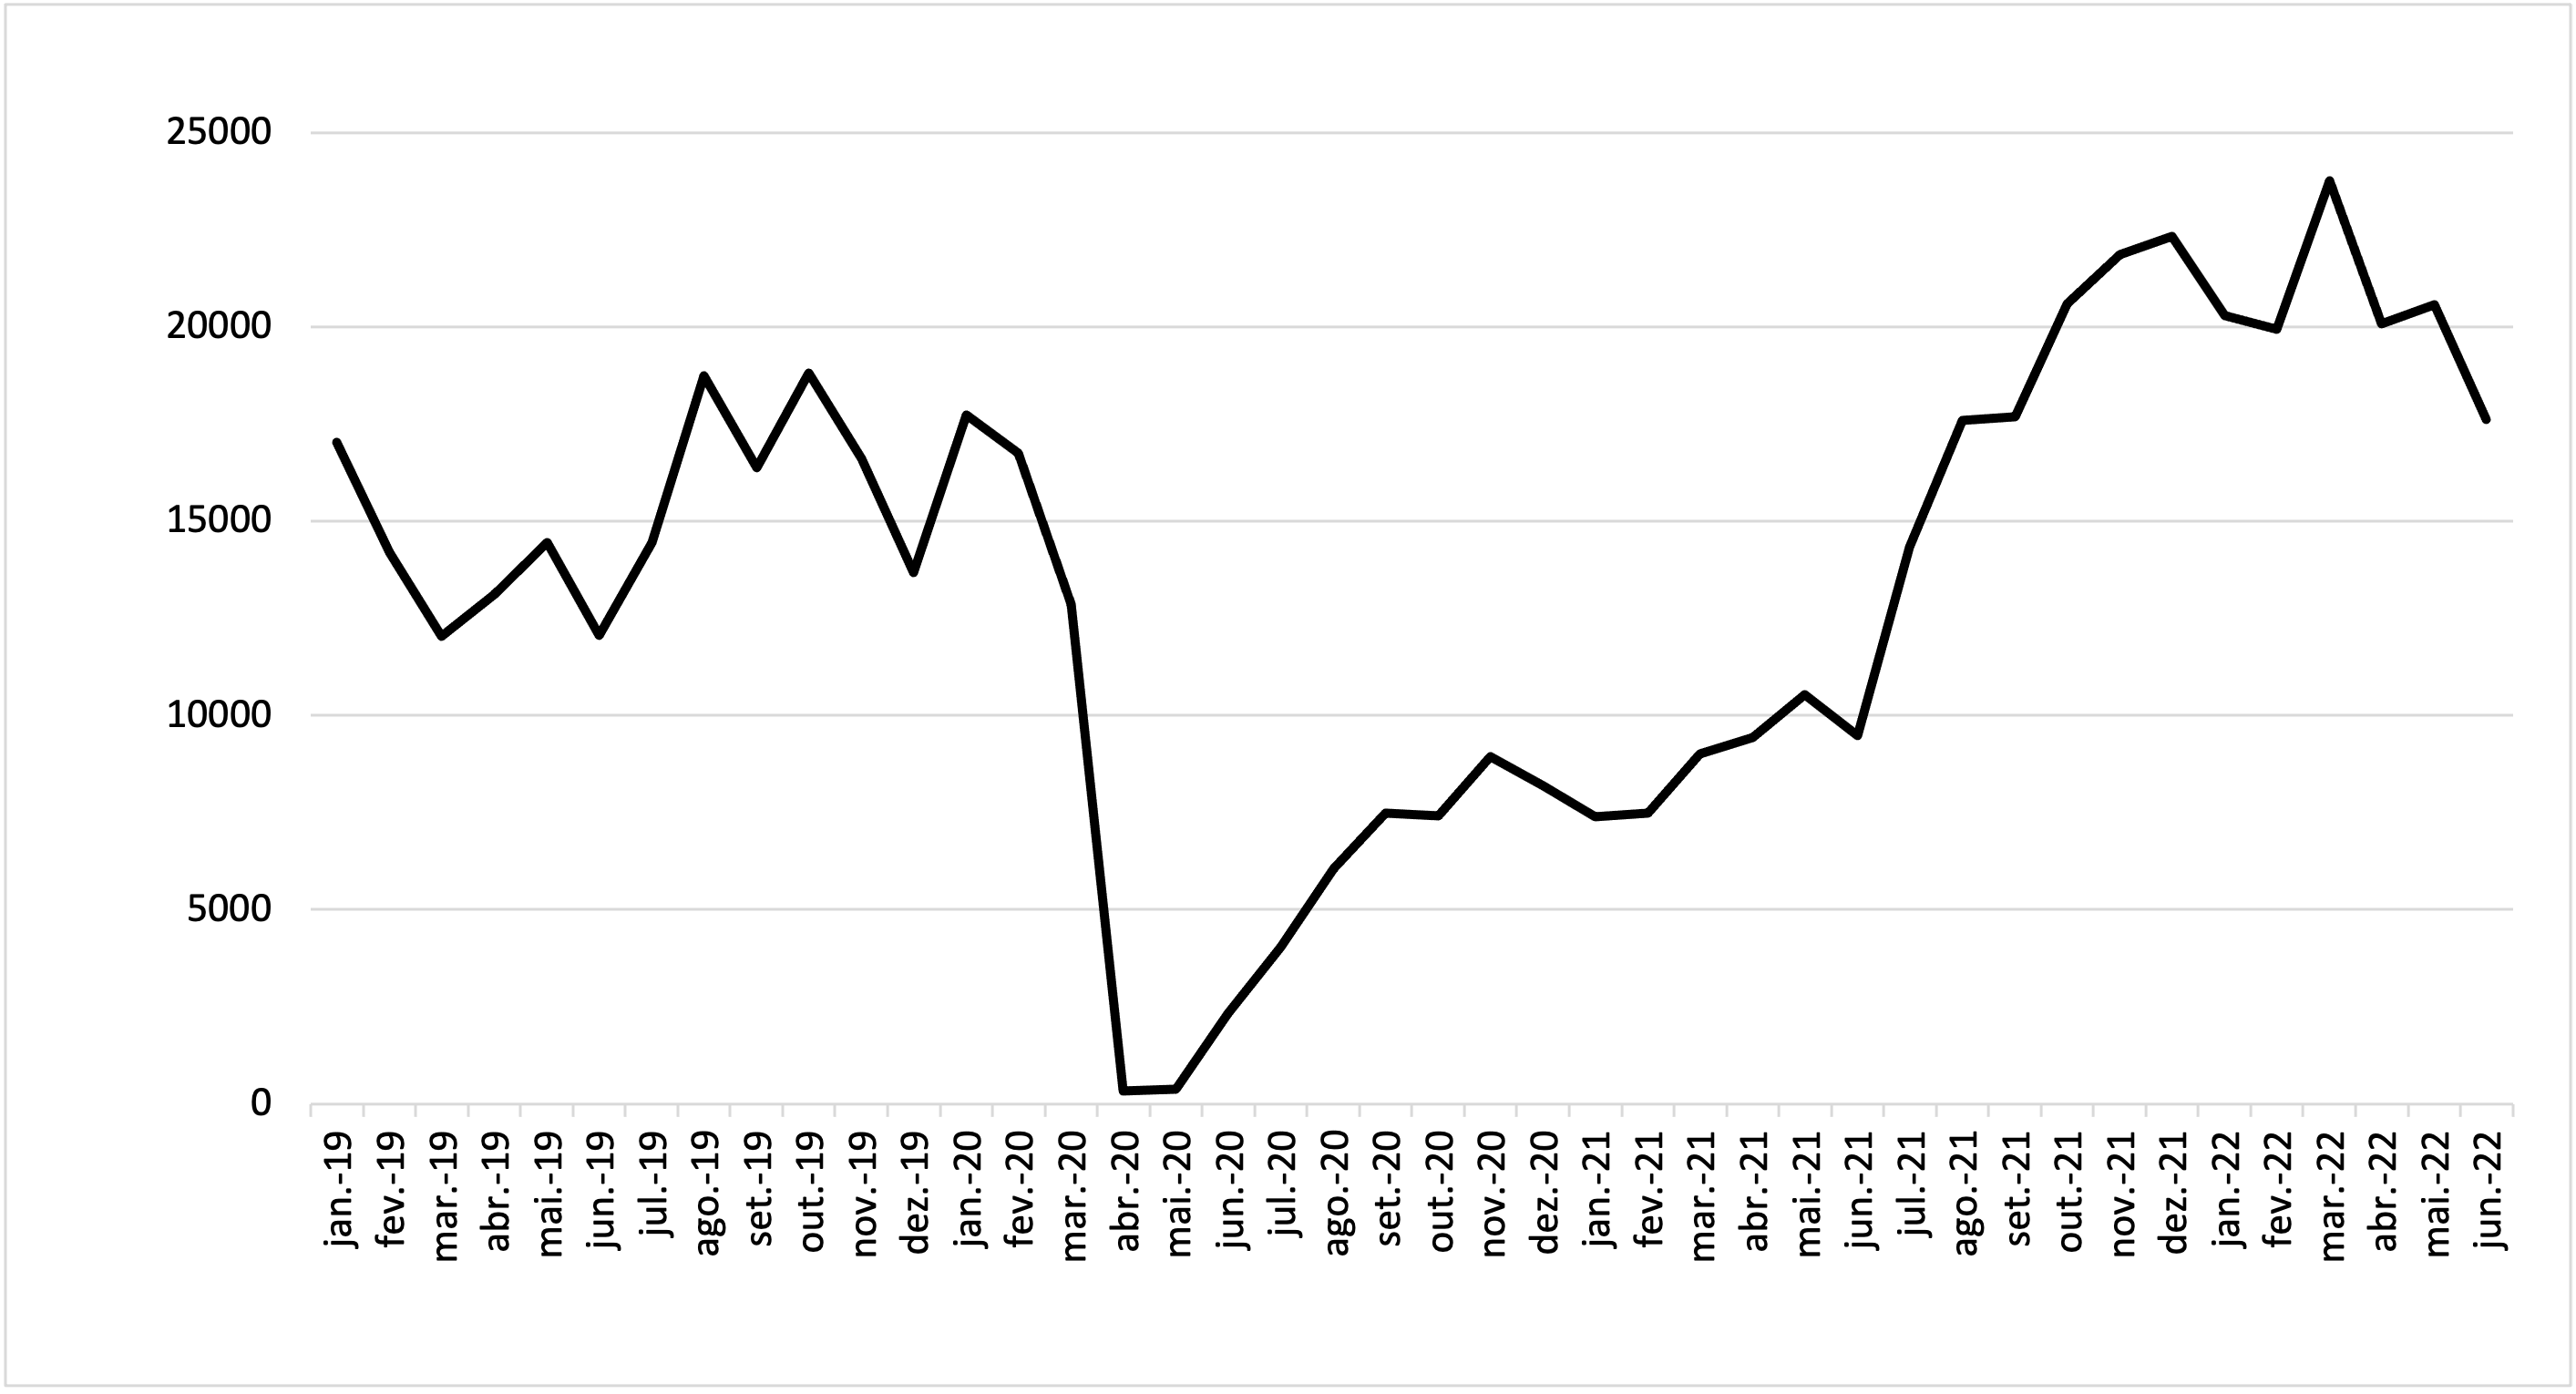
Cross-border movements of people have remained stable in June, following a pattern observed since January of this year, with minor fluctuations during the period. The comparison with the same month in 2019 confirms that international human mobility has not yet fully recovered from the impact caused by the SARS-CoV-2 pandemic (Graph 6).
In June, the negative balance in the movement of people, although lower than in May, was still driven by a higher number of Brazilian departures (Graph 7).
GRAPH 6
Cross-border movements, by month of registration, Brazil 2019/2022
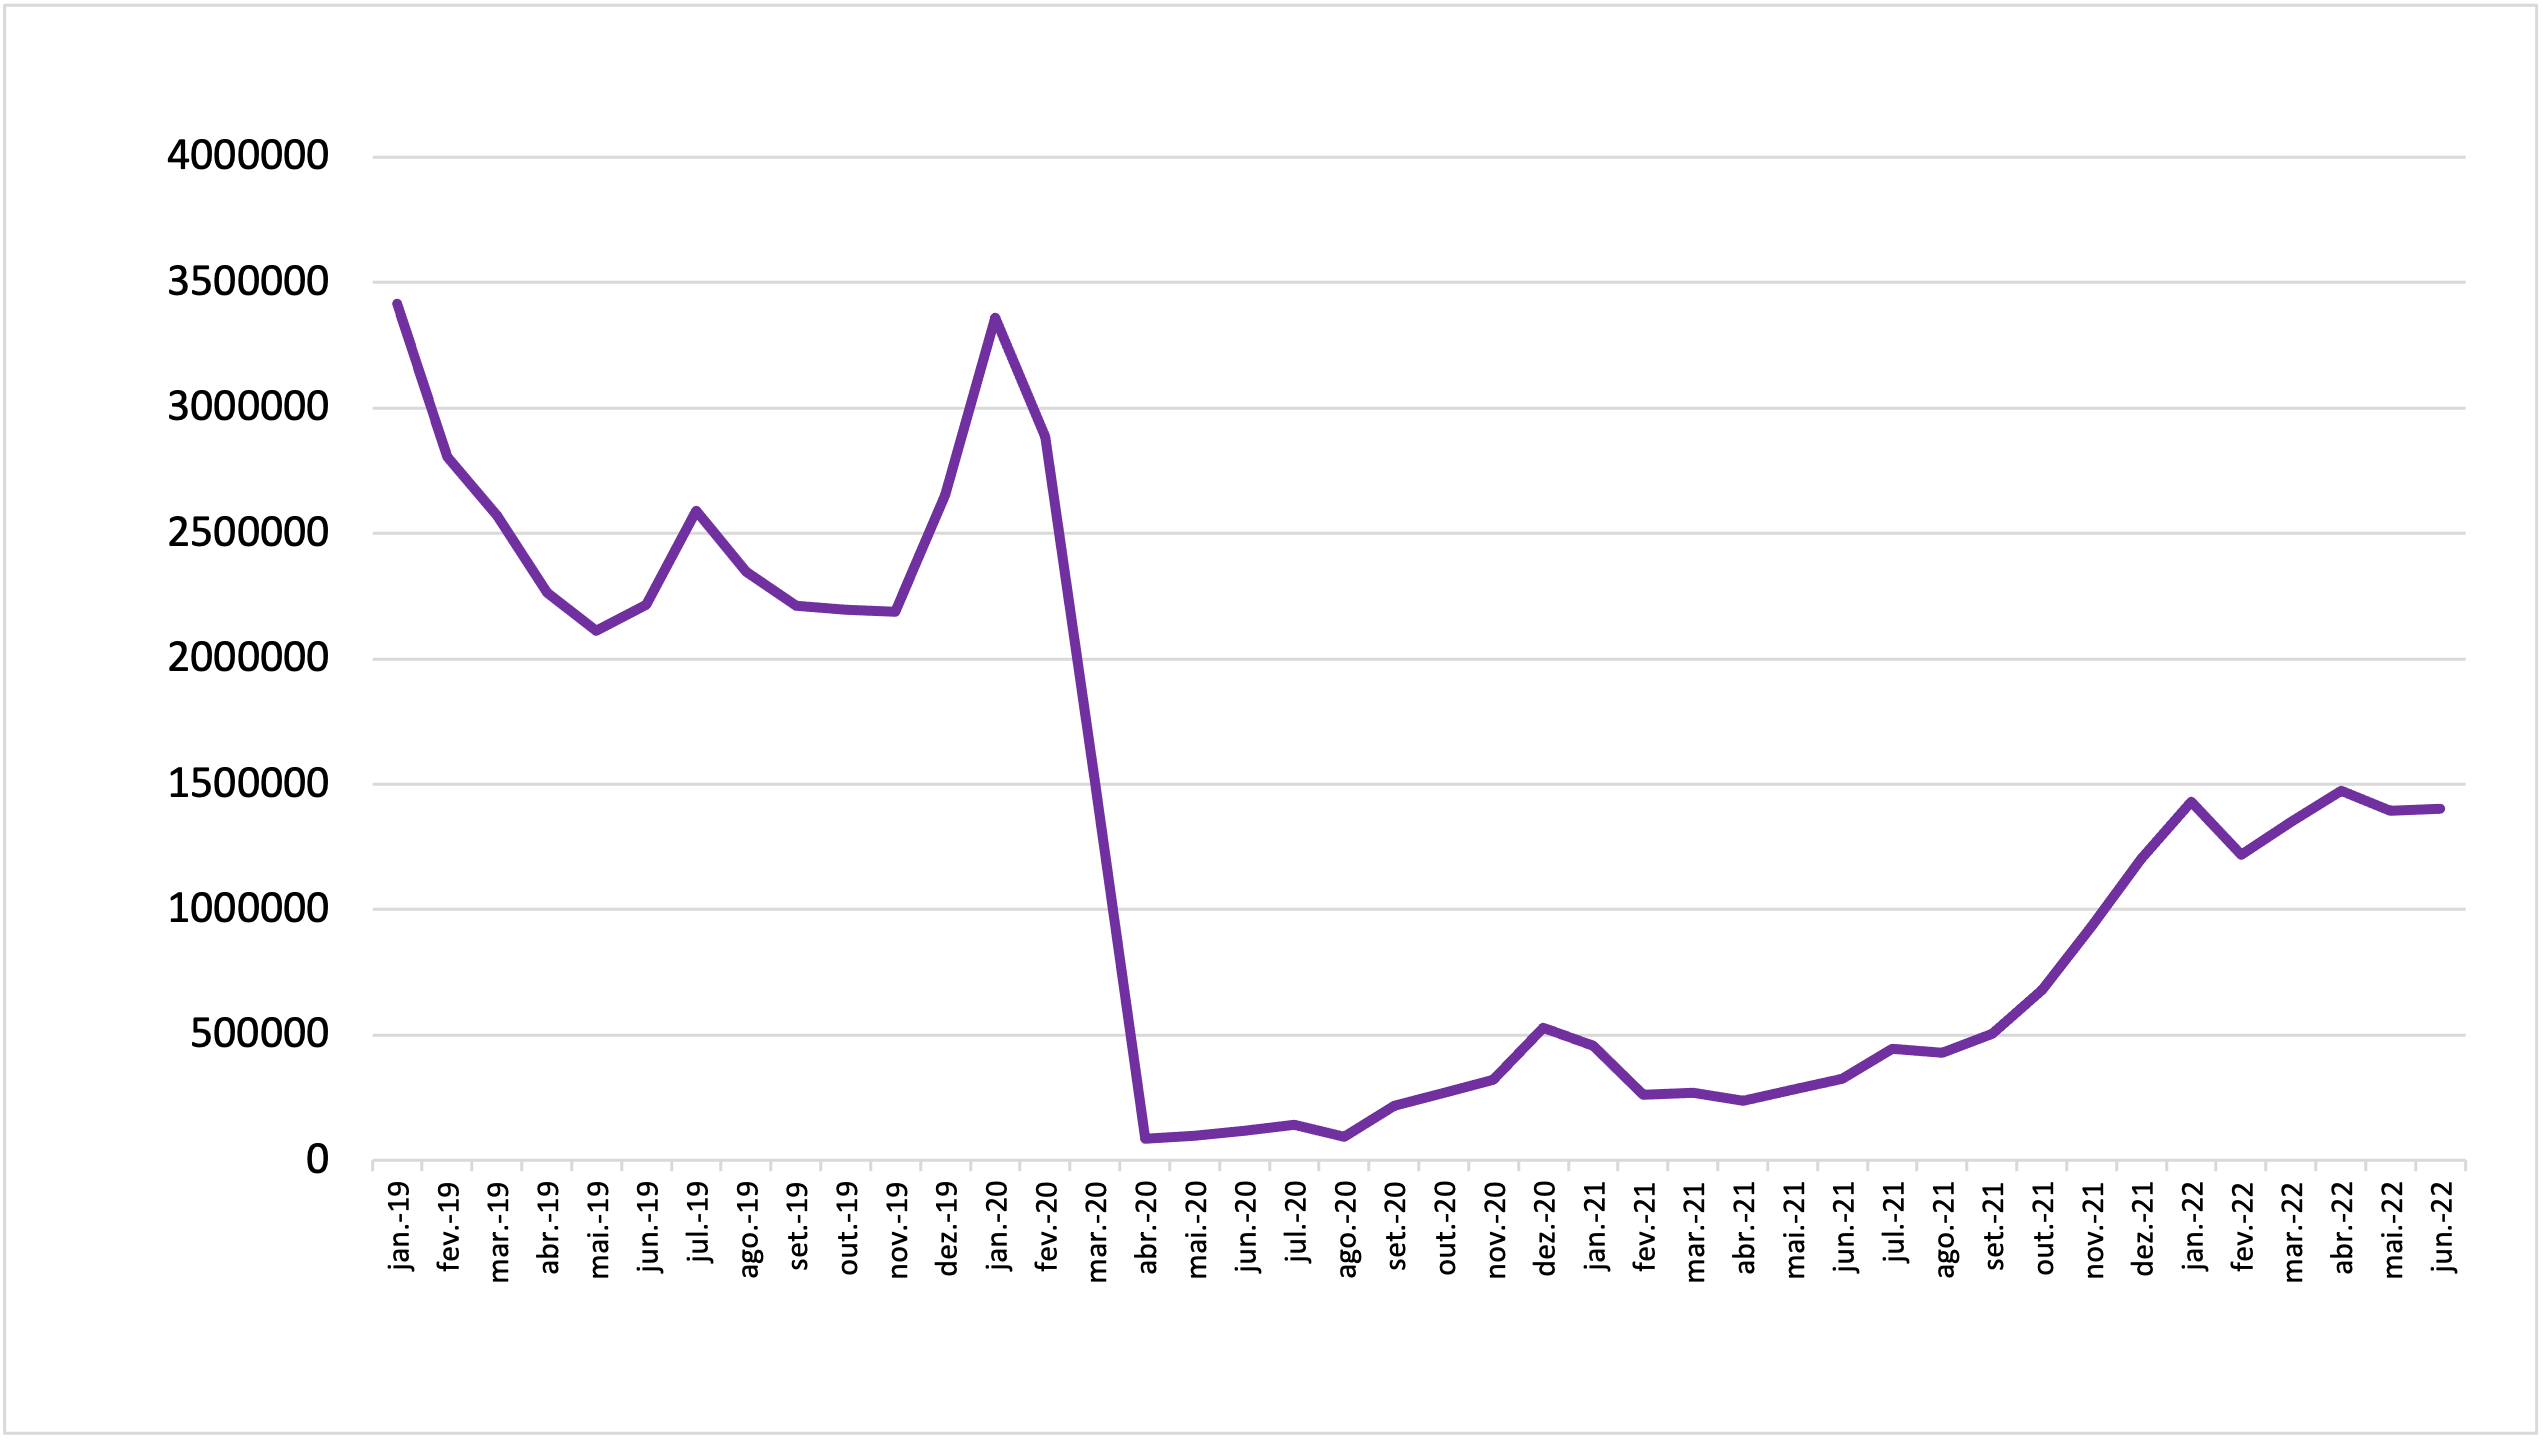
Source: OBMigra (2022), based on data from the Brazilian Federal Police, International Traffic System (STI).
GRAPH 7
Cross-border movements of people, according to typology - Brazil, June 2022.
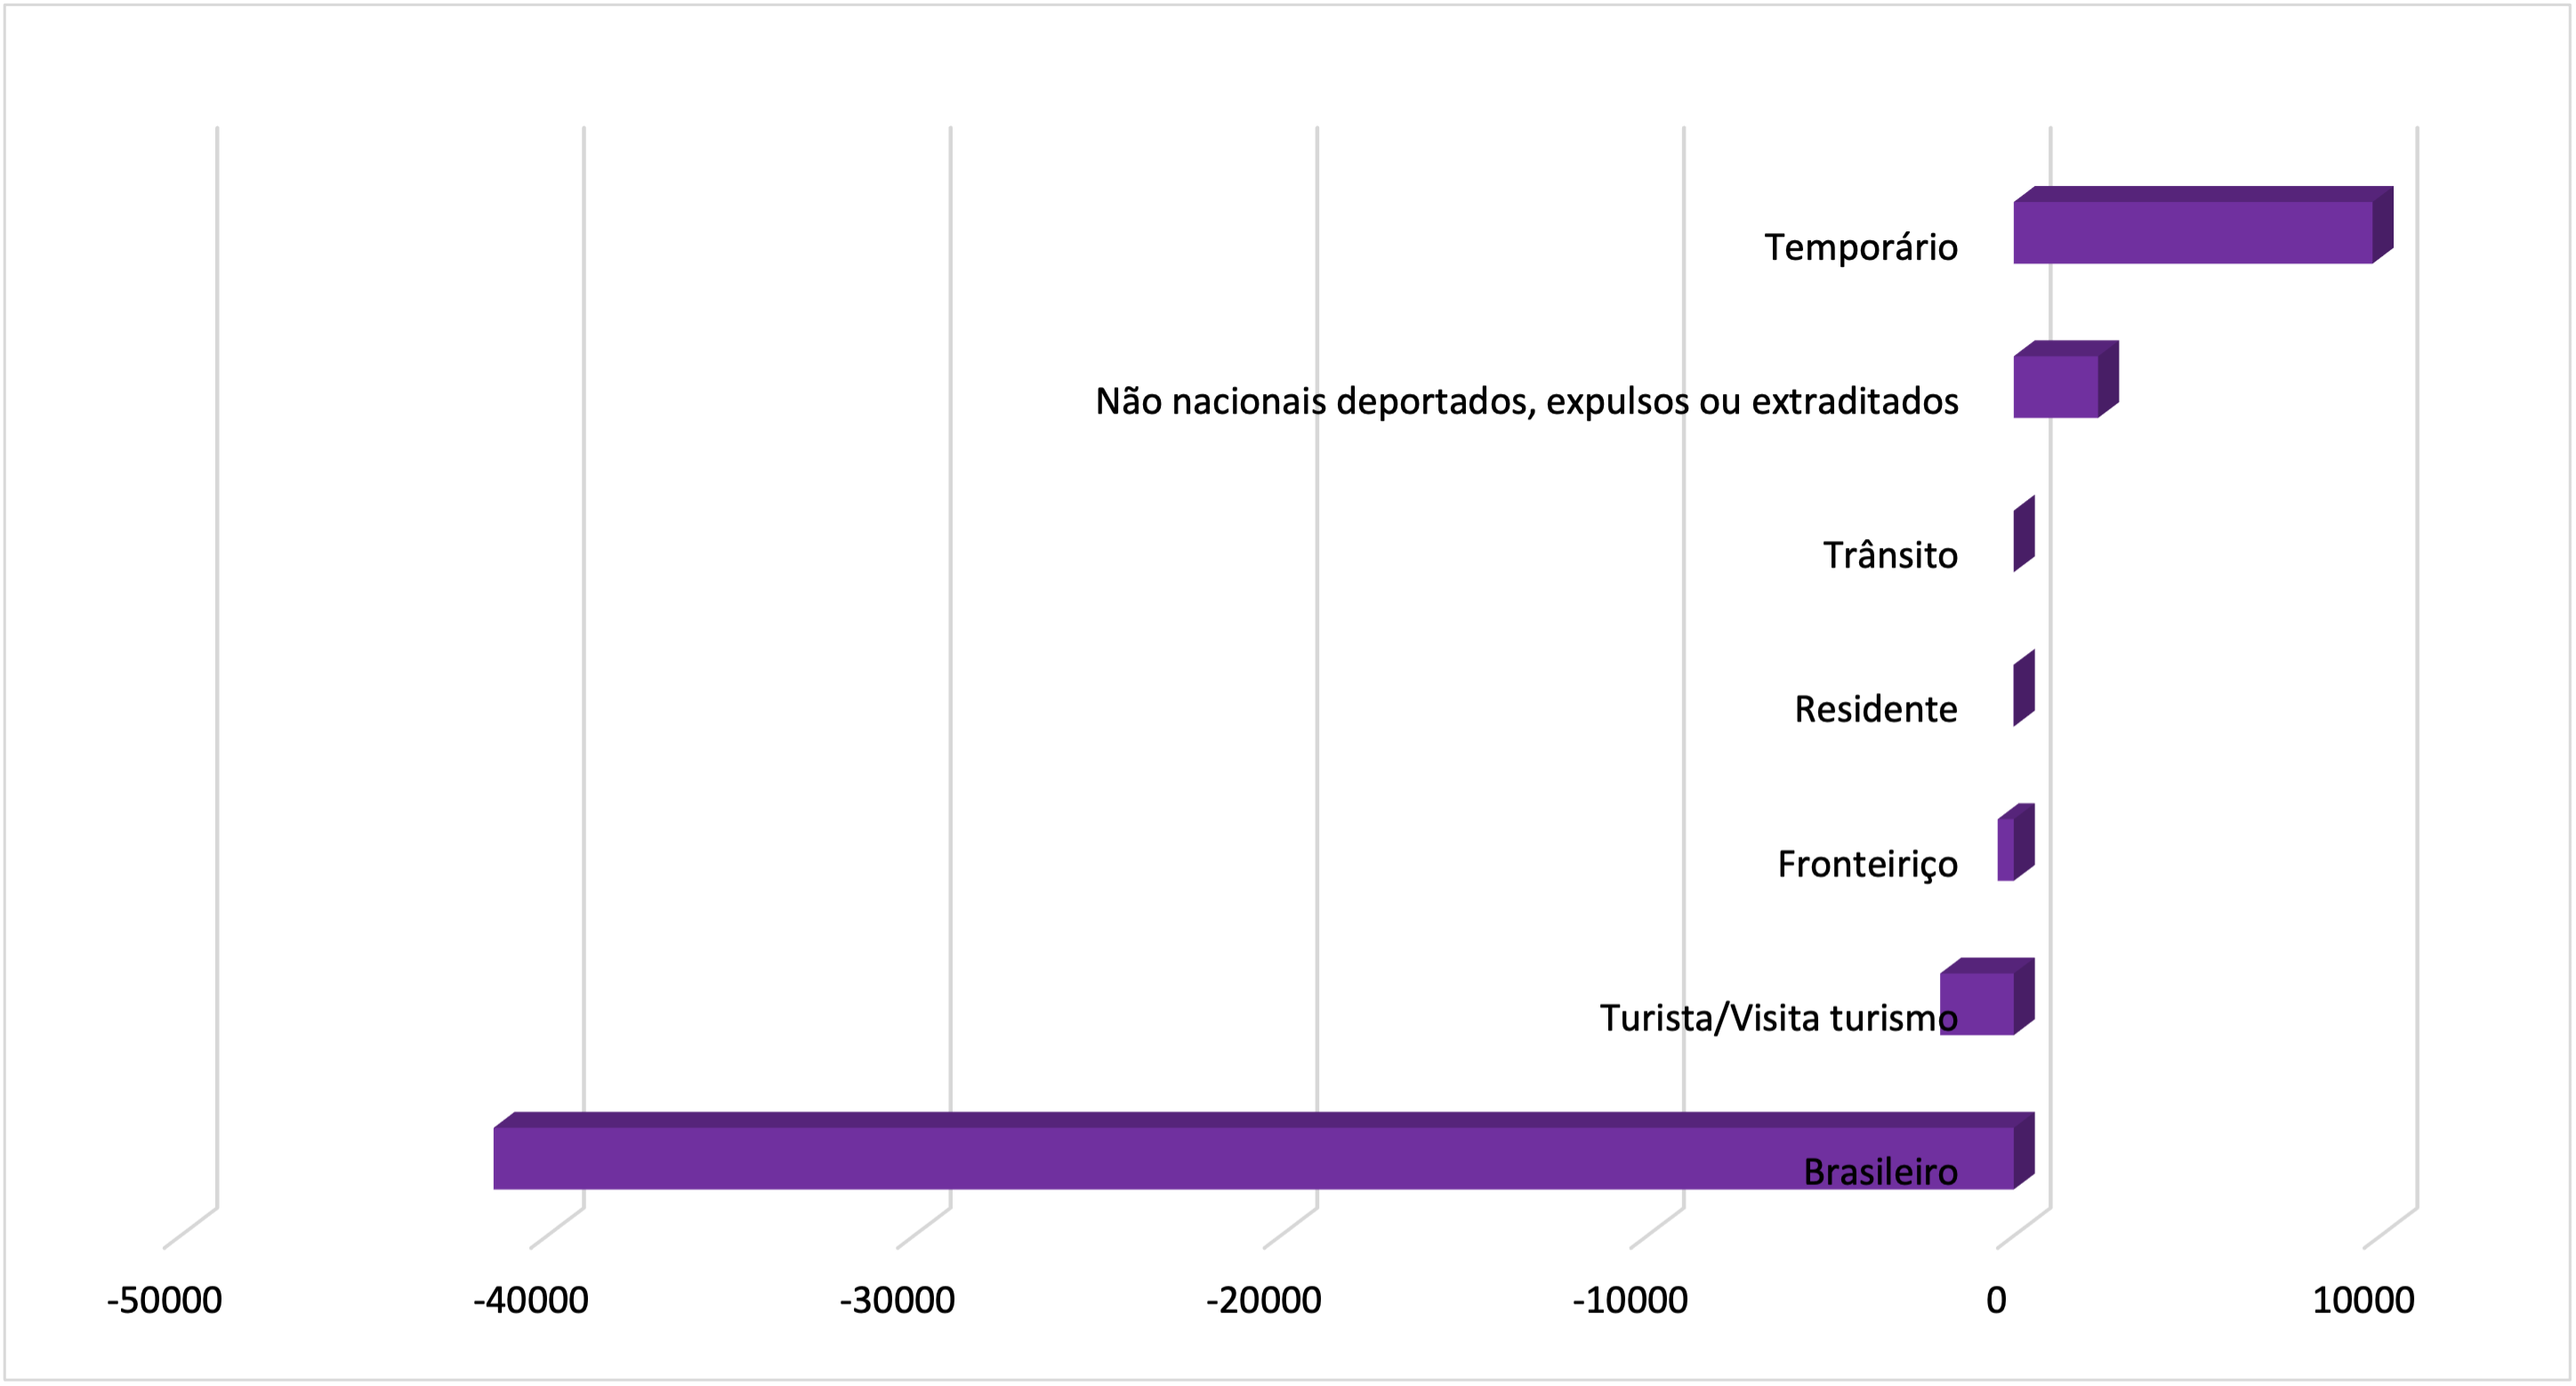
Source: OBMigra (June 2022), based on data from the Brazilian Federal Police, International Traffic System (STI).
SISMIGRA
SisMigra (National Migration Registry System)
The number of residence registrations in 2022 has been consistently declining, with this trend starting in January of this year (Graph 8). This decline in residence registrations has been primarily driven by the decrease in Venezuelan immigration, which, although still the largest group among immigrants, has been decreasing in numbers over the months (Map 2 and Graph 9).
GRAPH 8
Number of immigrant registrations, by month of registration - Brazil, 2019/2022
Source: OBMigra (2022), based on data from the Brazilian Federal Police, National Migration Registry System (SISMIGRA).
GRAPH 9
Number of migrant registrations, according to month of registration, sex and main countries - Brazil, May and June, 2022.
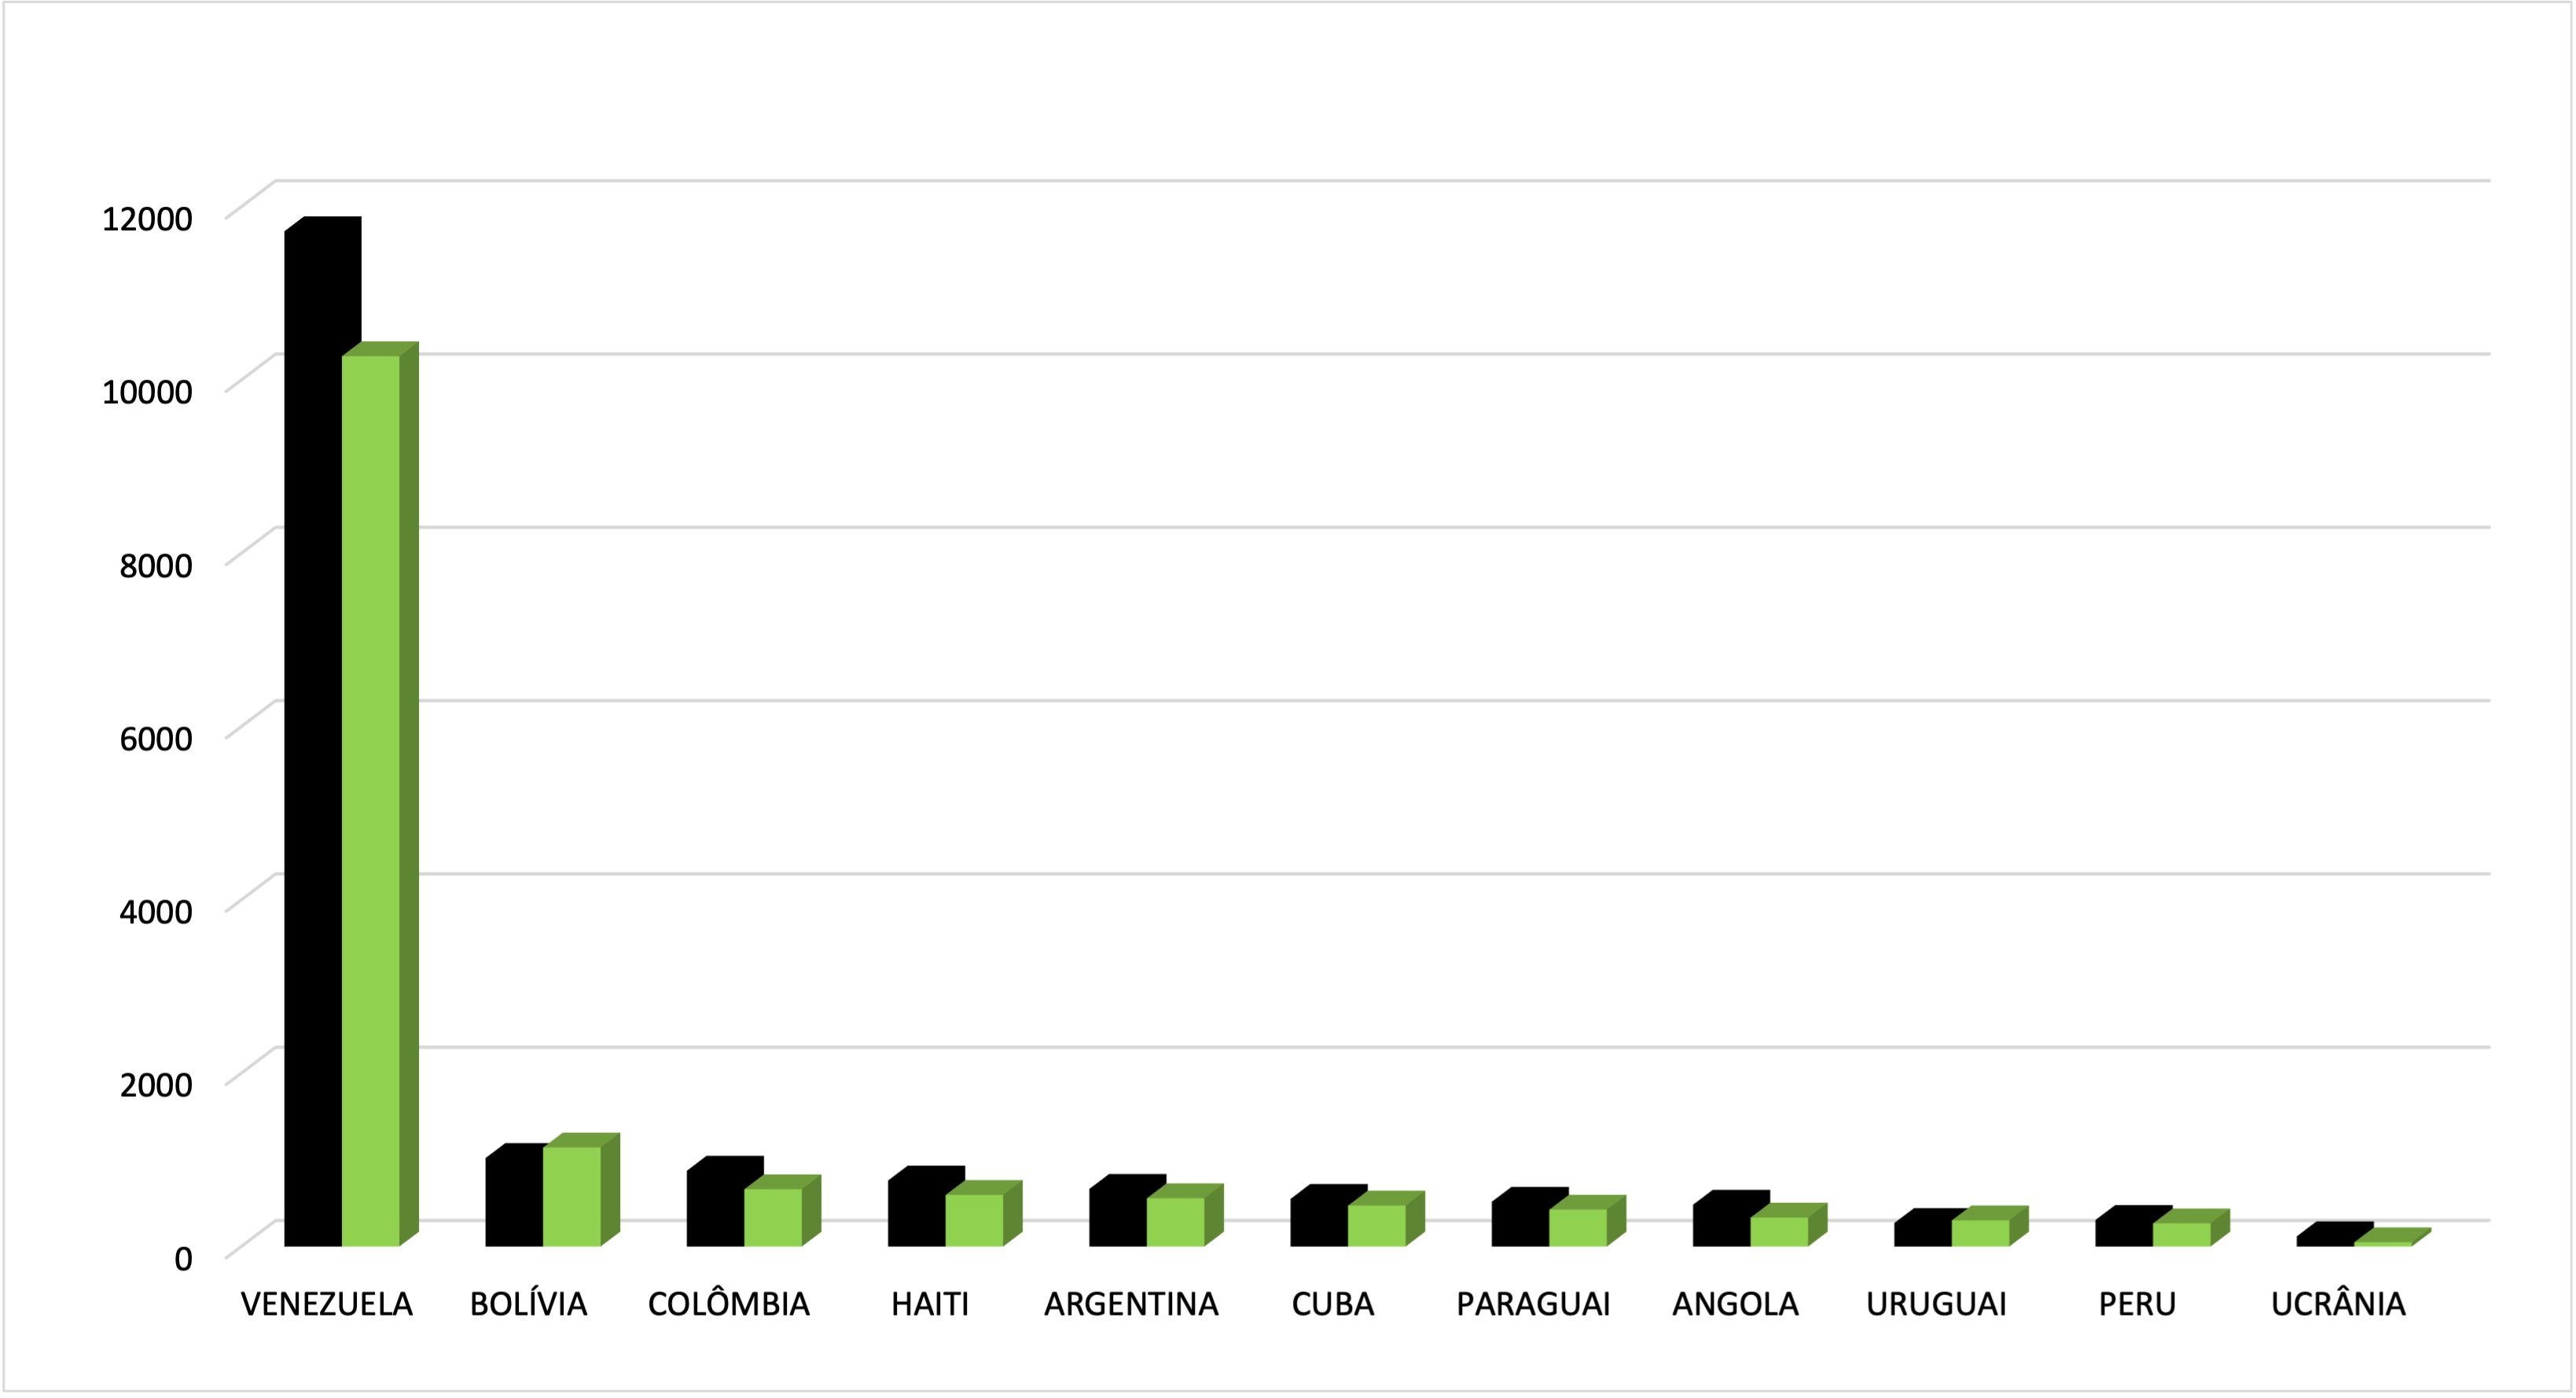
Source: OBMigra (June 2022), based on data from the Brazilian Federal Police, National Migration Registry System (SISMIGRA).
MAP 2
Number of immigrant registrations, according to main countries of birth - Brazil, June 2022.
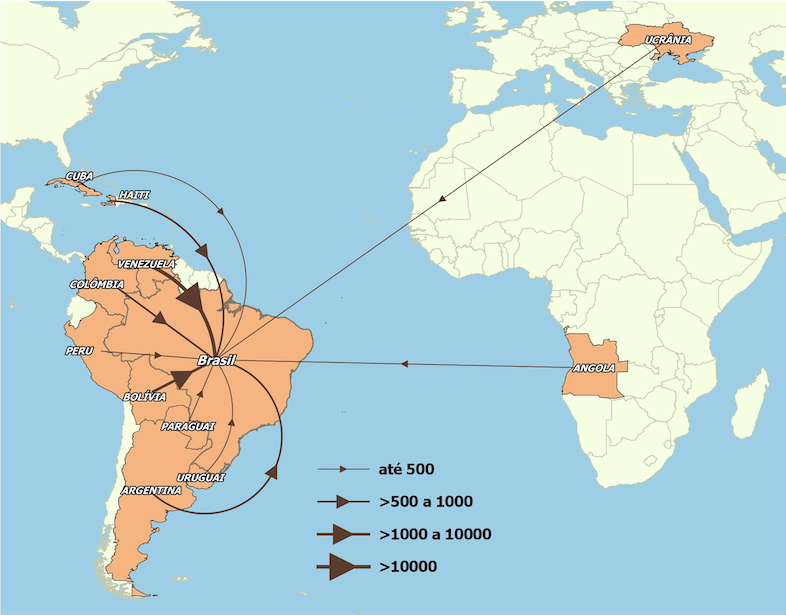
Fonte: Elaborado pelo OBMigra, a partir dos dados da Polícia Federal, Sistema de Registro Nacional Migratório (SISMIGRA), junho de 2022.
STI-MAR
STI-MAR (International Traffic System - Warning and Restrictions Module)
Applications for refugee status recognition saw a significant increase in June compared to the previous month (69.3%) and the same period in 2021 (488.0%), as depicted in Graph 10. This result was primarily driven by Venezuelan applicants, who showed a positive variation of 123.1% compared to May (Map 3). Comparison with the STI and SisMigra databases indicates that these applications were most likely made by individuals who were already present in the country.
As has been observed frequently, the number of applications for refugee status recognition for children and adolescents has surpassed those for other age groups (Graph 11). This characteristic is becoming a structural trend, which will require special attention from migration and public policy makers in general.
GRAPH 10
Number of applications for recognition of refugee status, by month of registration - Brazil, 2019-2022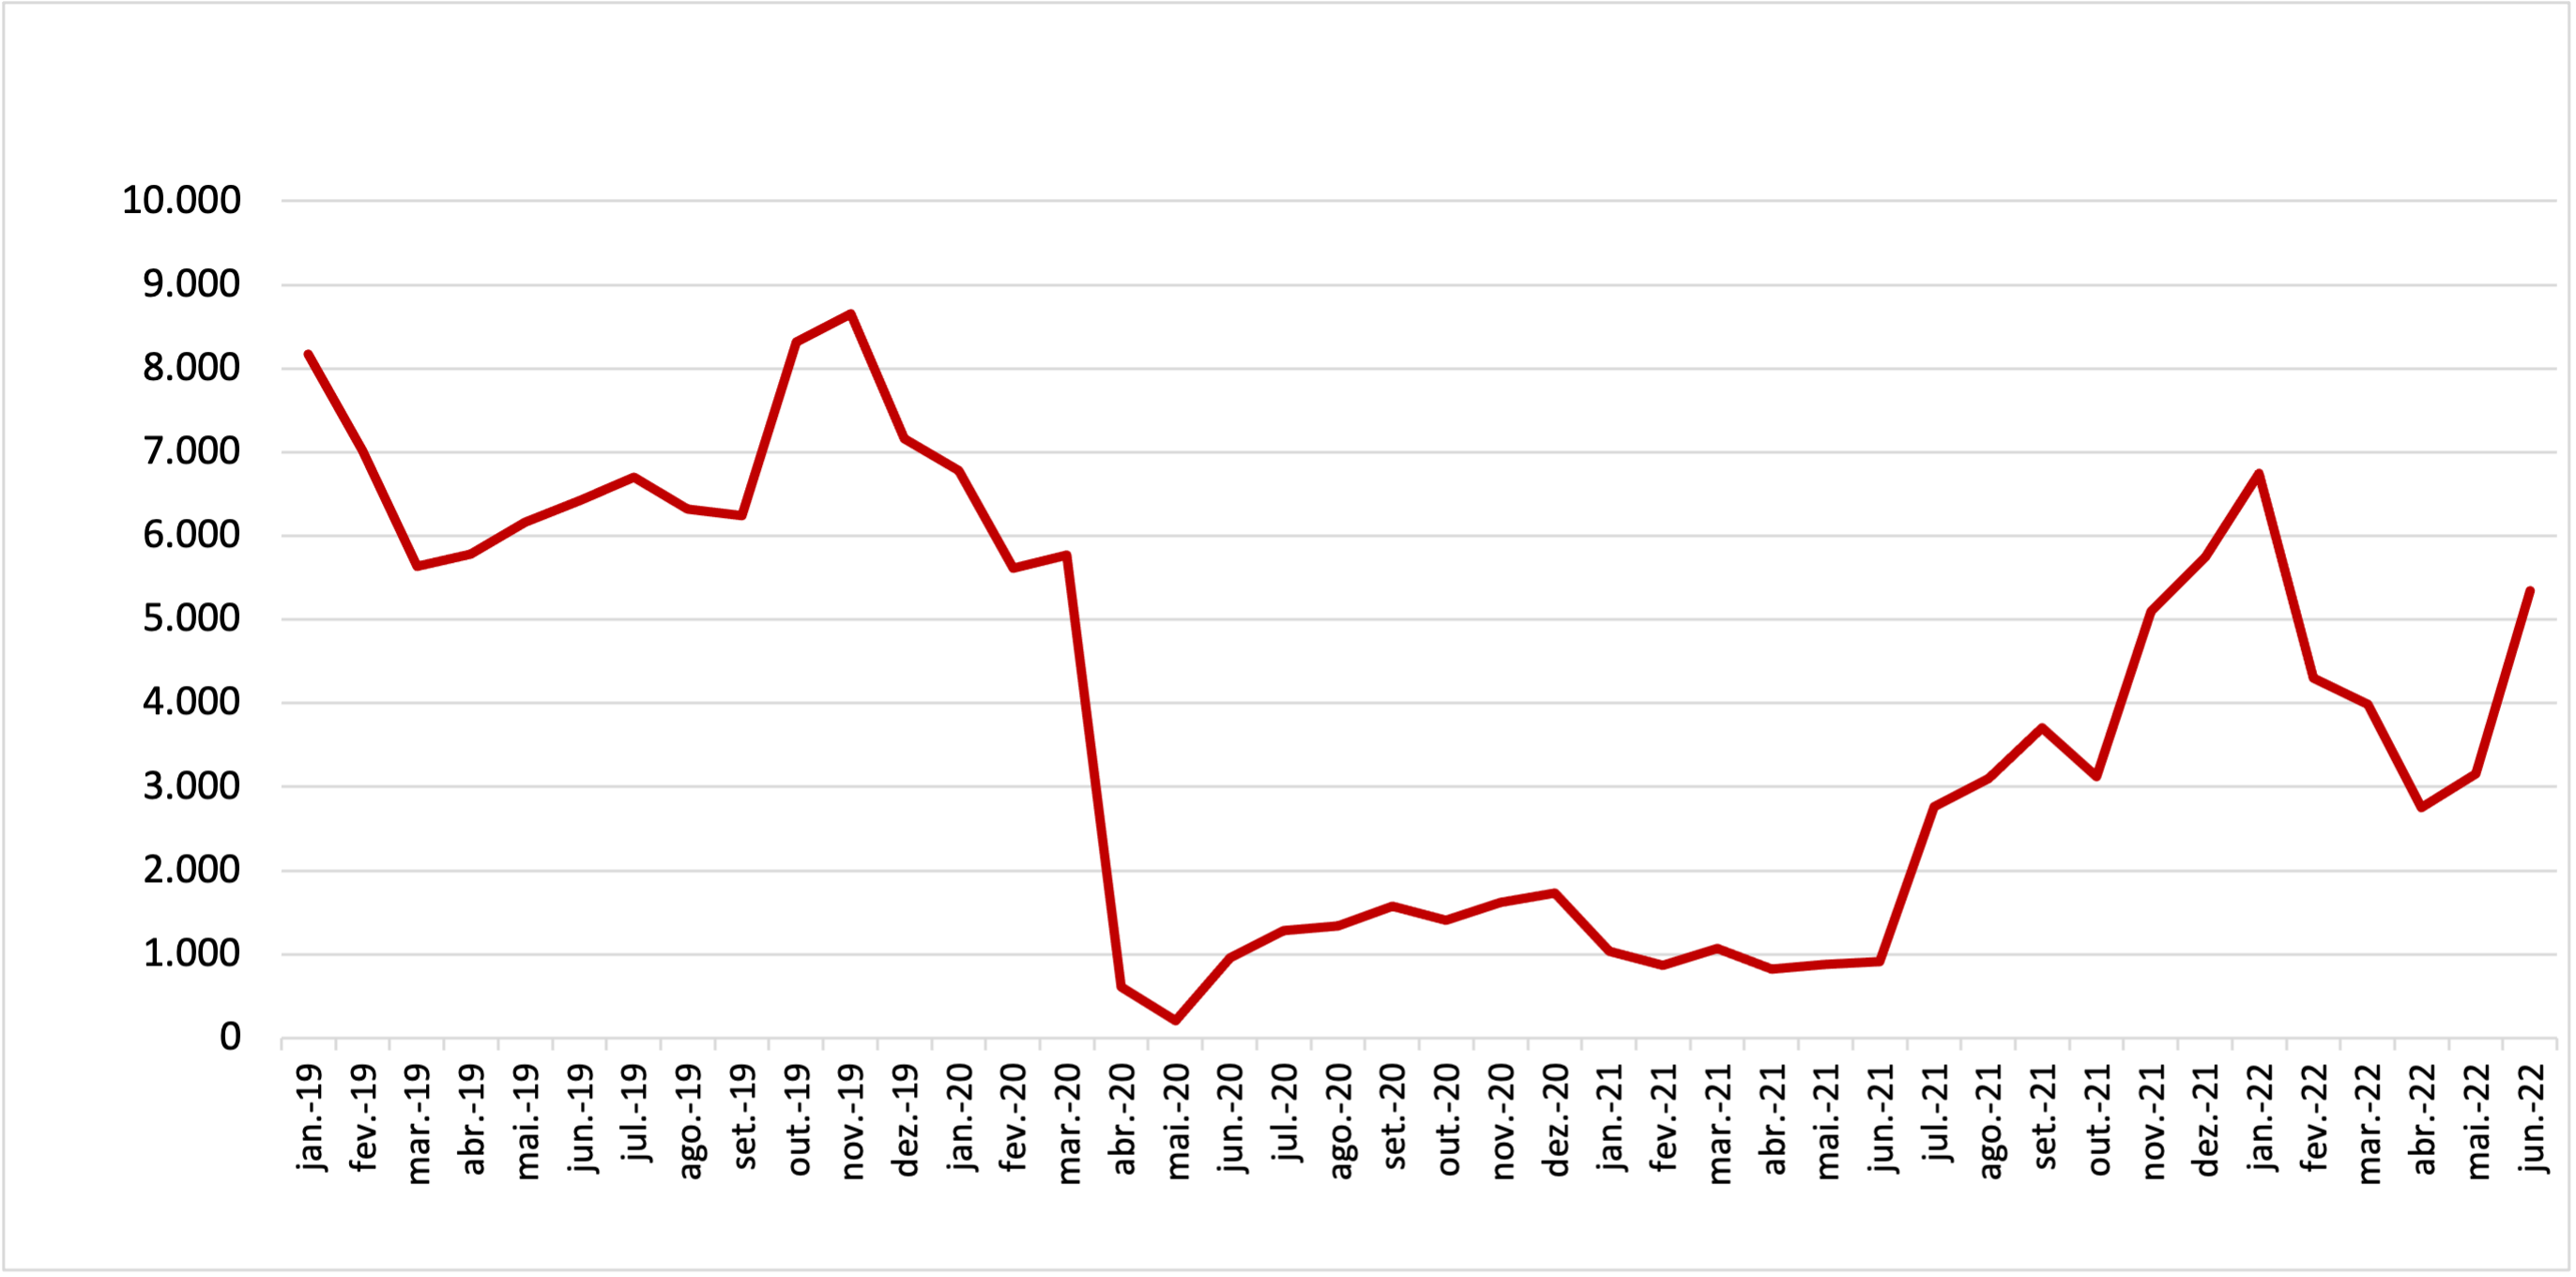
Source: OBMigra (April 2022), based on data from the Brazilian Federal Police, Asylum Claims.
GRAPH 11
Number of applications for recognition of refugee status, by month and age groups - Brazil, June 2022.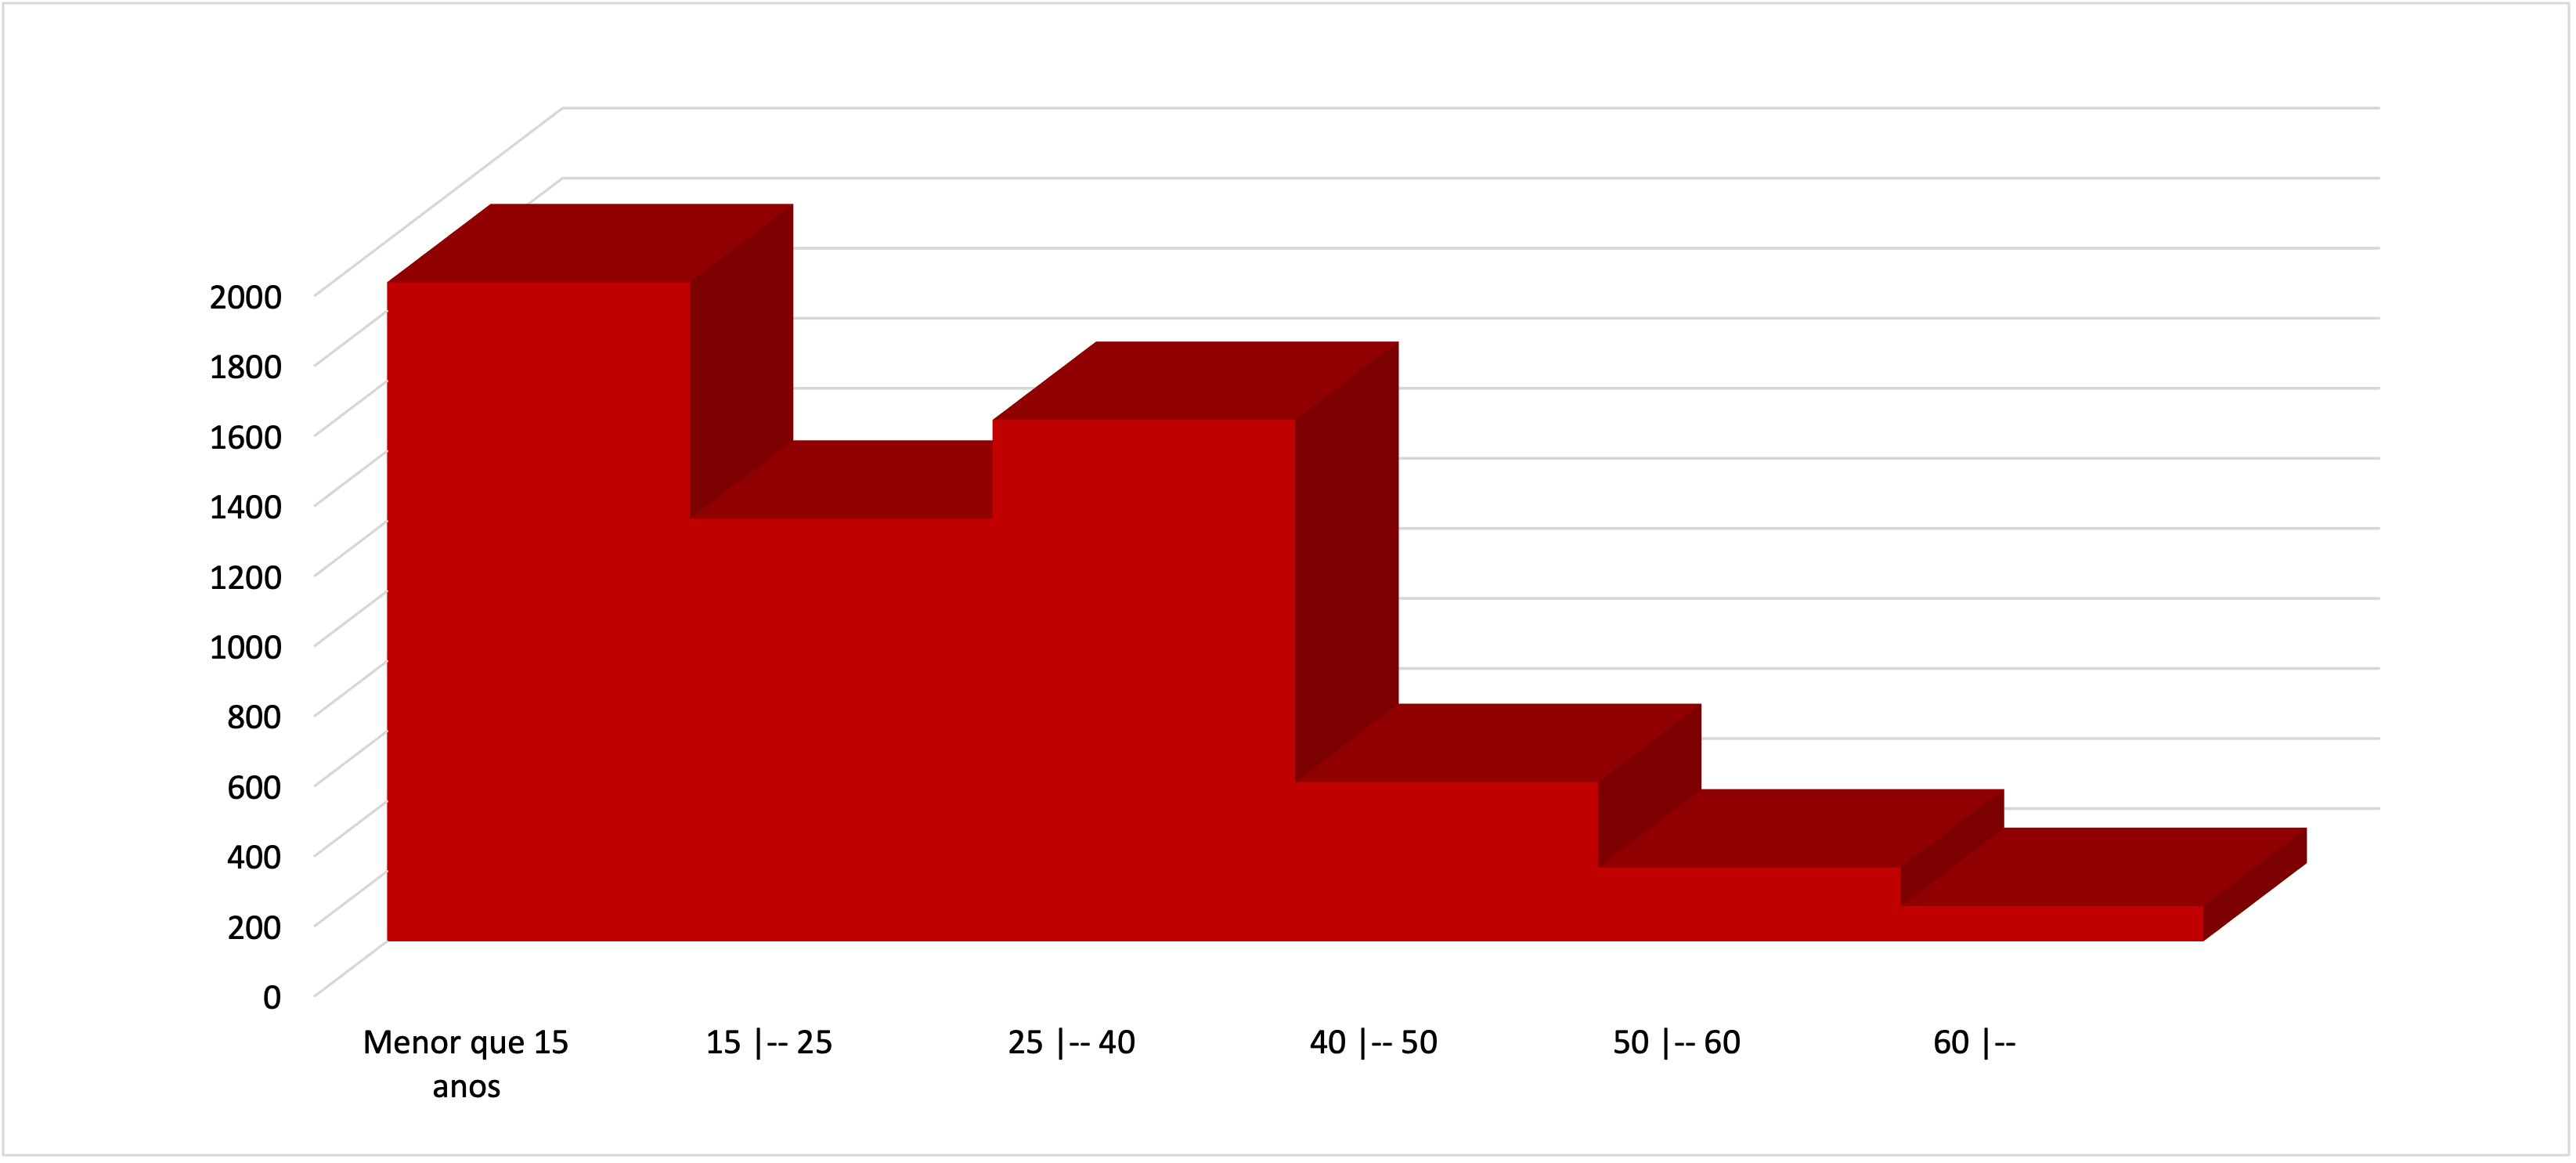
Source: OBMigra (June 2022), based on data from the Brazilian Federal Police, Asylum Claims.
MAP 3
Number of asylum claims, by main countries of nationality, June 2022
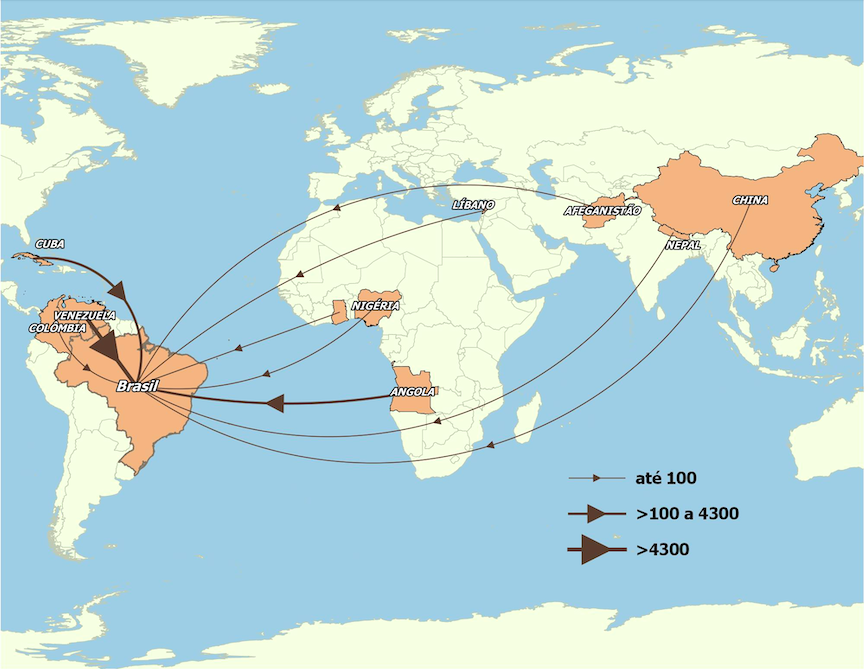
Source: OBMigra (June 2022), based on data from the Brazilian Federal Police, Asylum Claims.
COMO CITAR
The reproduction of this text and the data contained therein is permitted, provided that proper citation of the source is included. Reproduction for commercial use is prohibited.
How to cite this text:
| CAVALCANTI, L; OLIVEIRA, T; FURTADO, A; DICK, P; QUINTINO, F; GUIMARÃES, B. Acompanhamento de fluxo e empregabilidade dos imigrantes no Brasil: Relatório Mensal do OBMigra Ano 3, Número 6, junho de 2022/ Observatório das Migrações Internacionais; Brasília, DF: OBMigra, 2022. Disponível em: https://portaldeimigracao.mj.gov.br/pt/dados/relatorios-mensais |