CGIL
CGIL (General Coordination of Labor Immigration)
The number of resident permits for work and investment purposes experienced a a positive variation both comparisons with July 2022 (21.2%) and August 2021 (6.4%). The analysis of the historical series indicates ongoing stability in this particular type of administrative record (Graph 1).
The positive outcome for the month was primarily attributed to the granted authorizations for labor purposes in the Southeast Region (Graph 2).
Among skilled workers, Chinese received the most permits (Graph 3).
GRAPH 1
Number of work permits for labor and investment purposes, by month of registration - Brazil, 2019-2022
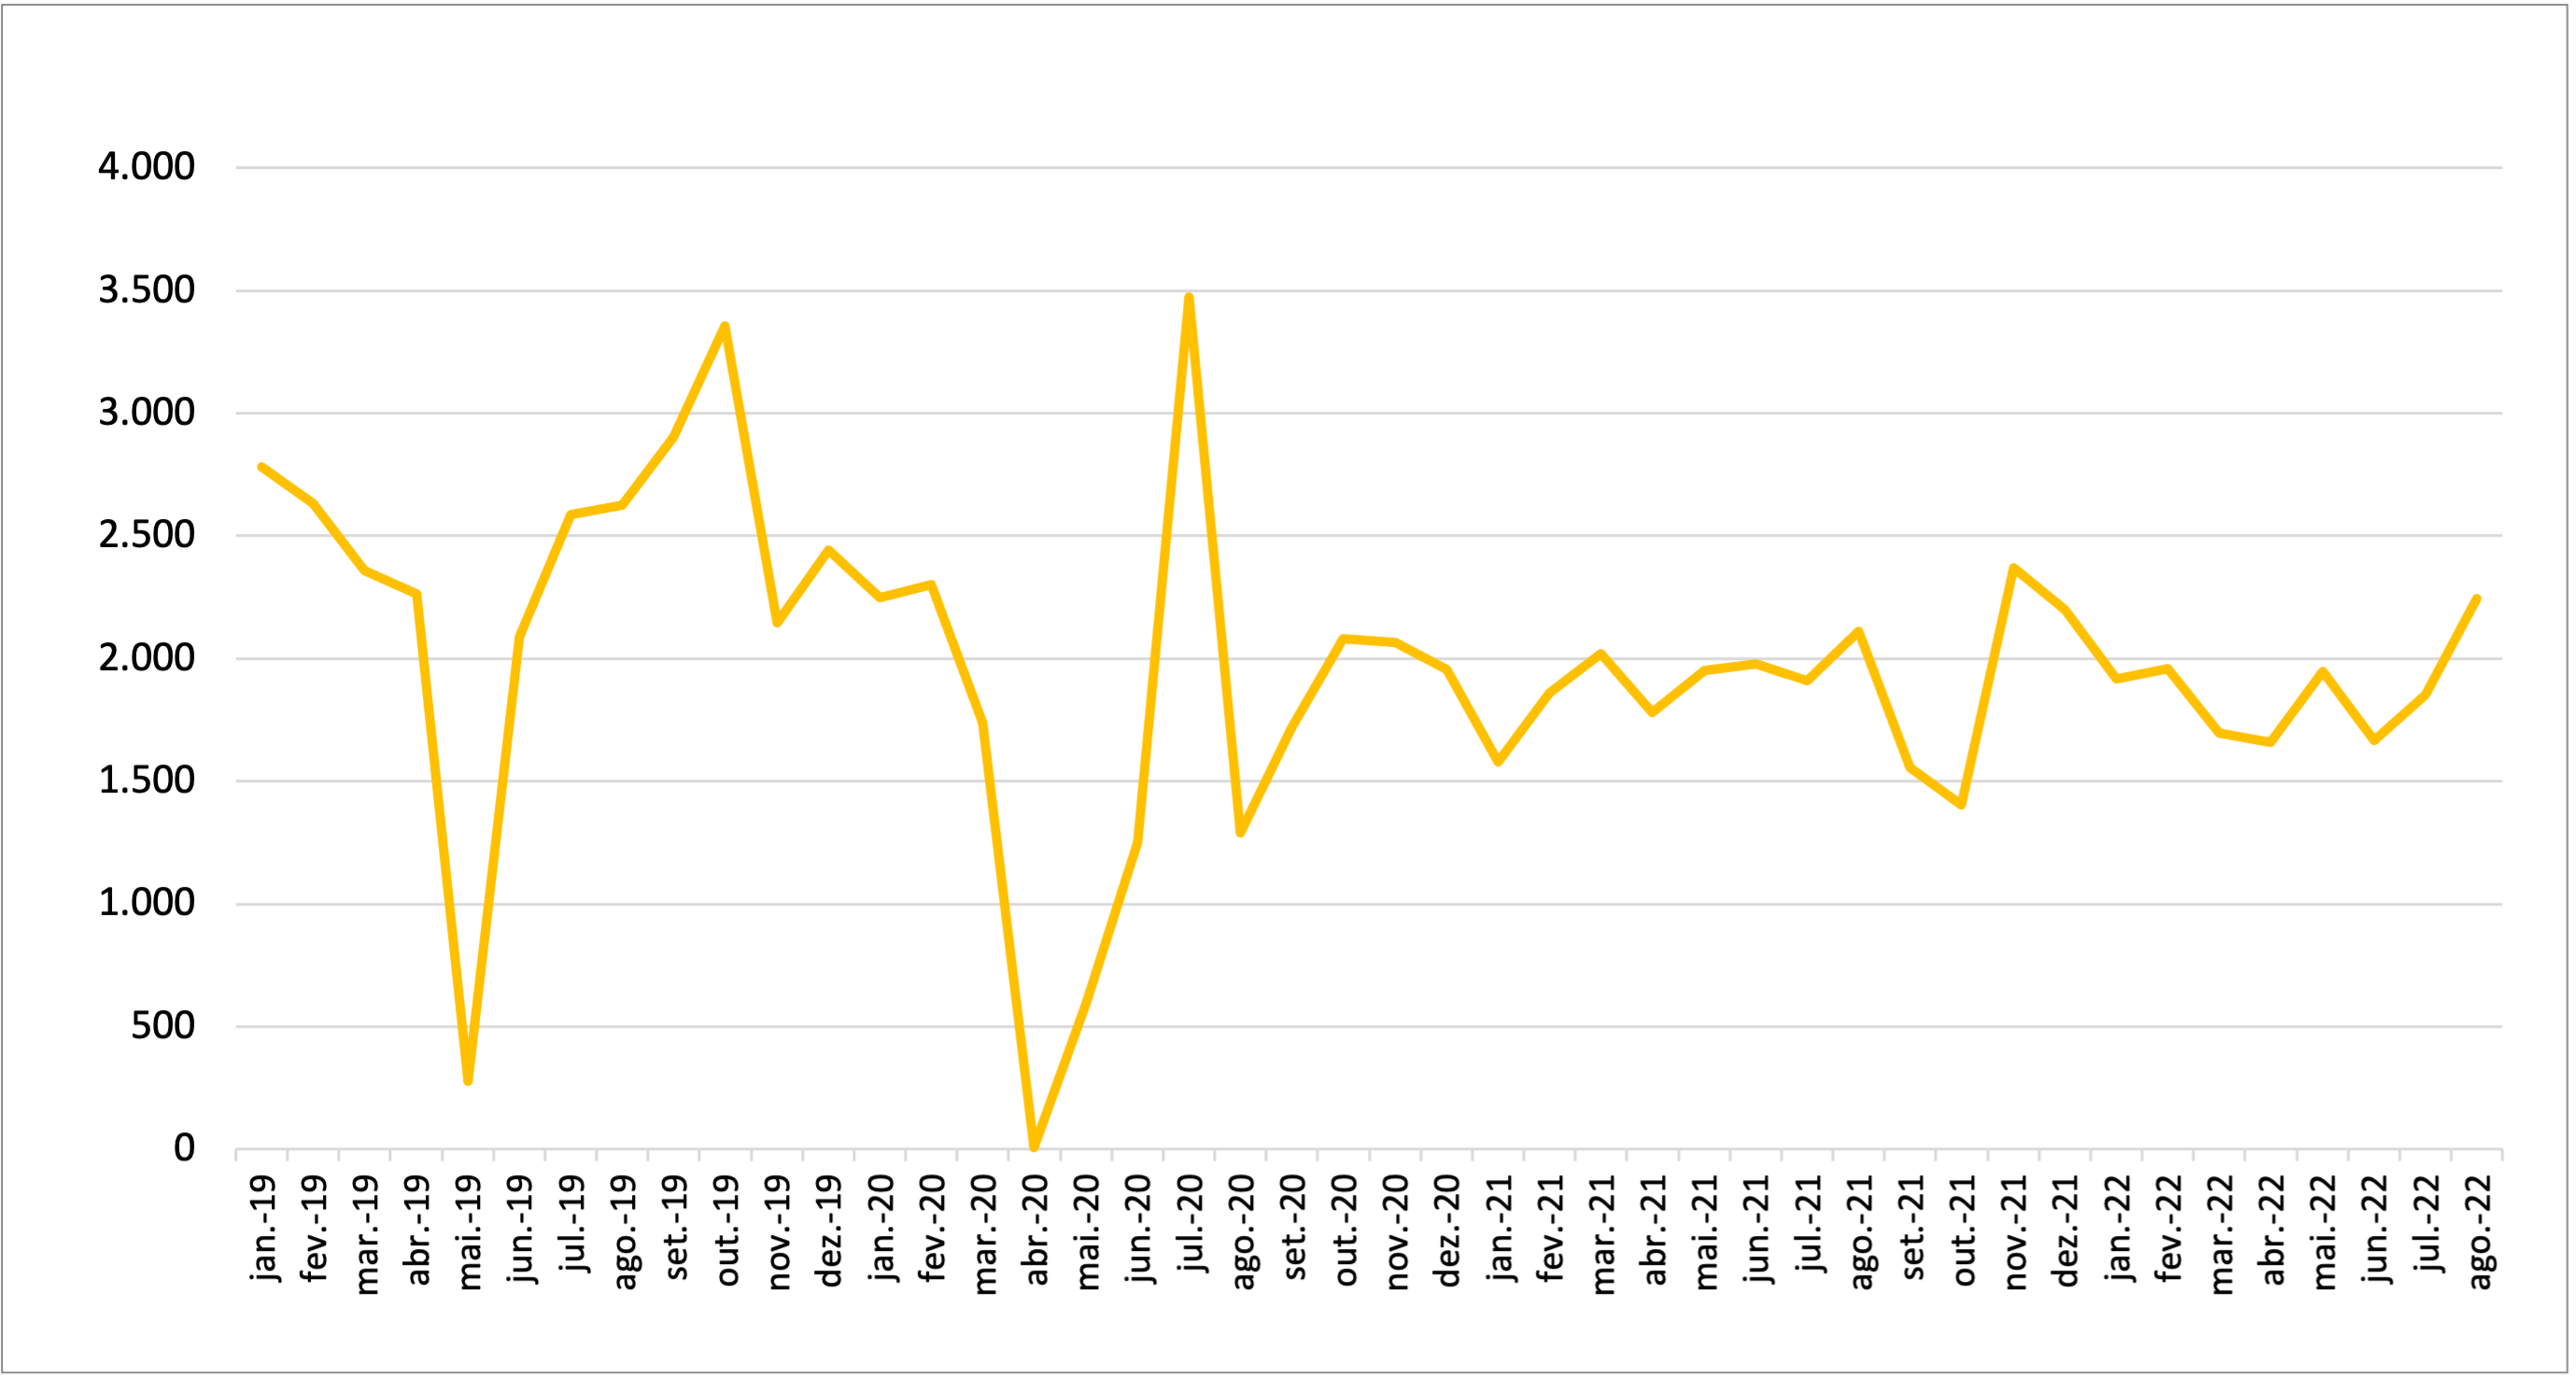
Source: OBMigra (2022), based on data from the General Coordination of Labor Immigration (CGIL).
GRAPH 2
Number of permits granted, by month, according to Regions - Brazil, July and August 2022

Source: General Coordination of Labor Immigration / Ministry of Justice and Public Security, August 2022
GRAPH 3
Number of permits granted to skilled workers, by main countries of birth - Brazil, August 2022

Source: General Coordination of Labor Immigration / Ministry of Justice and Public Security, August 2022
CTPS/RAIS/NOVO CAGED
Harmonized database Work and Social Security Card (CTPS)/Annual Report of Social Information (RAIS)/New General Register of Employed and Unemployed Persons (CAGED)
In July, the creation of jobs for immigrants experienced a slight negative oscillation, despite the movement of a larger volume of workers and the creation of vacancies (Graph 4).
The largest number of jobs was generated for production line feeders (Graph 5).
It has become a structural pattern that the states in the Southern Region are the ones that predominantly attract immigrant workers and generate employment opportunities in the formal market (Map 1).
GRAPH 4
Jobs created for immigrants in the formal labor market, by month - Brazil, 2019/2022
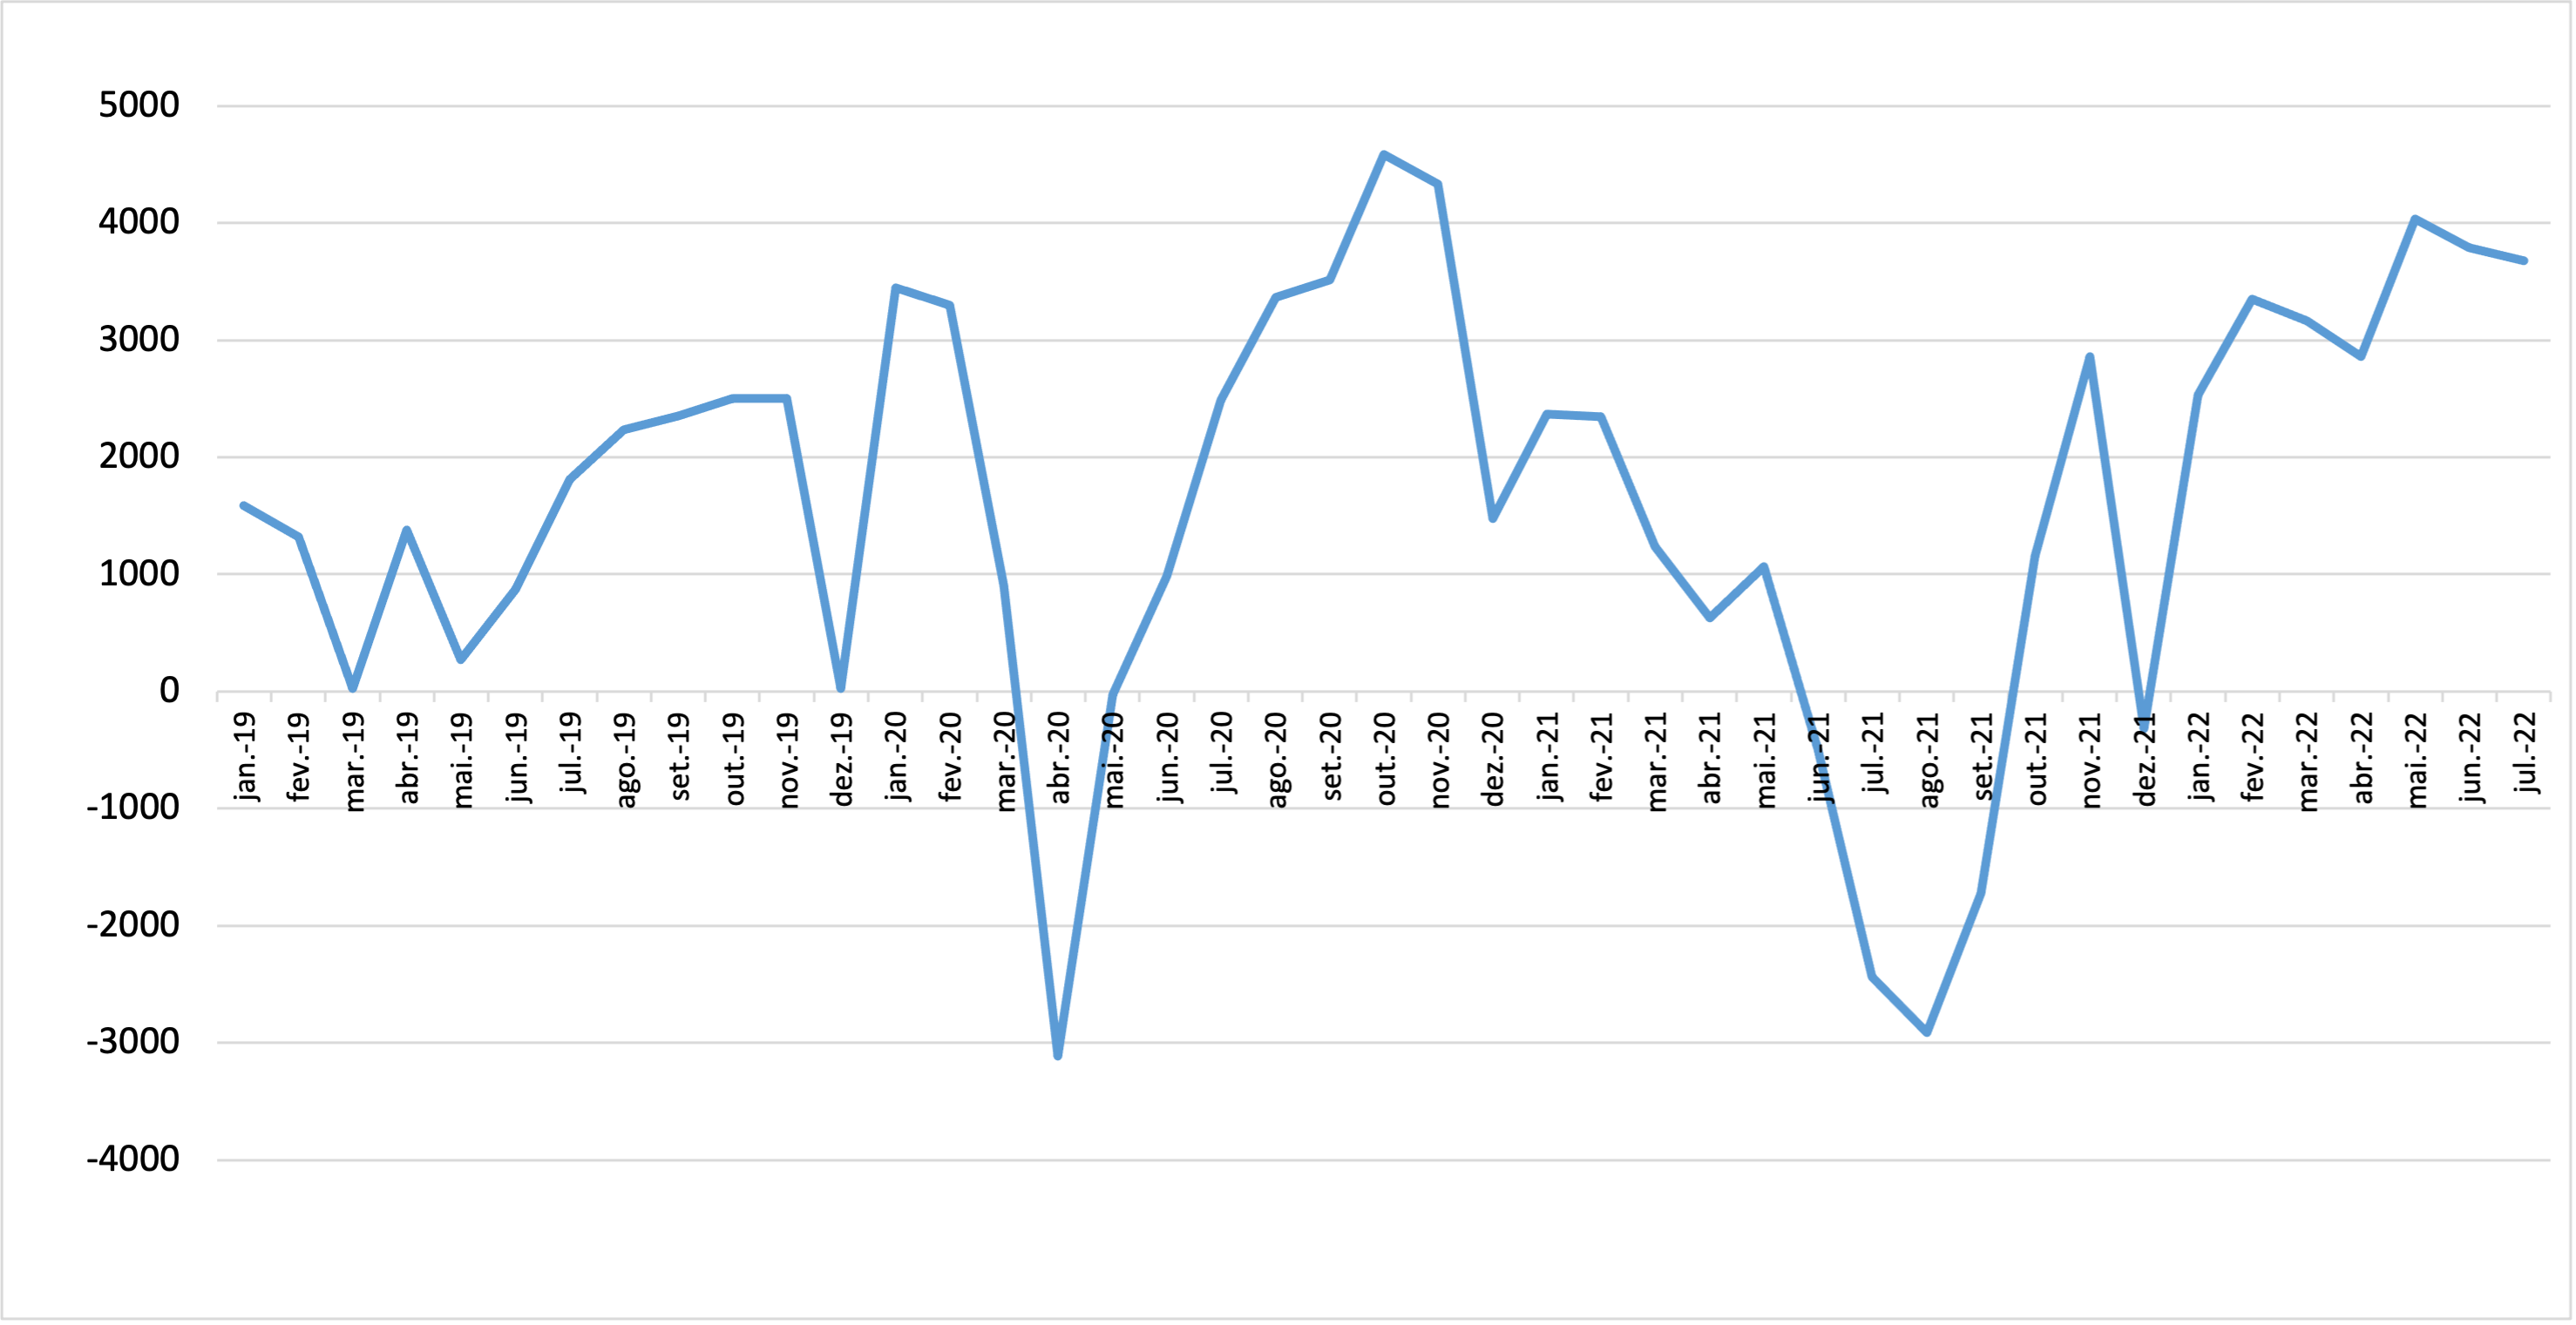
Source: OBMigra (2022), based on data from the harmonized database RAIS-CTPS-CAGED and the Digital System of Tax, Social Security and Labor Obligations (eSocial).
GRAPH 5
Job positions created for migrants in the formal labor market, according to main occupations - Brazil, July 2022
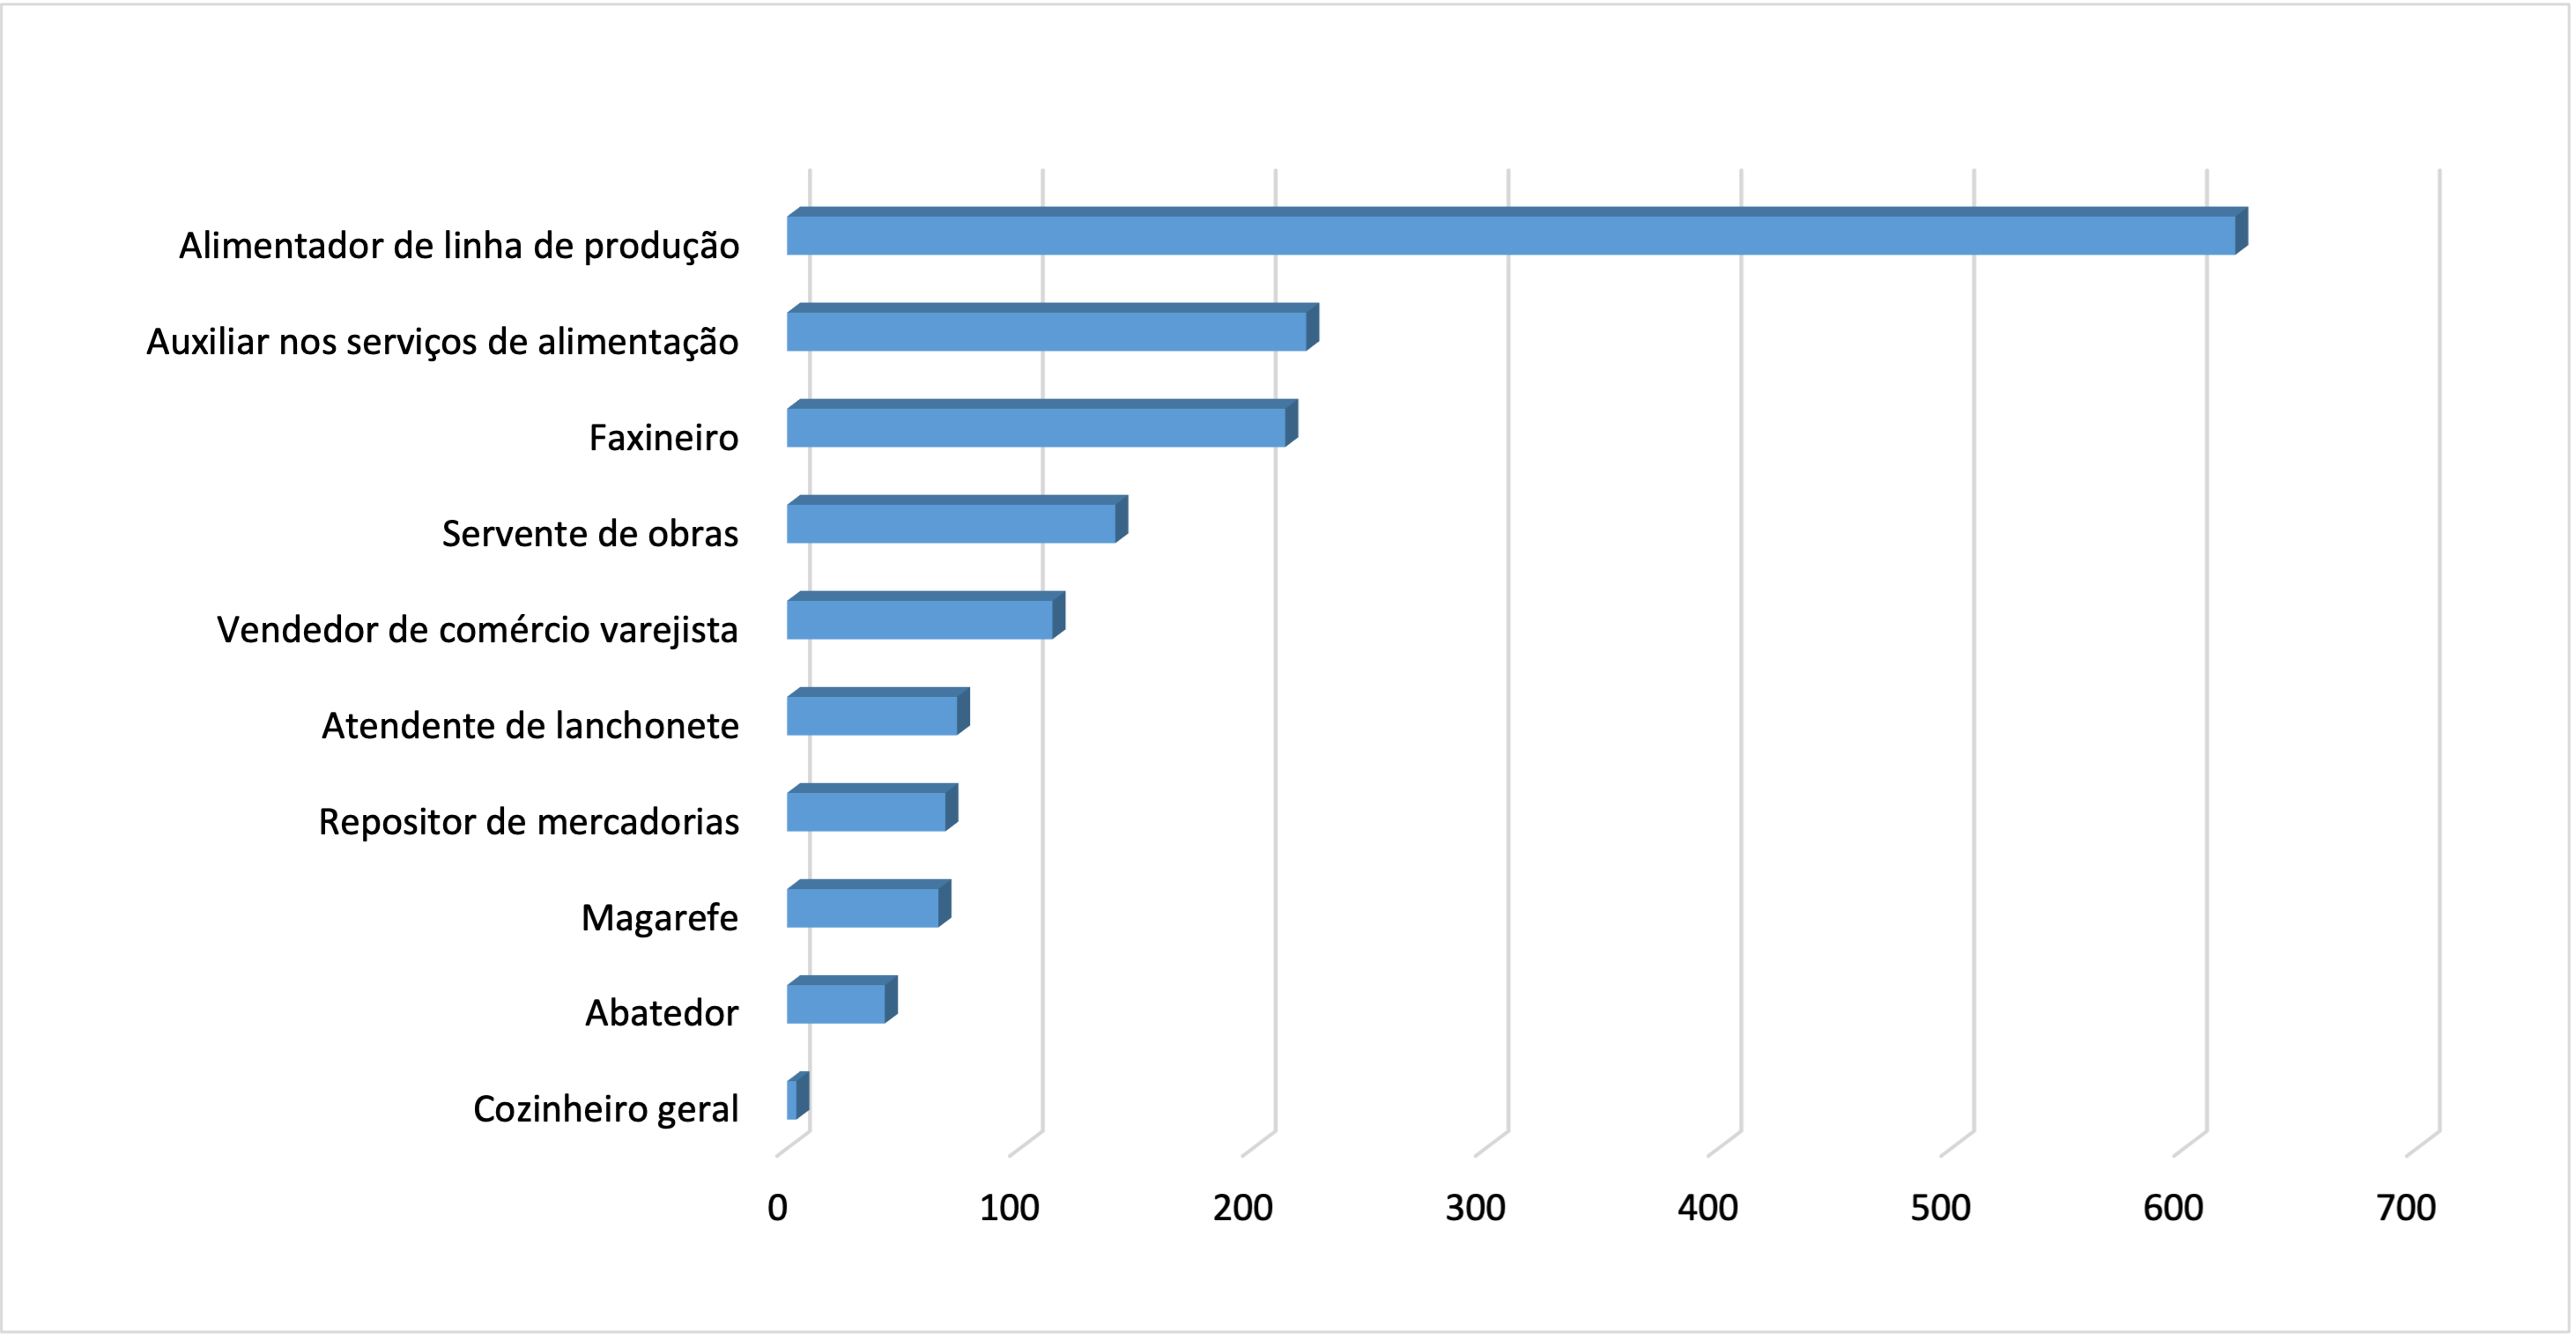
Source: OBMigra (July 2022), based on data from the Ministry of Economy, Harmonized database RAIS-CTPS-CAGED
MAP 1
Number of jobs created, according to Regions, July 2022
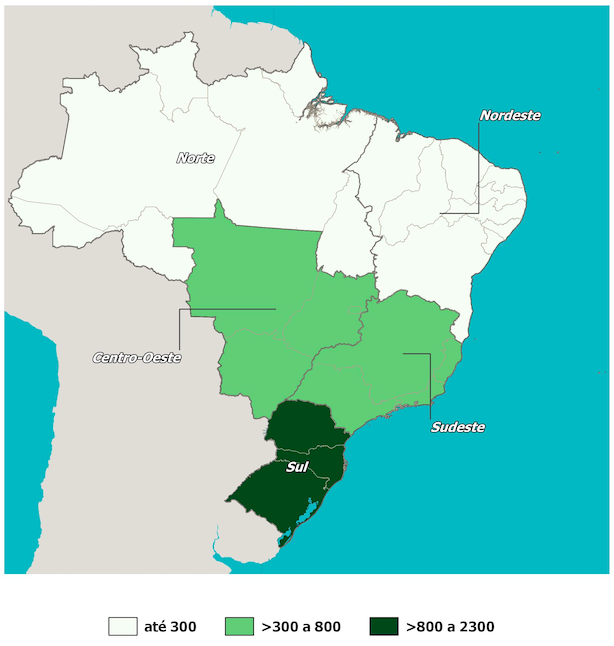
Source: OBMigra (July 2022), based on data from the Ministry of Economy, Harmonized database RAIS-CTPS-CAGED
STI
STI (International Traffic System)
The cross-border movements of people across Brazilian borders are still suffering from the consequences of the COVID-19 pandemic. In August the volume oscillated slightly downward, as can be seen in Graph 6.
In August, the balance of cross-border entries and exits remained negative, primarily influenced by the movements of Brazilians and tourists (Graph 7).
GRAPH 6
Cross-border movements, by month of registration, Brazil 2019/2022
Source: OBMigra (2022), based on data from the Brazilian Federal Police, International Traffic System (STI).
GRAPH 7
Cross-border movements of people, according to typology - Brazil, August 2022
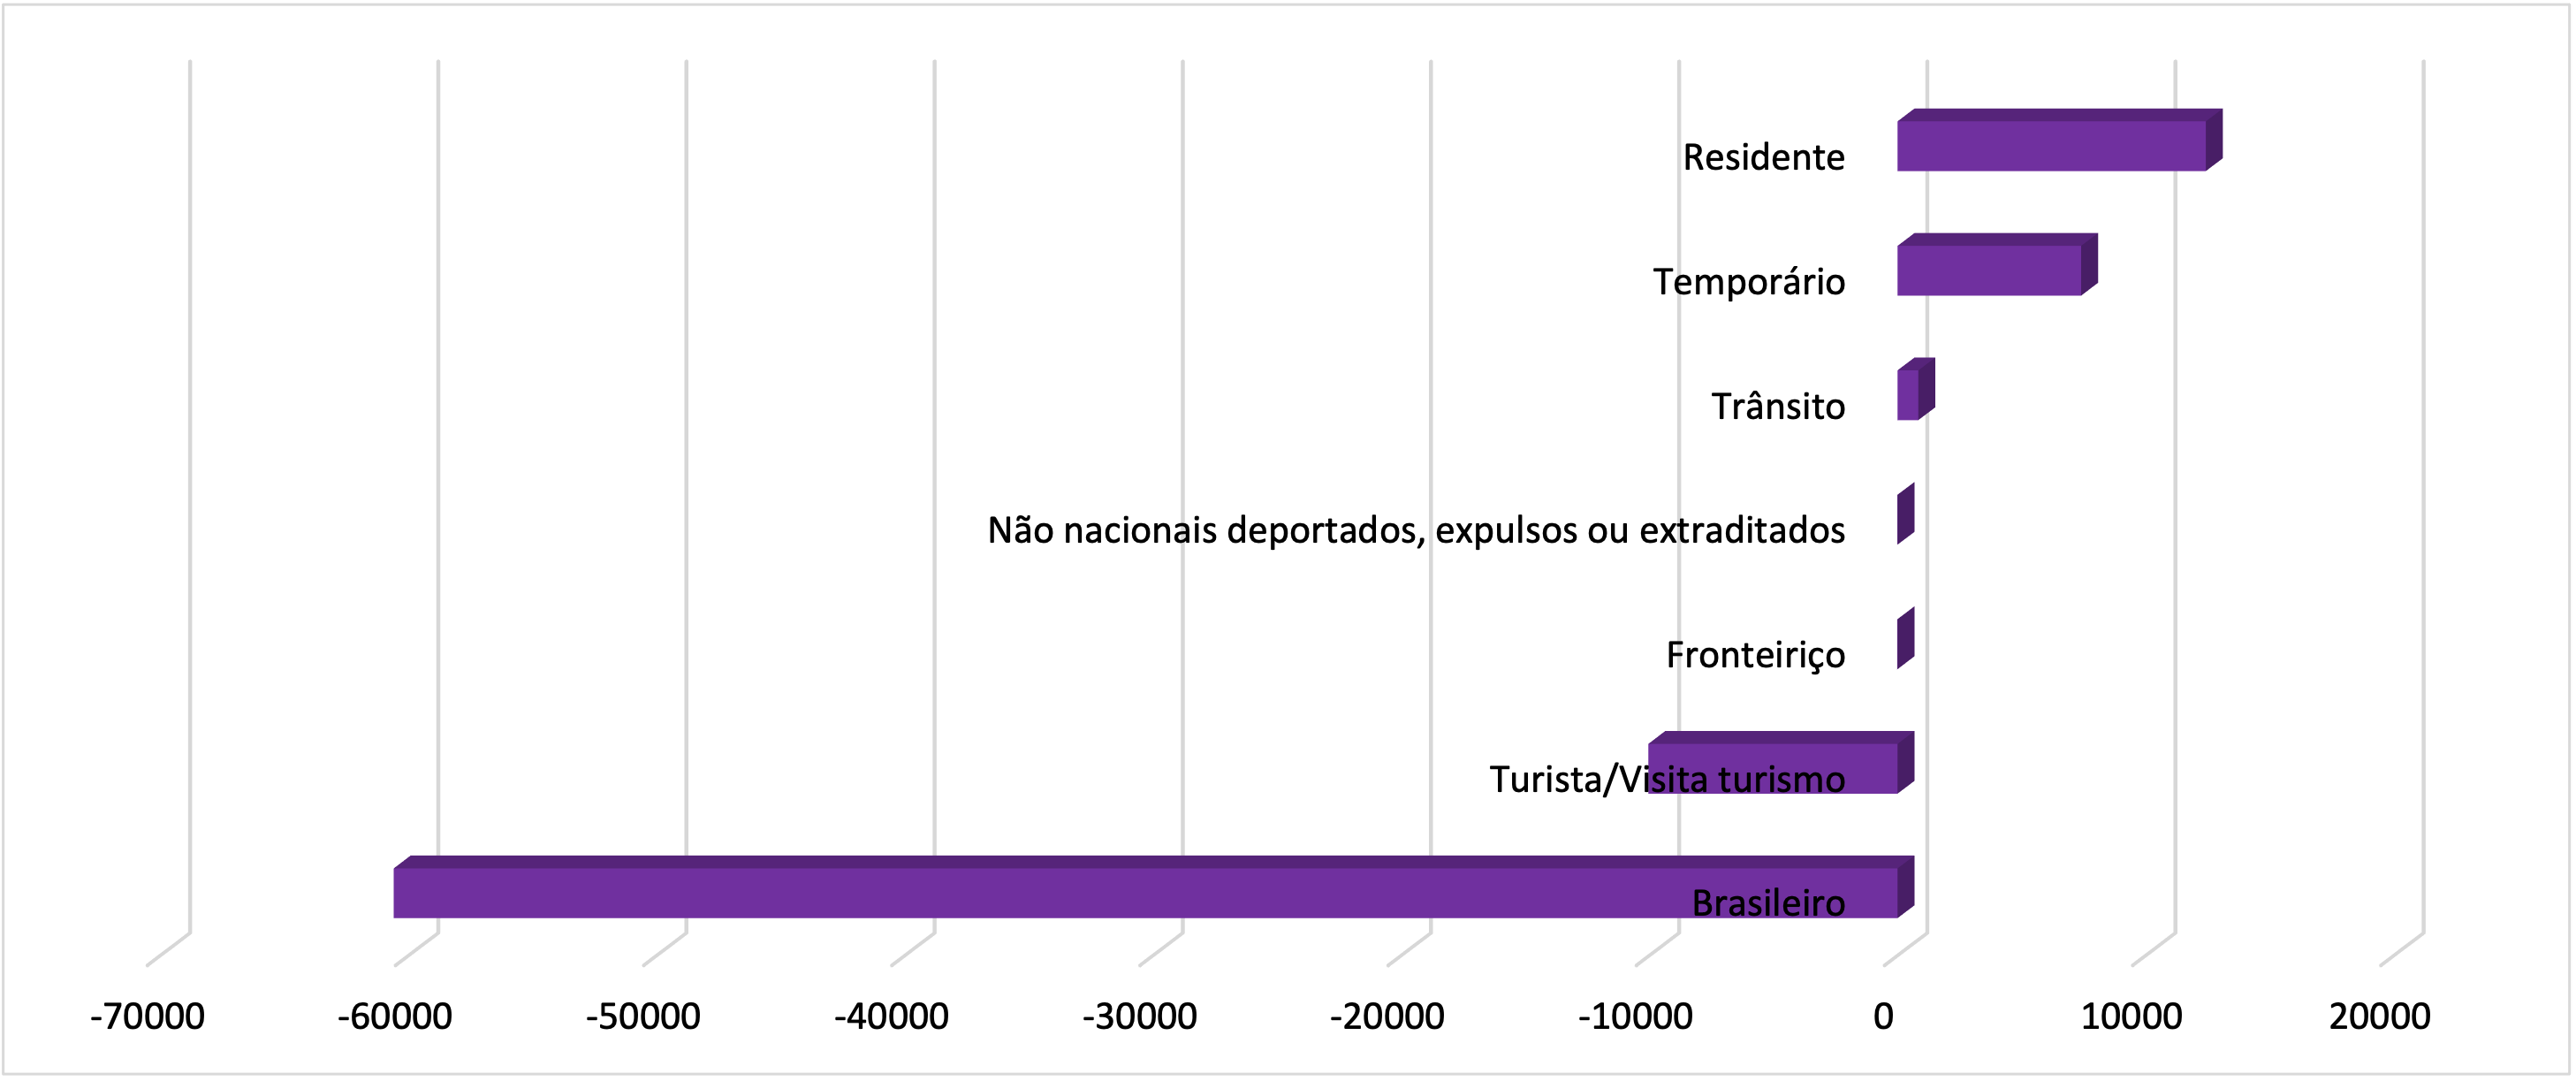
Source: OBMigra (August 2022), based on data from the Brazilian Federal Police, International Traffic System (STI)
SISMIGRA
SisMigra (National Migration Registry System)
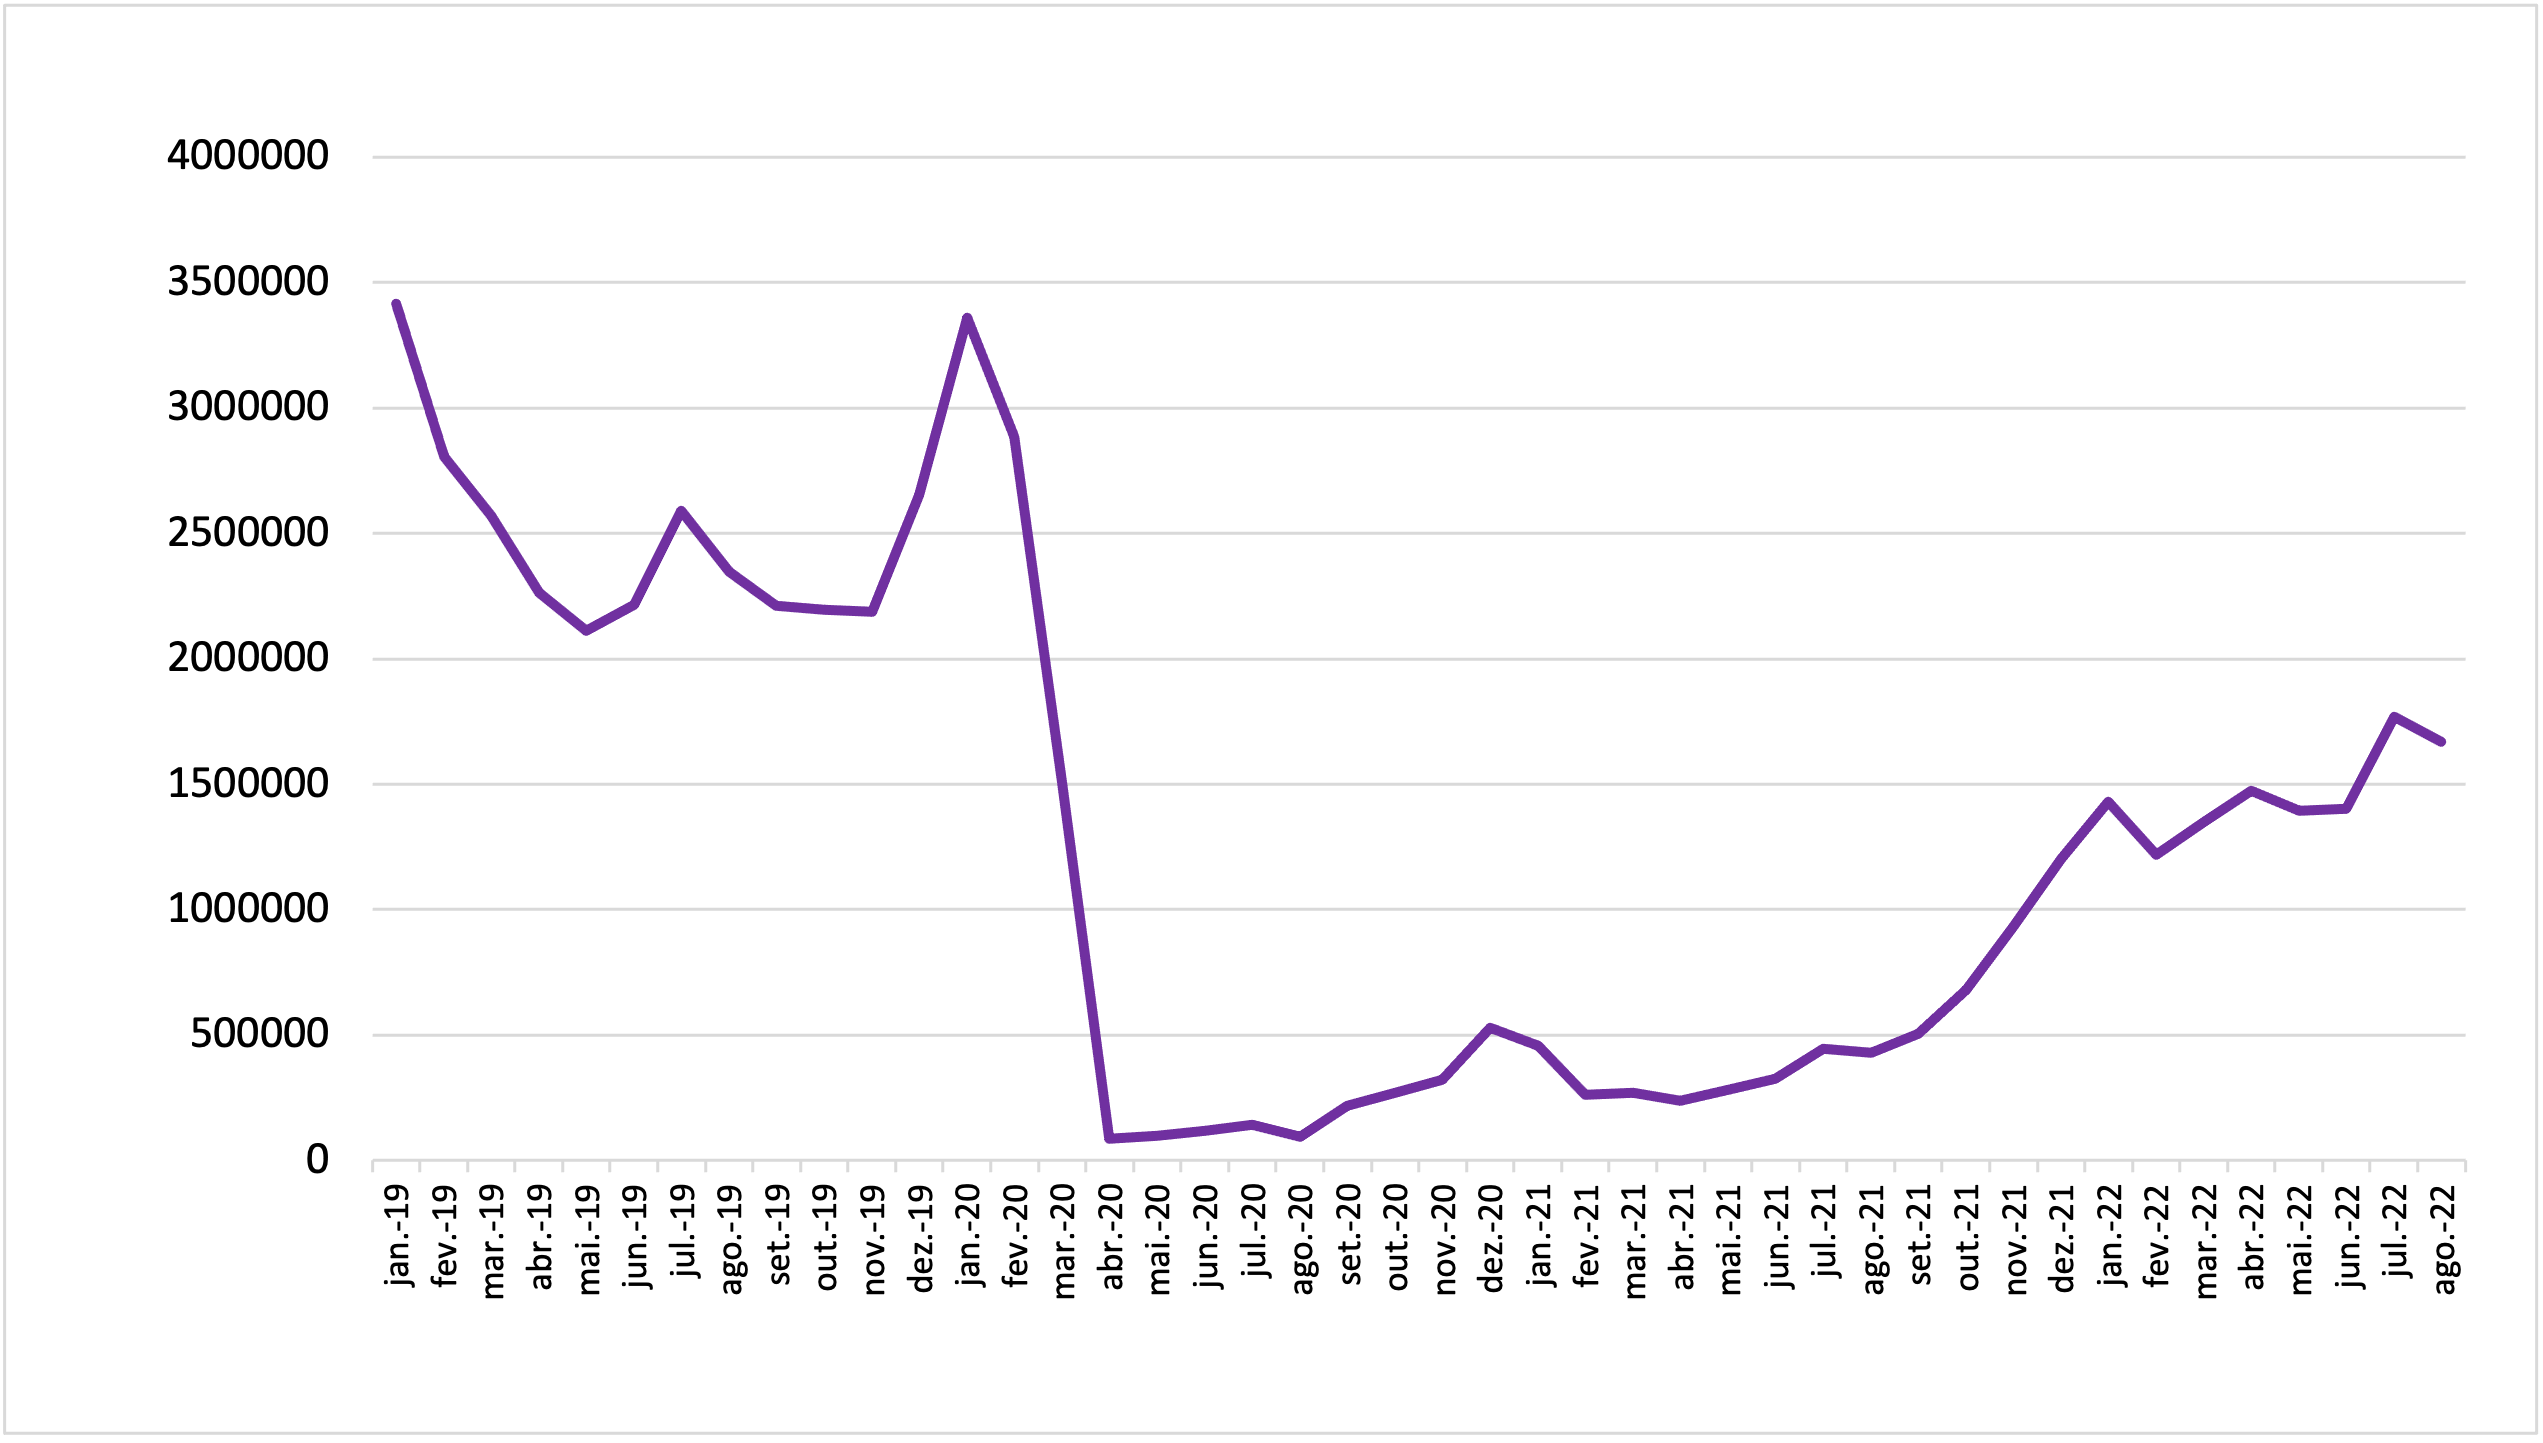
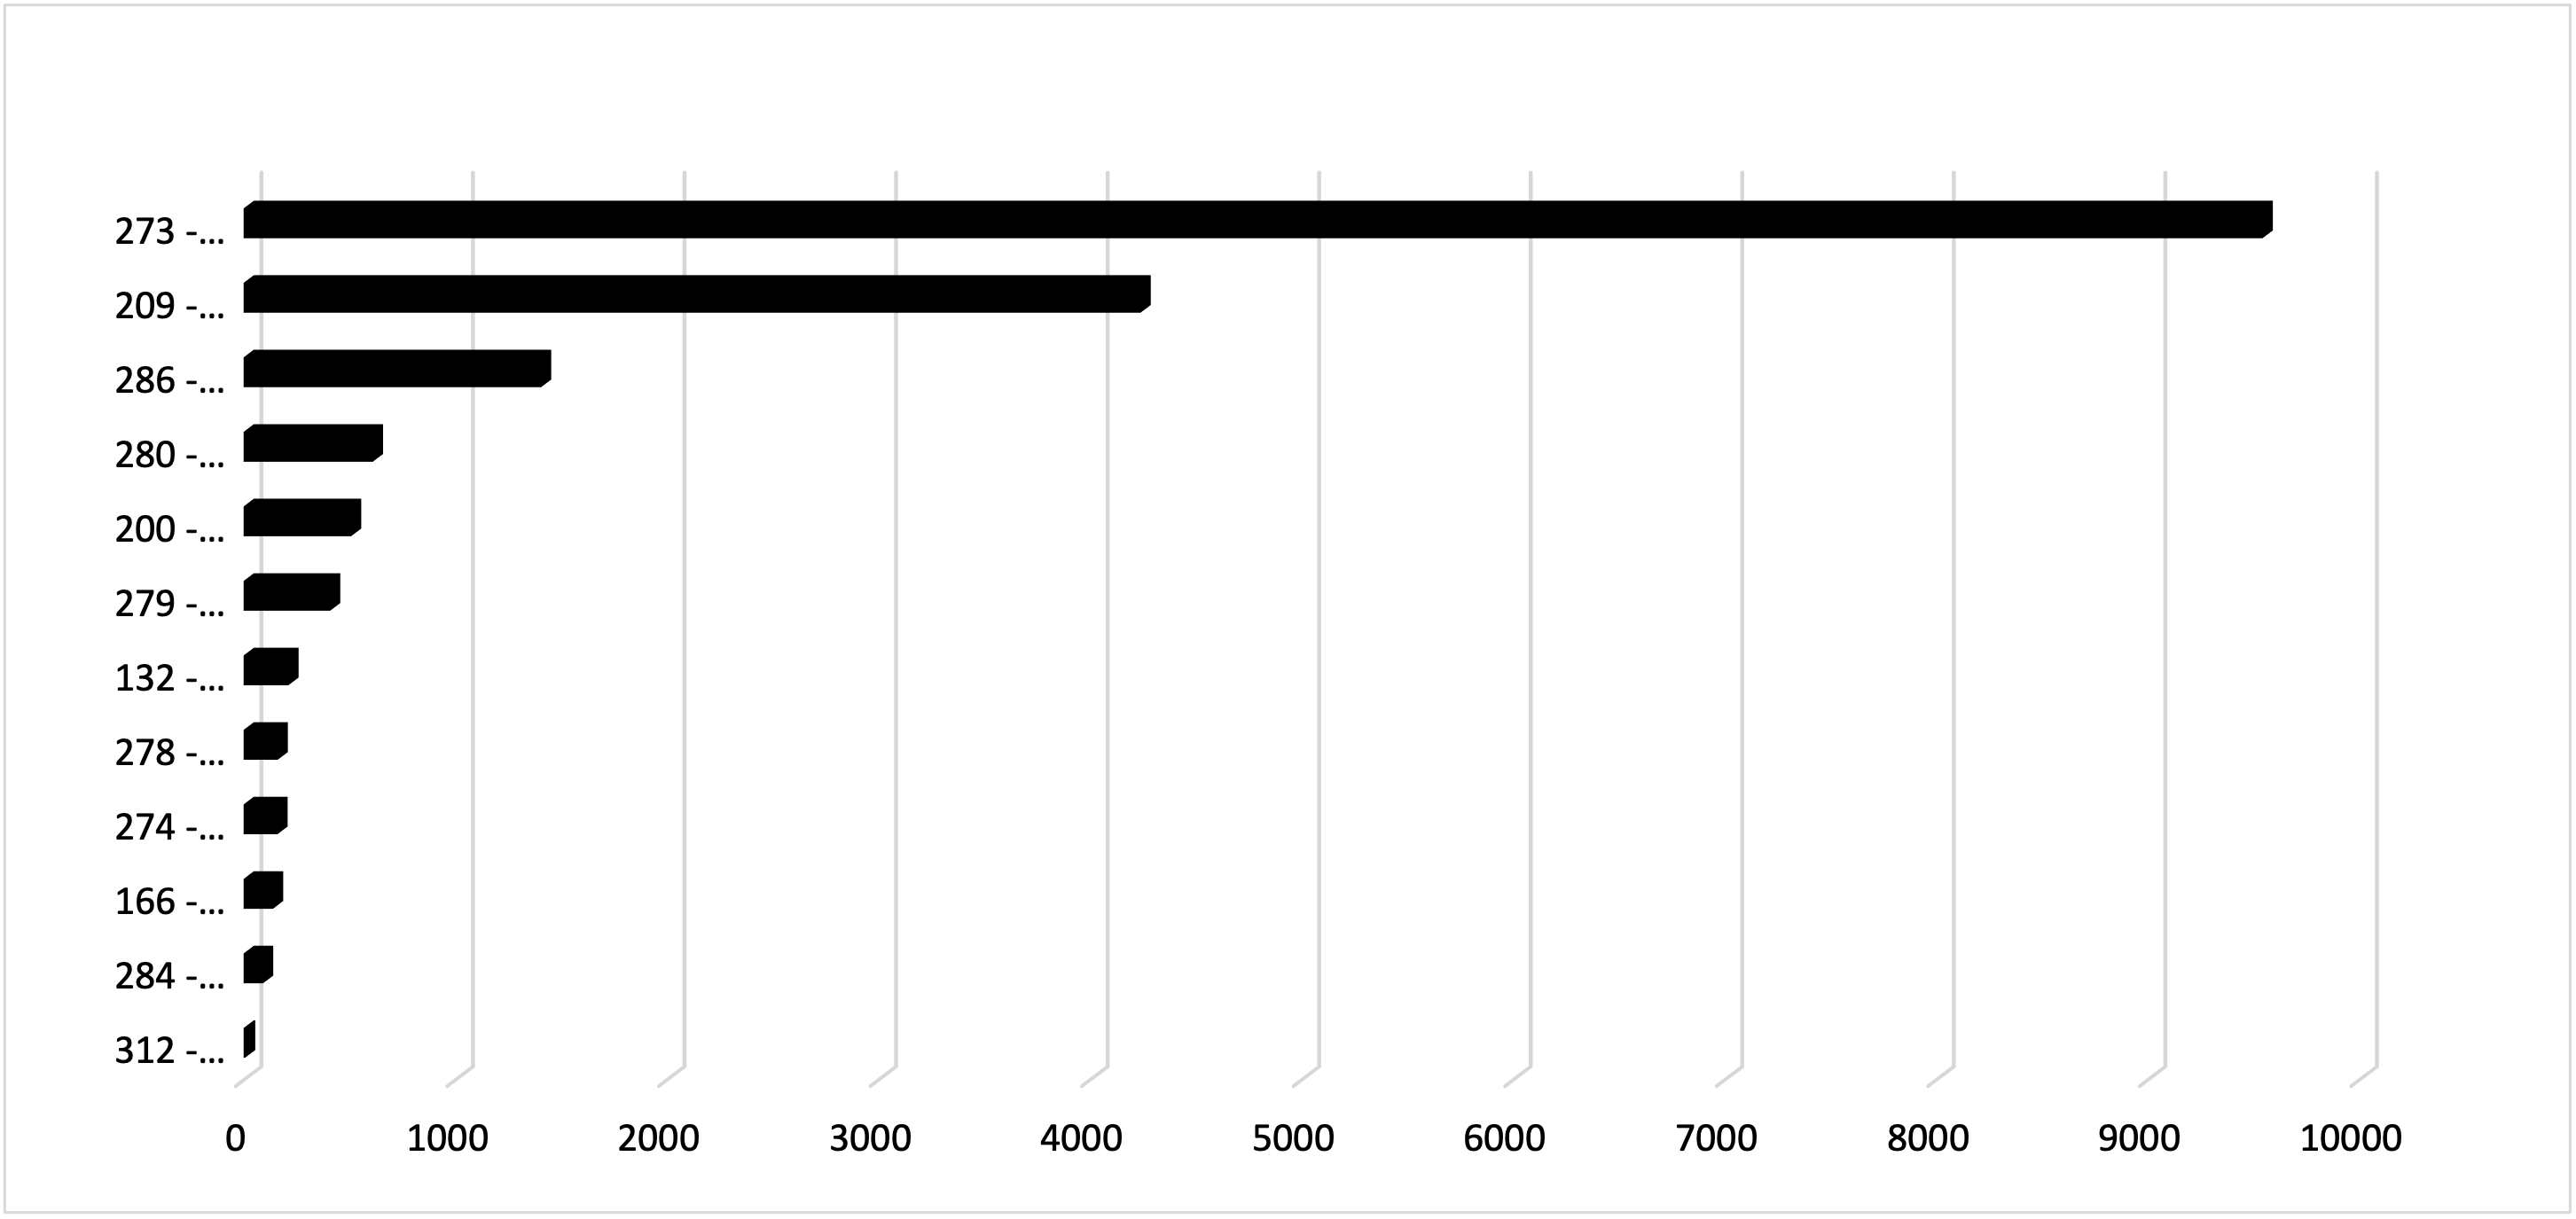
August marked the highest number of residence applications in the entire historical series, which began in January 2019, as depicted in Graph 8.
Although it ranks fourth among the most utilized eligibility criteria, as depicted in Graph 9, the residence permit for education (280) experienced a significant increase compared to the previous month, more than doubling its numbers, and nearly tripling compared to August 2019. This criterion is surpassed only by the granting of residence for Venezuelans (273), the Mercosur Agreement (209), and family reunification (286).
Map 2 shows that Venezuelans continue to be the main nationality for obtaining residence permits, followed at a distance by Bolivians.
GRAPH 8
Number of immigrant registrations, by month of registration - Brazil, 2019/2022
Source: OBMigra (2022), based on data from the Brazilian Federal Police, National Migration Registry System (SISMIGRA).
GRAPH 9
Total number of registrations, by month of registration, according to eligibility grounds, Brazil, August 2022
Source: OBMigra (August 2022), based on data from the Brazilian Federal Police, National Migration Registry System (SISMIGRA).
MAP 2
Number of immigrant registrations, by main countries of birth, August 2022
Source: OBMigra (August 2022), based on data from the Brazilian Federal Police, National Migration Registry System (SISMIGRA).
STI-MAR
STI-MAR (International Traffic System - Warning and Restrictions Module)
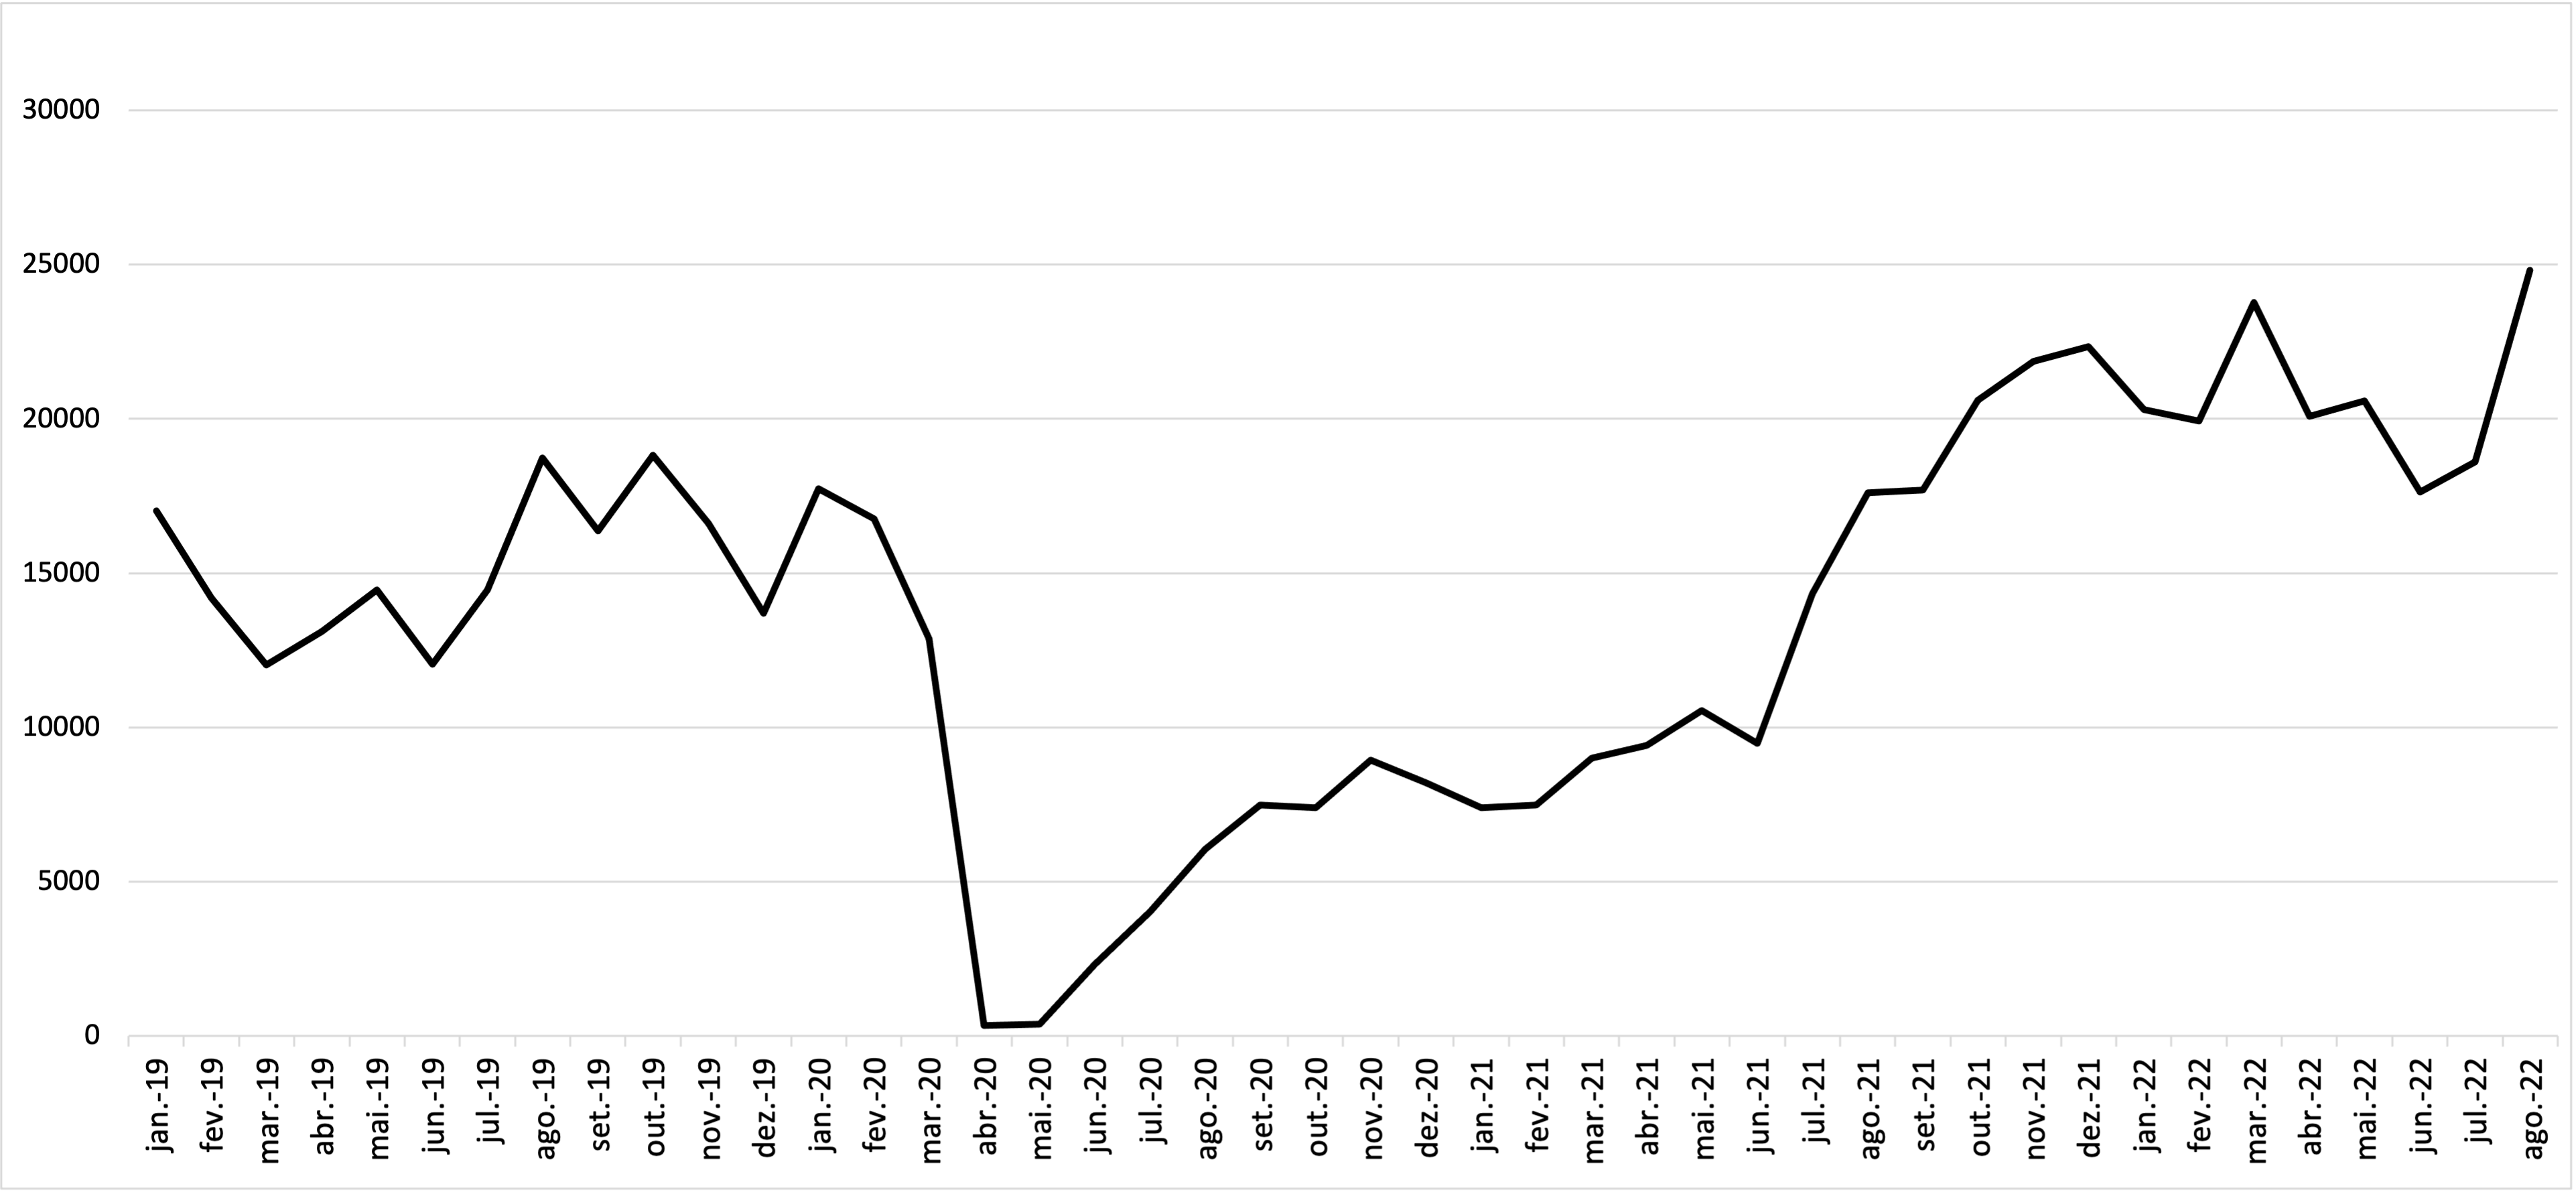
The number of applications for refugee status recognition in August was slightly lower compared to July and to August 2021 (Graph 10).
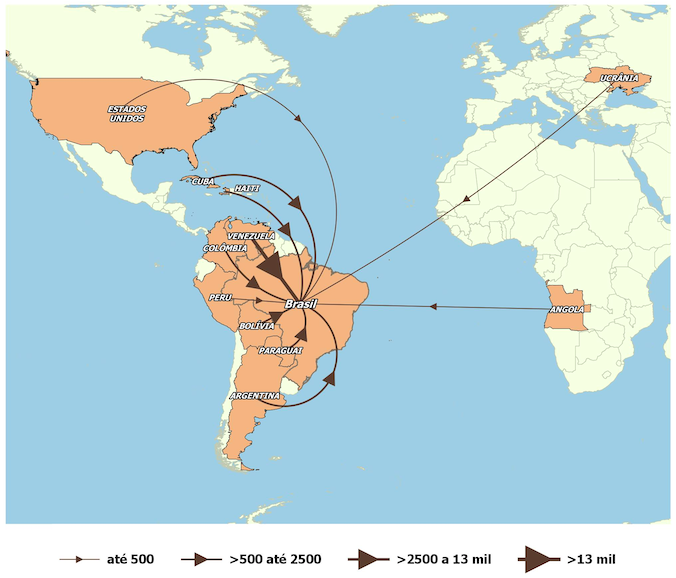
While Venezuelans continue to be the primary nationality in registering applications for recognition of refugee status, in August, the number of requests from Cubans surpassed those from Angolans (Map 3 and Graph 11).
GRAPH 10
Number of applications for recognition of refugee status, by month of registration - Brazil, 2019-2022
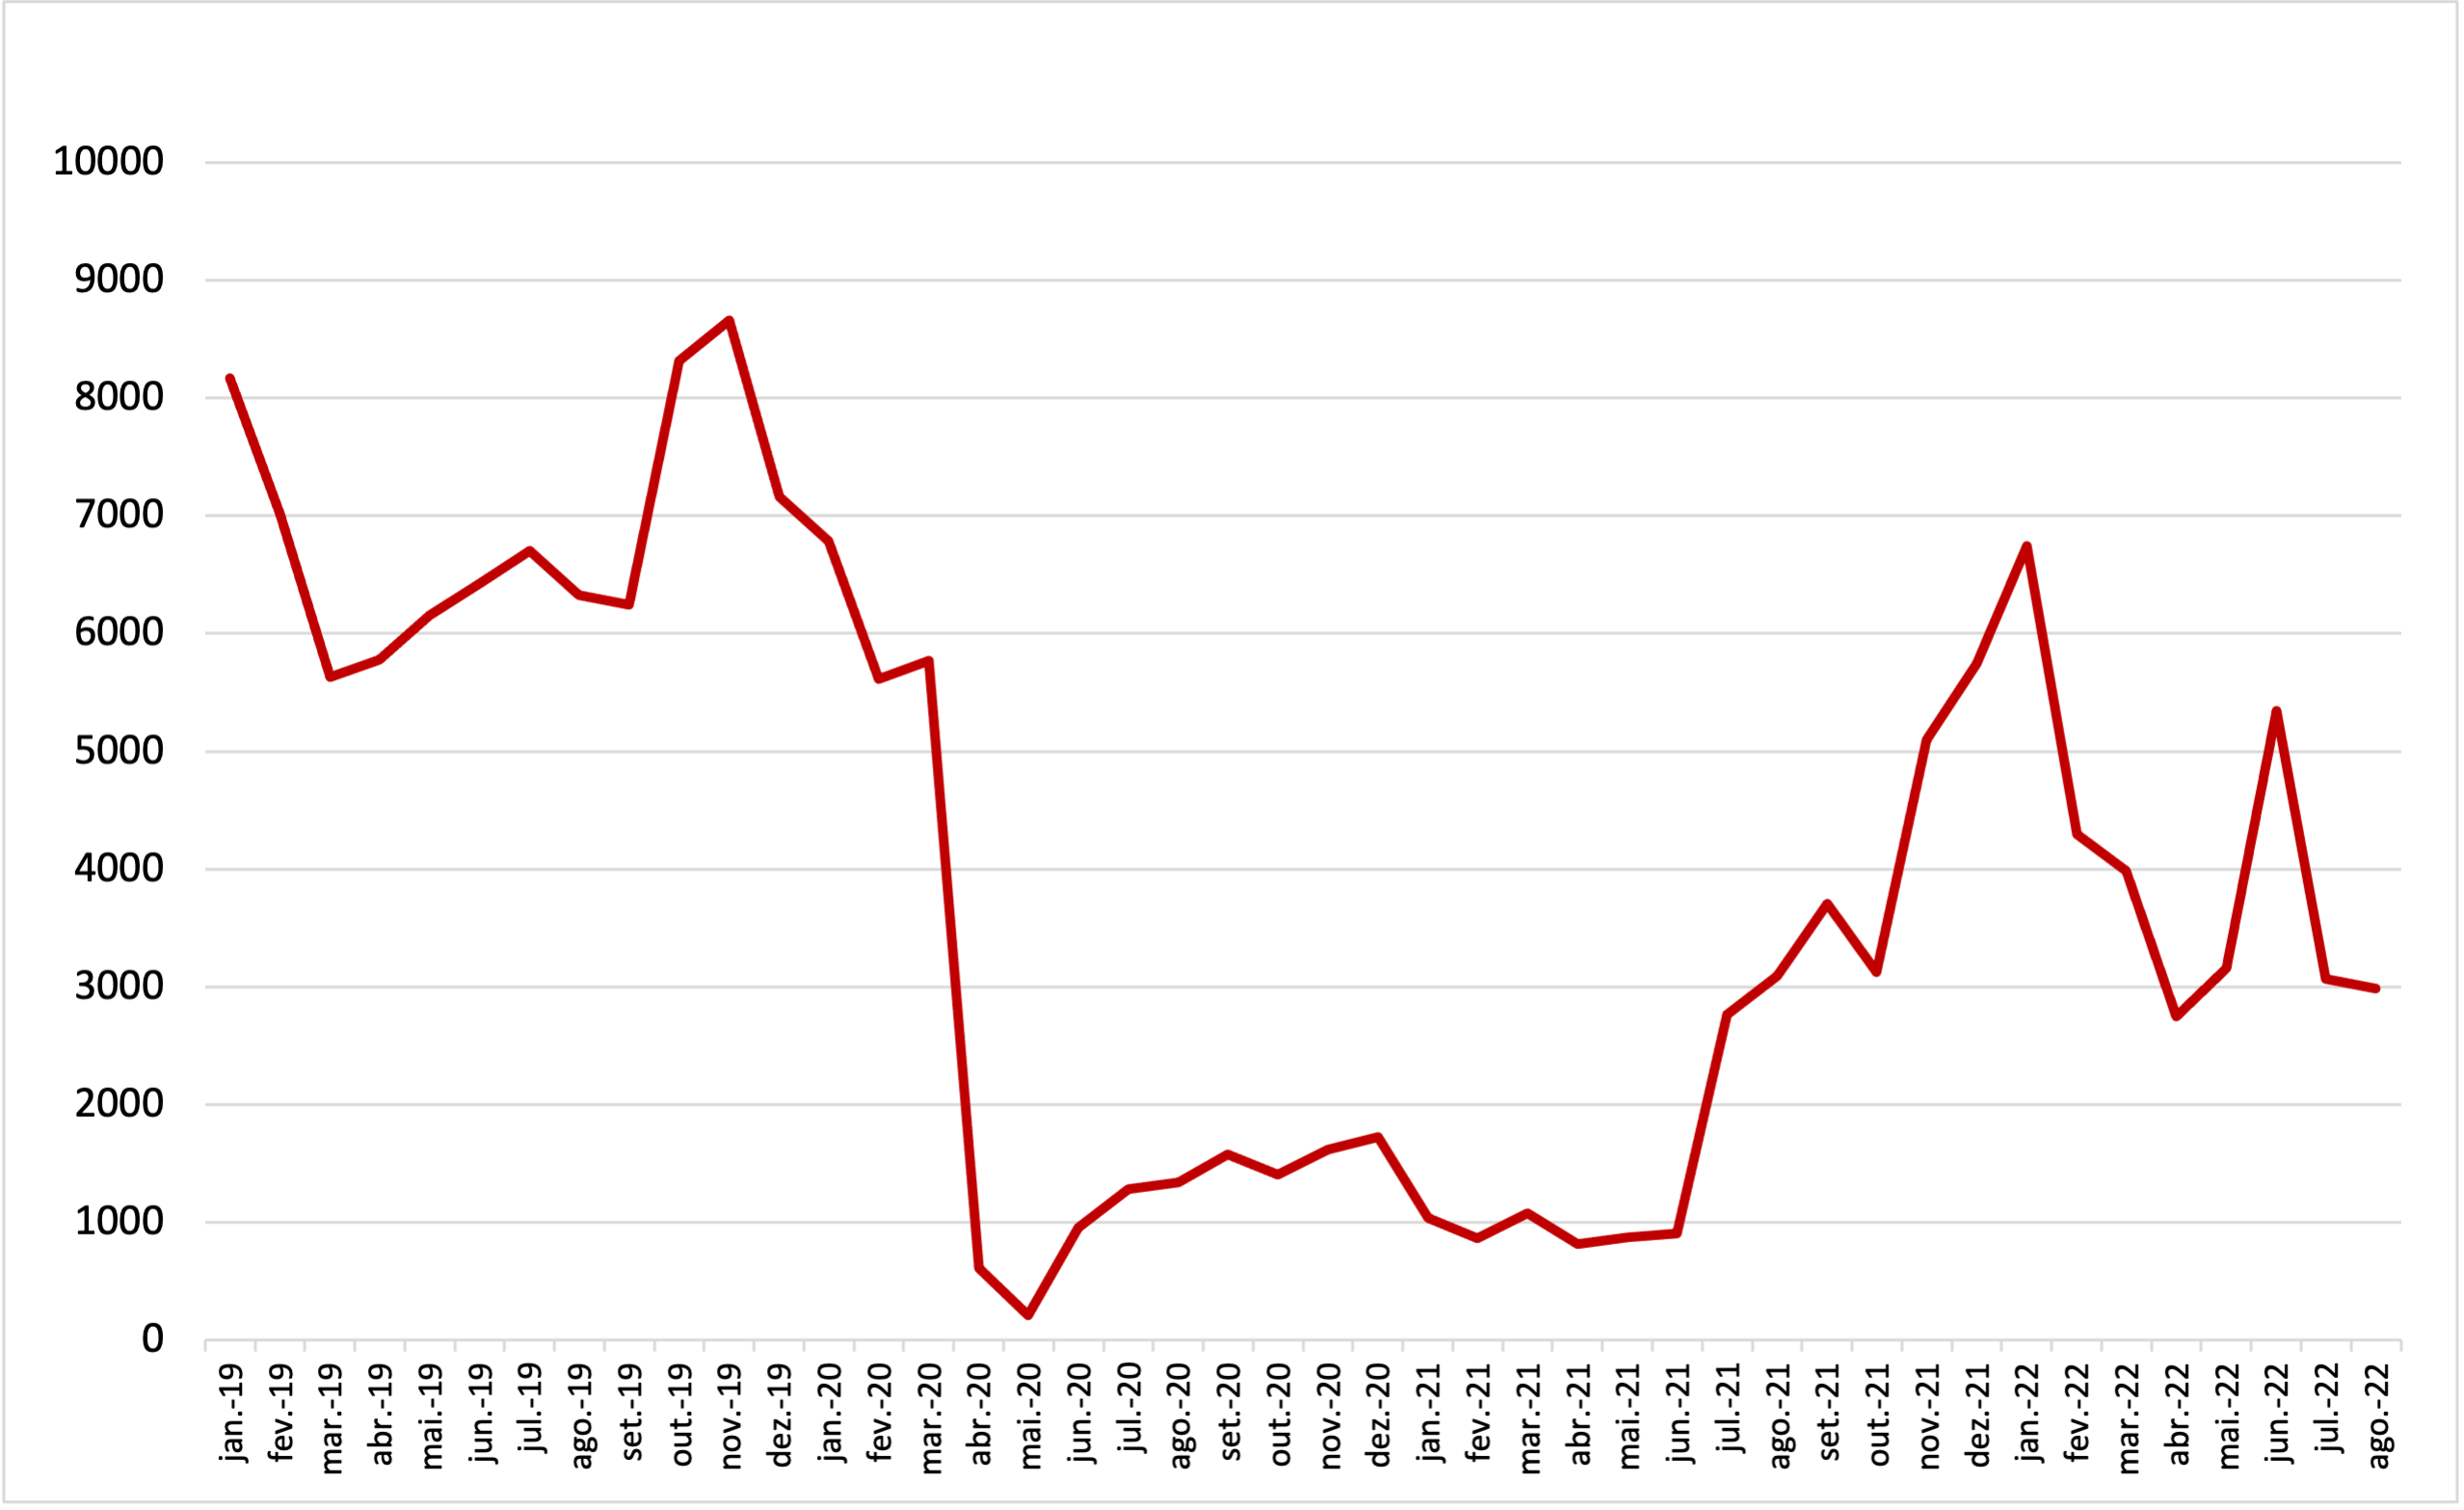
Source: OBMigra (April 2022), based on data from the Brazilian Federal Police, Asylum Claims.
GRAPH 11
Number of applications for recognition of refugee status, by month and main countries - Brazil, July and August 2022
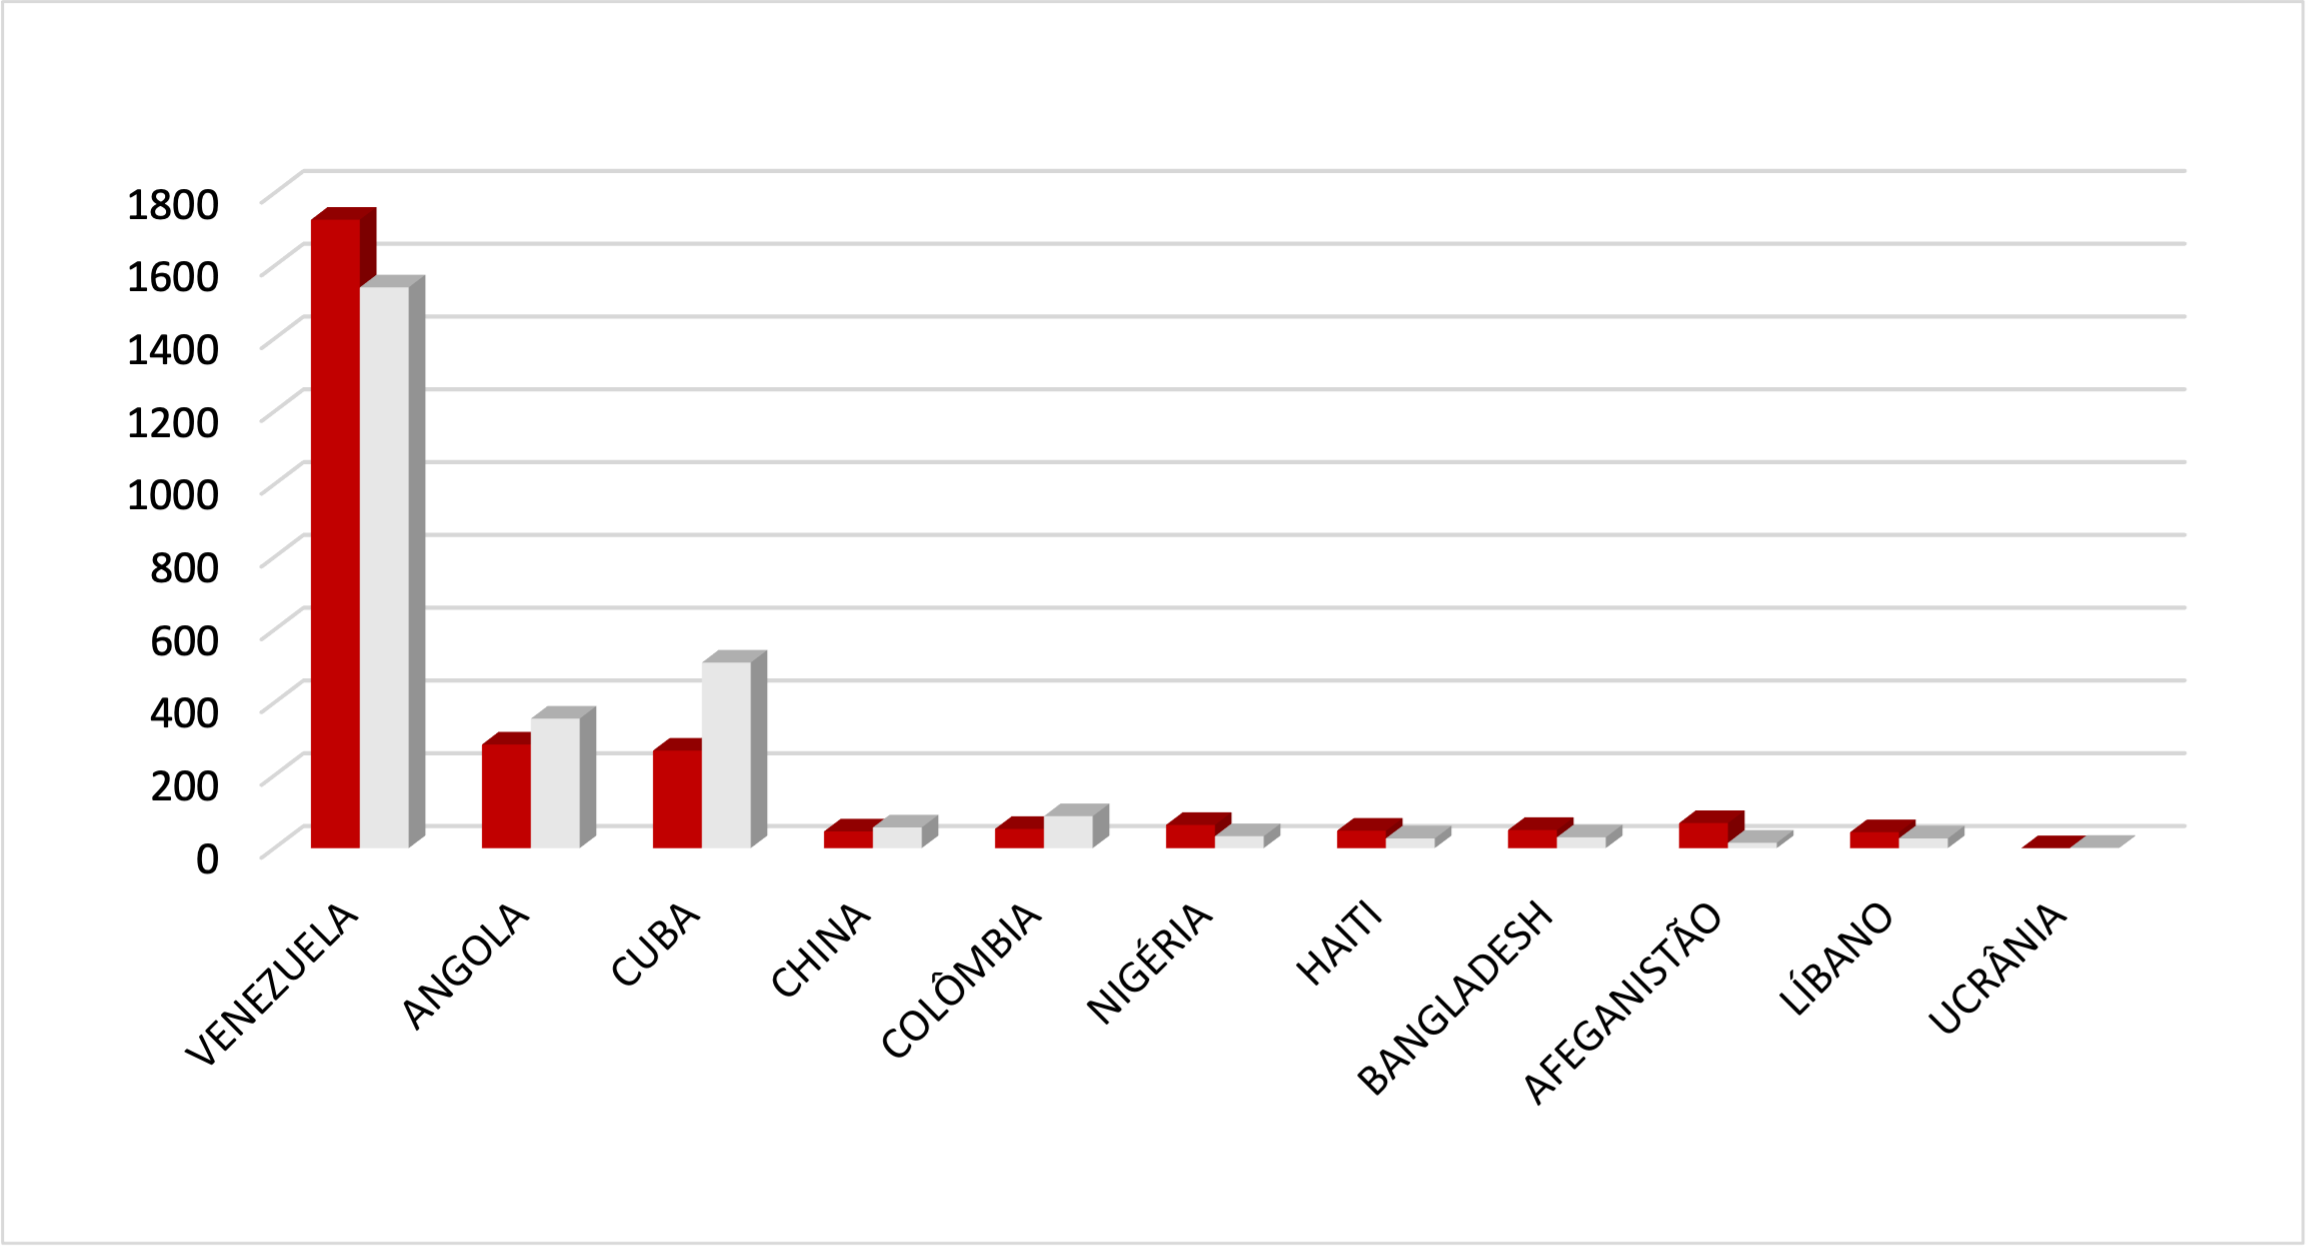
Source: OBMigra (August 2022), based on data from the Brazilian Federal Police, Asylum Claims.
MAP 3
Number of registrations of applications for recognition of refugee status, by main countries of nationality, August 2022
Source: OBMigra (August 2022), based on data from the Brazilian Federal Police, Asylum Claims.
MRE
MRE - Ministry of Foreign Affairs
The number of visas issued in July remained stable compared to the previous month. Significantly, Angola has been overtaken by the United States and India as the main countries issuing visas, marking a shift in their rankings (Graph 12).
In July, the predominant type of visa remained for visits, as usual. However, visas issued for study purposes surpassed those for work (Graph 13).
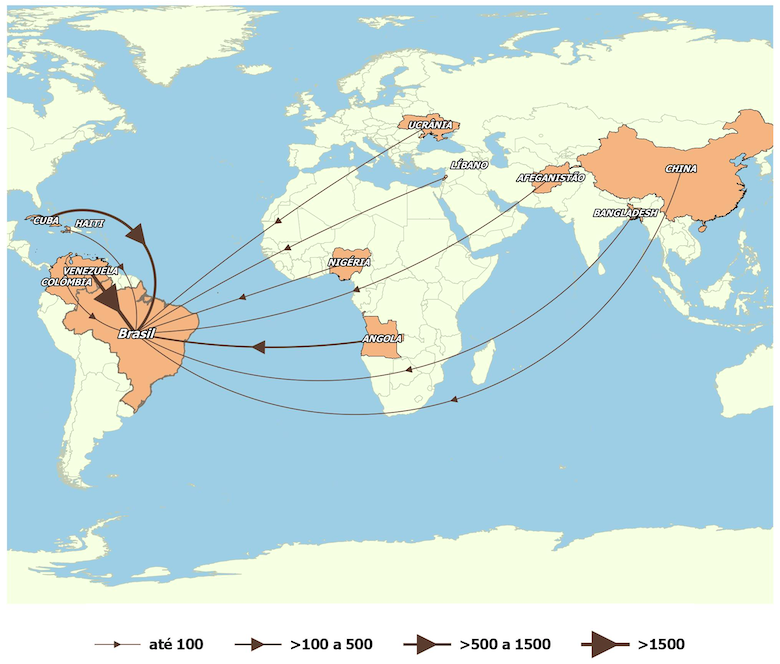
On Map 4, it is evident that the primary nationalities obtaining visas to enter the country are from India, the United States, and China.
GRAPH 12
Number of visas granted by main consular office locations - Brazil, July 2022
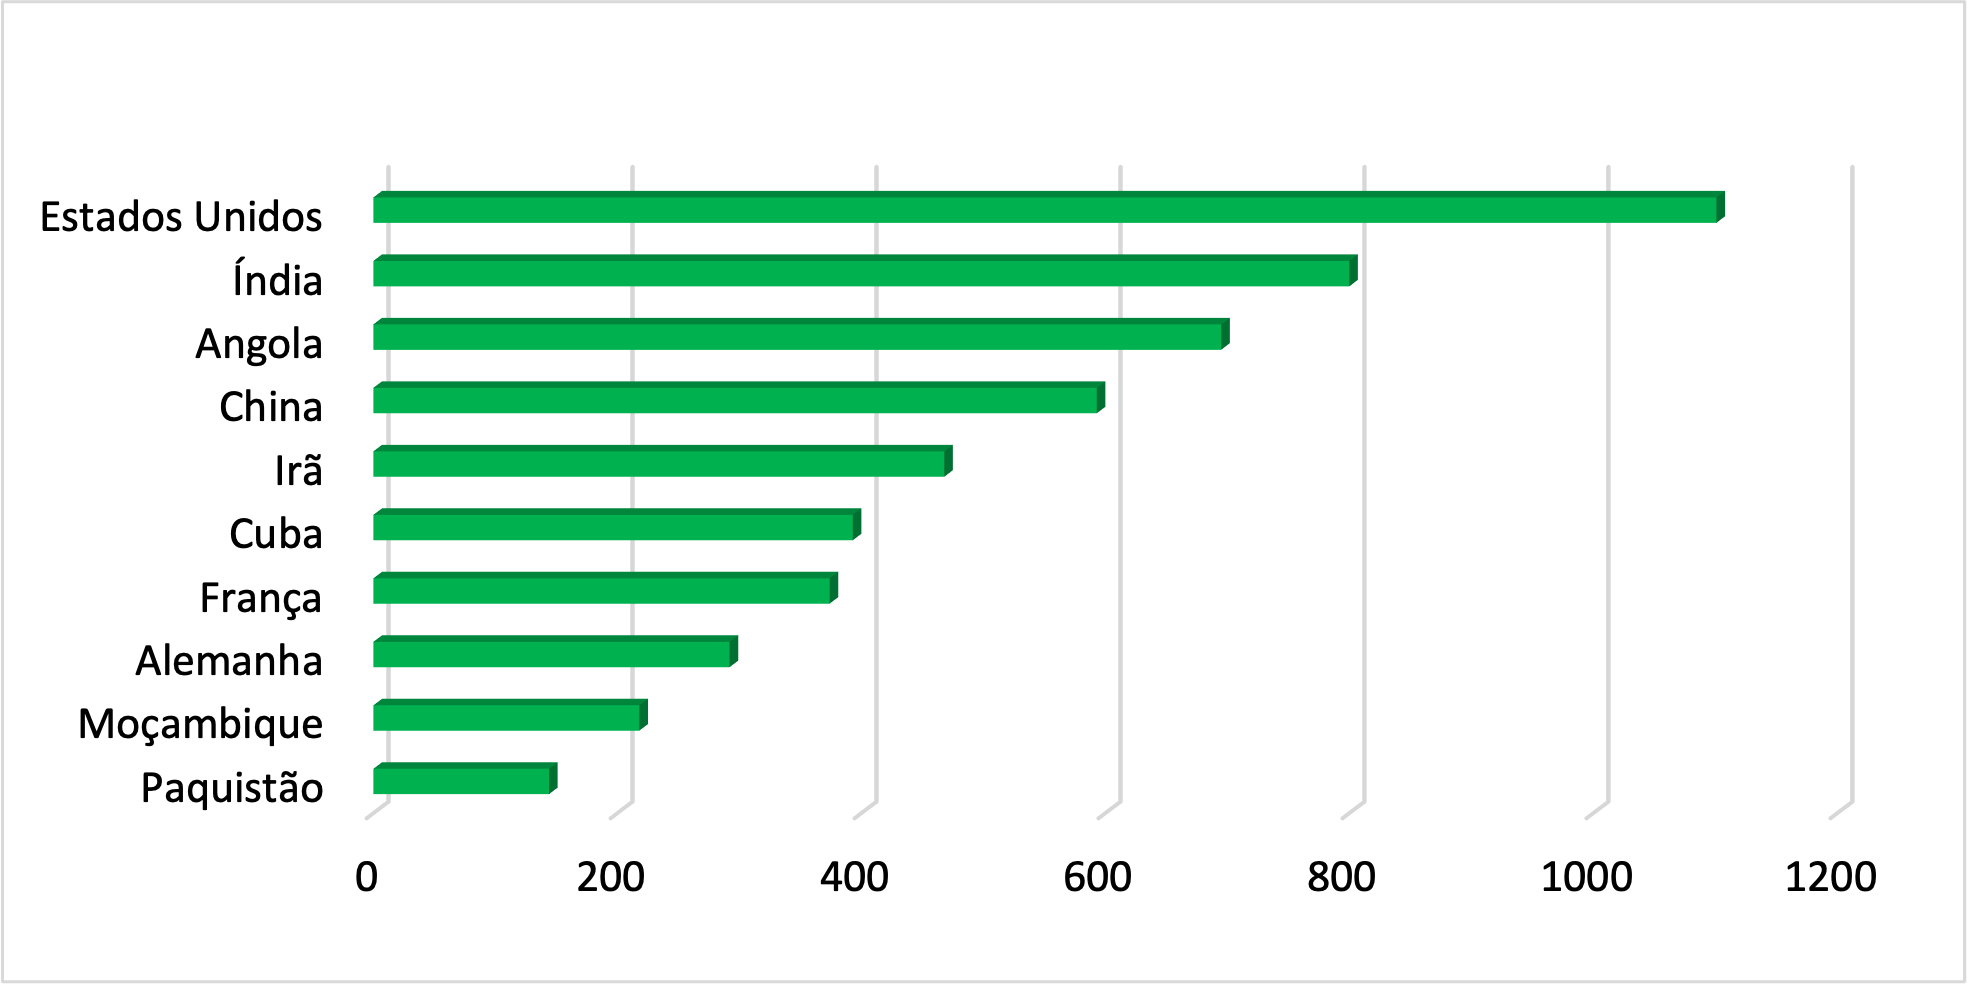
Source: OBMigra (July 2022), based on data from the Ministry of Foreign Affairs.
GRAPH 13
Number of visas granted, according to typologies - Brazil, July 2022
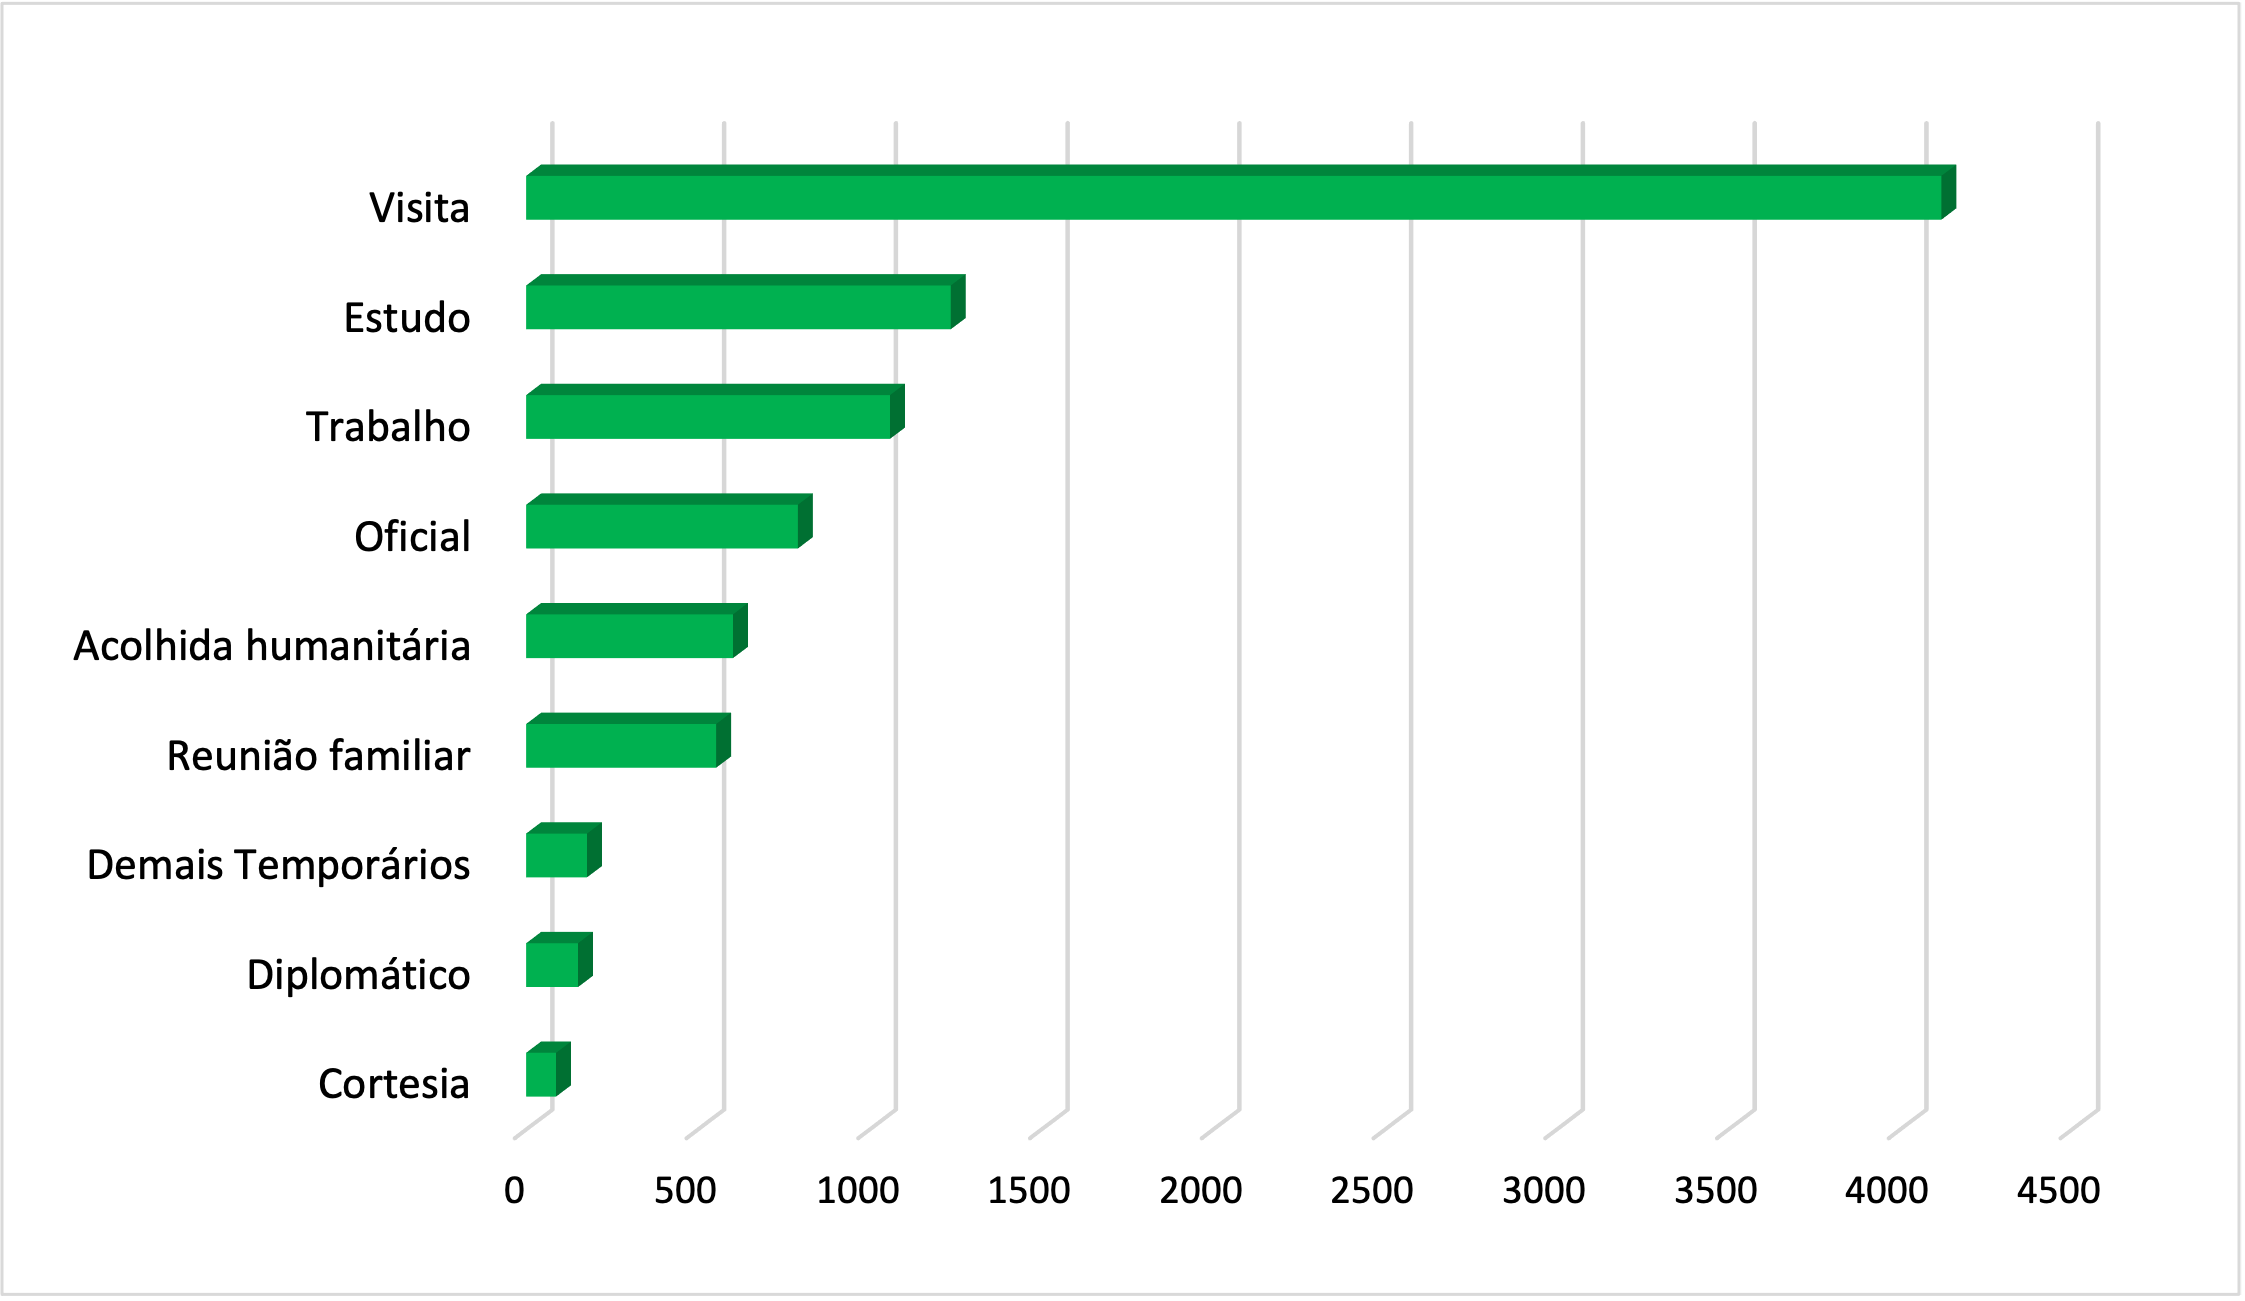
Source: OBMigra (July 2022), based on data from the Ministry of Foreign Affairs.
MAP 4
Number of visas granted by main consular office locations - Brazil, July 2022
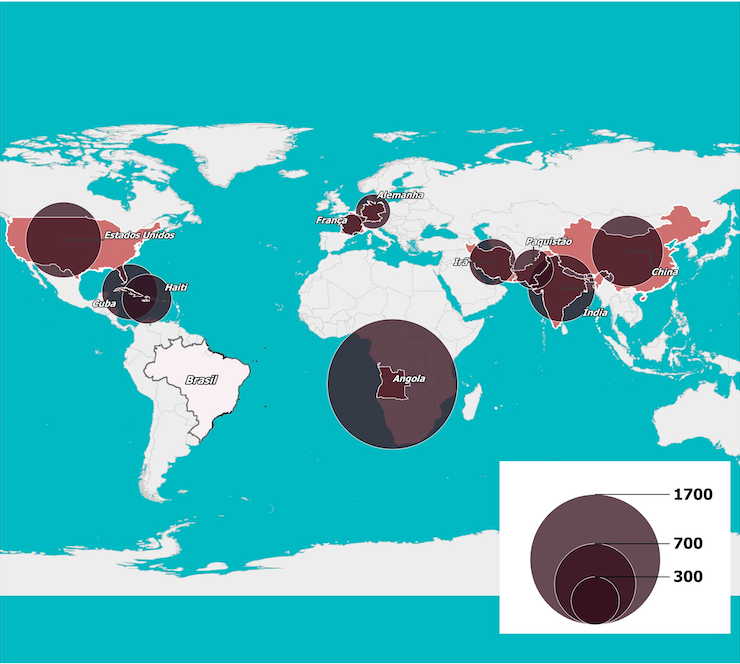
Source: OBMigra (July 2022), based on data from the Ministry of Foreign Affairs.
COMO CITAR
The reproduction of this text and the data contained therein is permitted, provided that proper citation of the source is included. Reproduction for commercial use is prohibited.
How to cite this text:
| CAVALCANTI, L; OLIVEIRA, T; FURTADO, A; DICK, P; QUINTINO, F; GUIMARÃES, B. Acompanhamento de fluxo e empregabilidade dos imigrantes no Brasil: Relatório Mensal do OBMigra Ano 3, Número 8, agosto de 2022/ Observatório das Migrações Internacionais; Brasília, DF: OBMigra, 2022. Disponível em: https://portaldeimigracao.mj.gov.br/pt/dados/relatorios-mensais |