CGIL
CGIL (General Coordination of Labor Immigration)
After reaching a peak in October in the number of residence permits for work and investment purposes, there was a decline in the number of
registrations in November (16.1%), while the series remained stable compared to the figures observed twelve months ago (Graph 1).
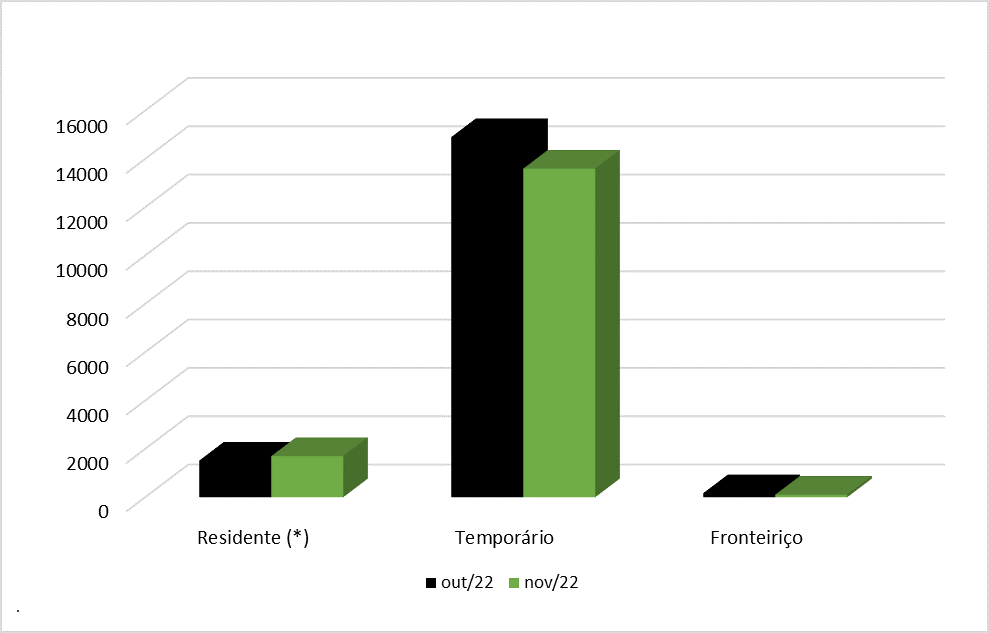
The negative result in the month was primarily driven by a reduction in permits in the Prior Residence modality (-20.3%), while the Residence
permit type remained relatively stable (0.5%), as illustrated in Graph 2.
Even in a context of a decline in the number of residence permits granted to skilled workers for work purposes, the Japanese, Koreans, and
Portuguese demonstrated a positive variation compared to the previous month (Graph 3).
GRAPH 1
Number of work permits for labor and investment purposes, by month of registration - Brazil, 2019-2022
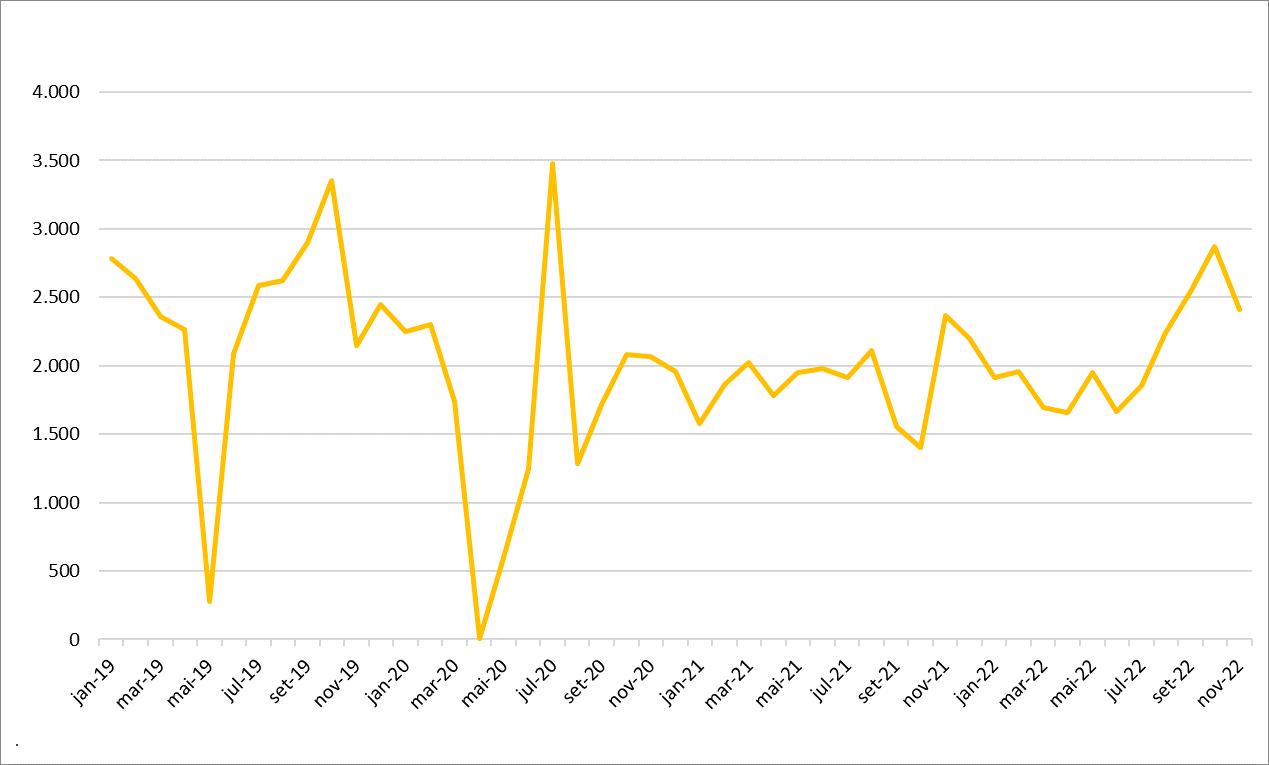
Source: OBMigra (2022), based on data from the General Coordination of Labor Immigration (CGIL).
GRAPH 2
Number of permits granted, by month, according to type of permit - Brazil, October and November 2022.
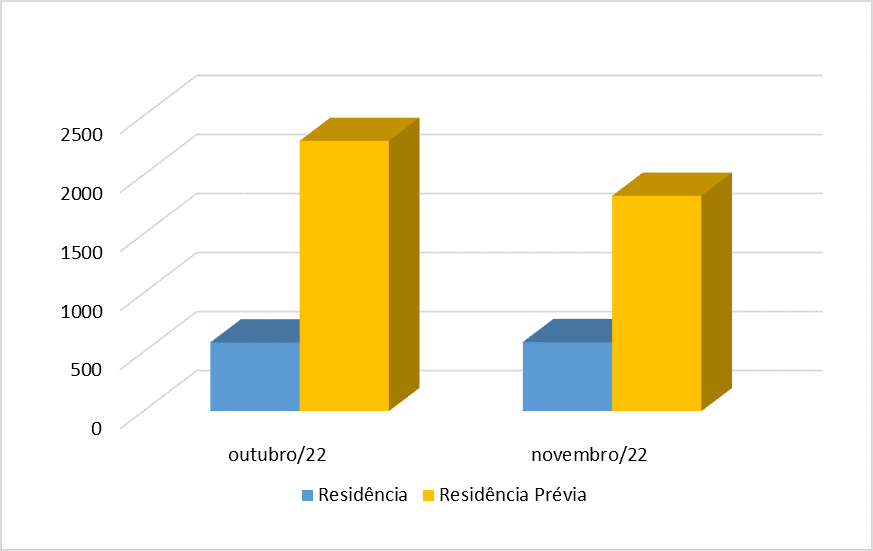
Source: General Coordination of Labor Immigration / Ministry of Justice and Public Security, November 2022.
GRAPH 3
Number of permits granted for skilled workers, by month and sex, according to main countries - Brazil, October and November 2022.
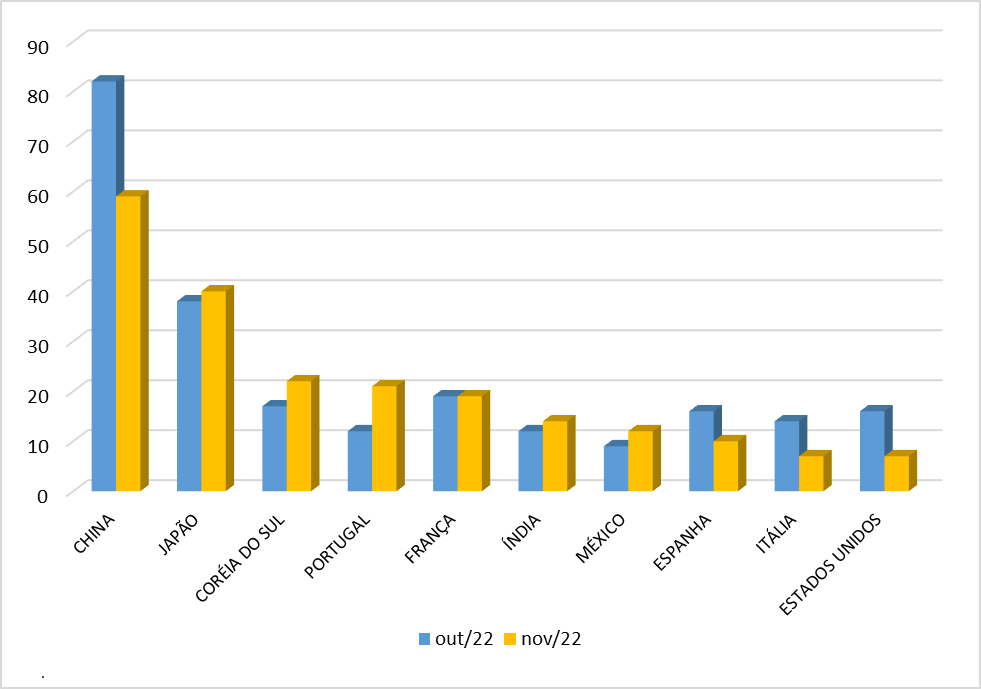
Source: General Coordination of Labor Immigration / Ministry of Justice and Public Security, November 2022
CTPS/RAIS/NOVO CAGED
Harmonized database Work and Social Security Card (CTPS)/Annual Report of Social Information (RAIS)/New General Register of Employed and Unemployed Persons (CAGED)
For the second consecutive month, there was a decrease in the number of job openings created for immigrant workers in the formal market in
October (Graph 4). On the other hand, there was an increase in the movement of these workers, with the number of layoffs surpassing the
number of hirings.
Among the main nationalities, Venezuelans experienced an increase of 3,047 jobs. On the other hand, Haitians, another significant nationality
in the formal job market, had a negative balance for both men (-696) and women (-310) for the second consecutive month, as illustrated in
Graph 5.
In terms of job creation for the immigrant labor force, the Southern Region created the most jobs with 1,343, followed by the Southeast with
670 (Map 1).
.
GRAPH 4
Jobs created for immigrants in the formal labor market, by month - Brazil, 2019/2022
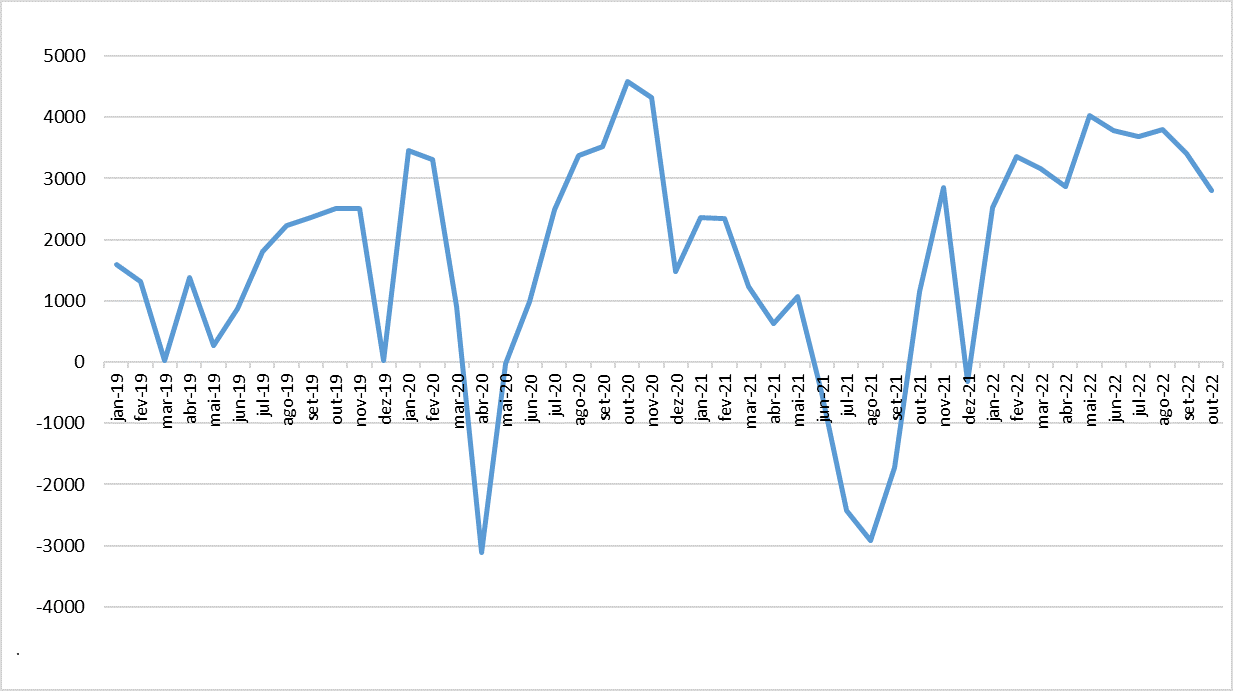
Source: OBMigra (2022), based on data from the harmonized database RAIS-CTPS-CAGED and the Digital System of Tax, Social Security and Labor Obligations (eSocial).
GRAPH 5
Movements of migrant workers in the formal labor market, by sex and main countries - Brazil, October 2022.
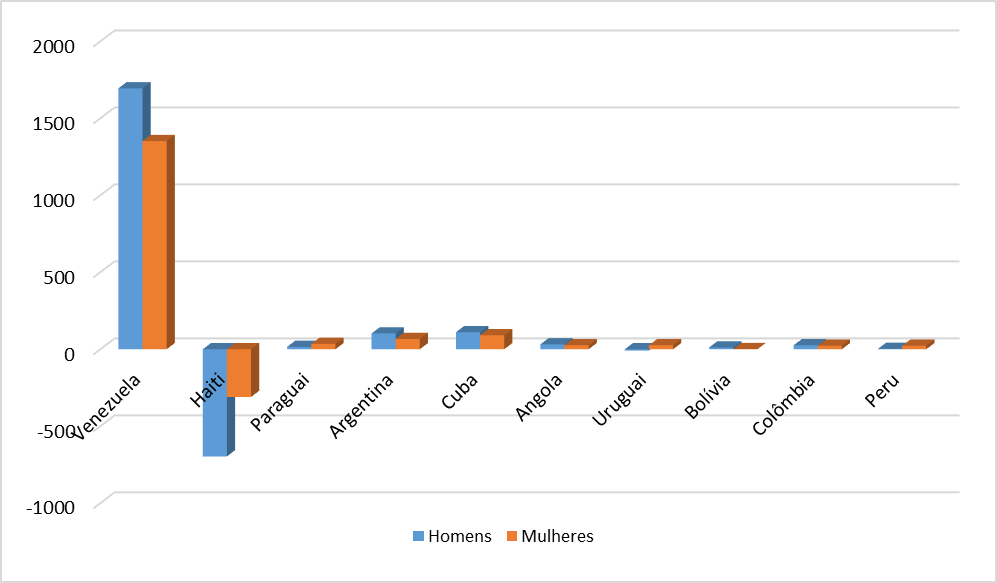
Source: OBMigra (October 2022), based on data from the Ministry of Economy, Harmonized database RAIS-CTPS-CAGED.
MAP 1
Number of jobs created for immigrants, according to Regions, October 2022.
.
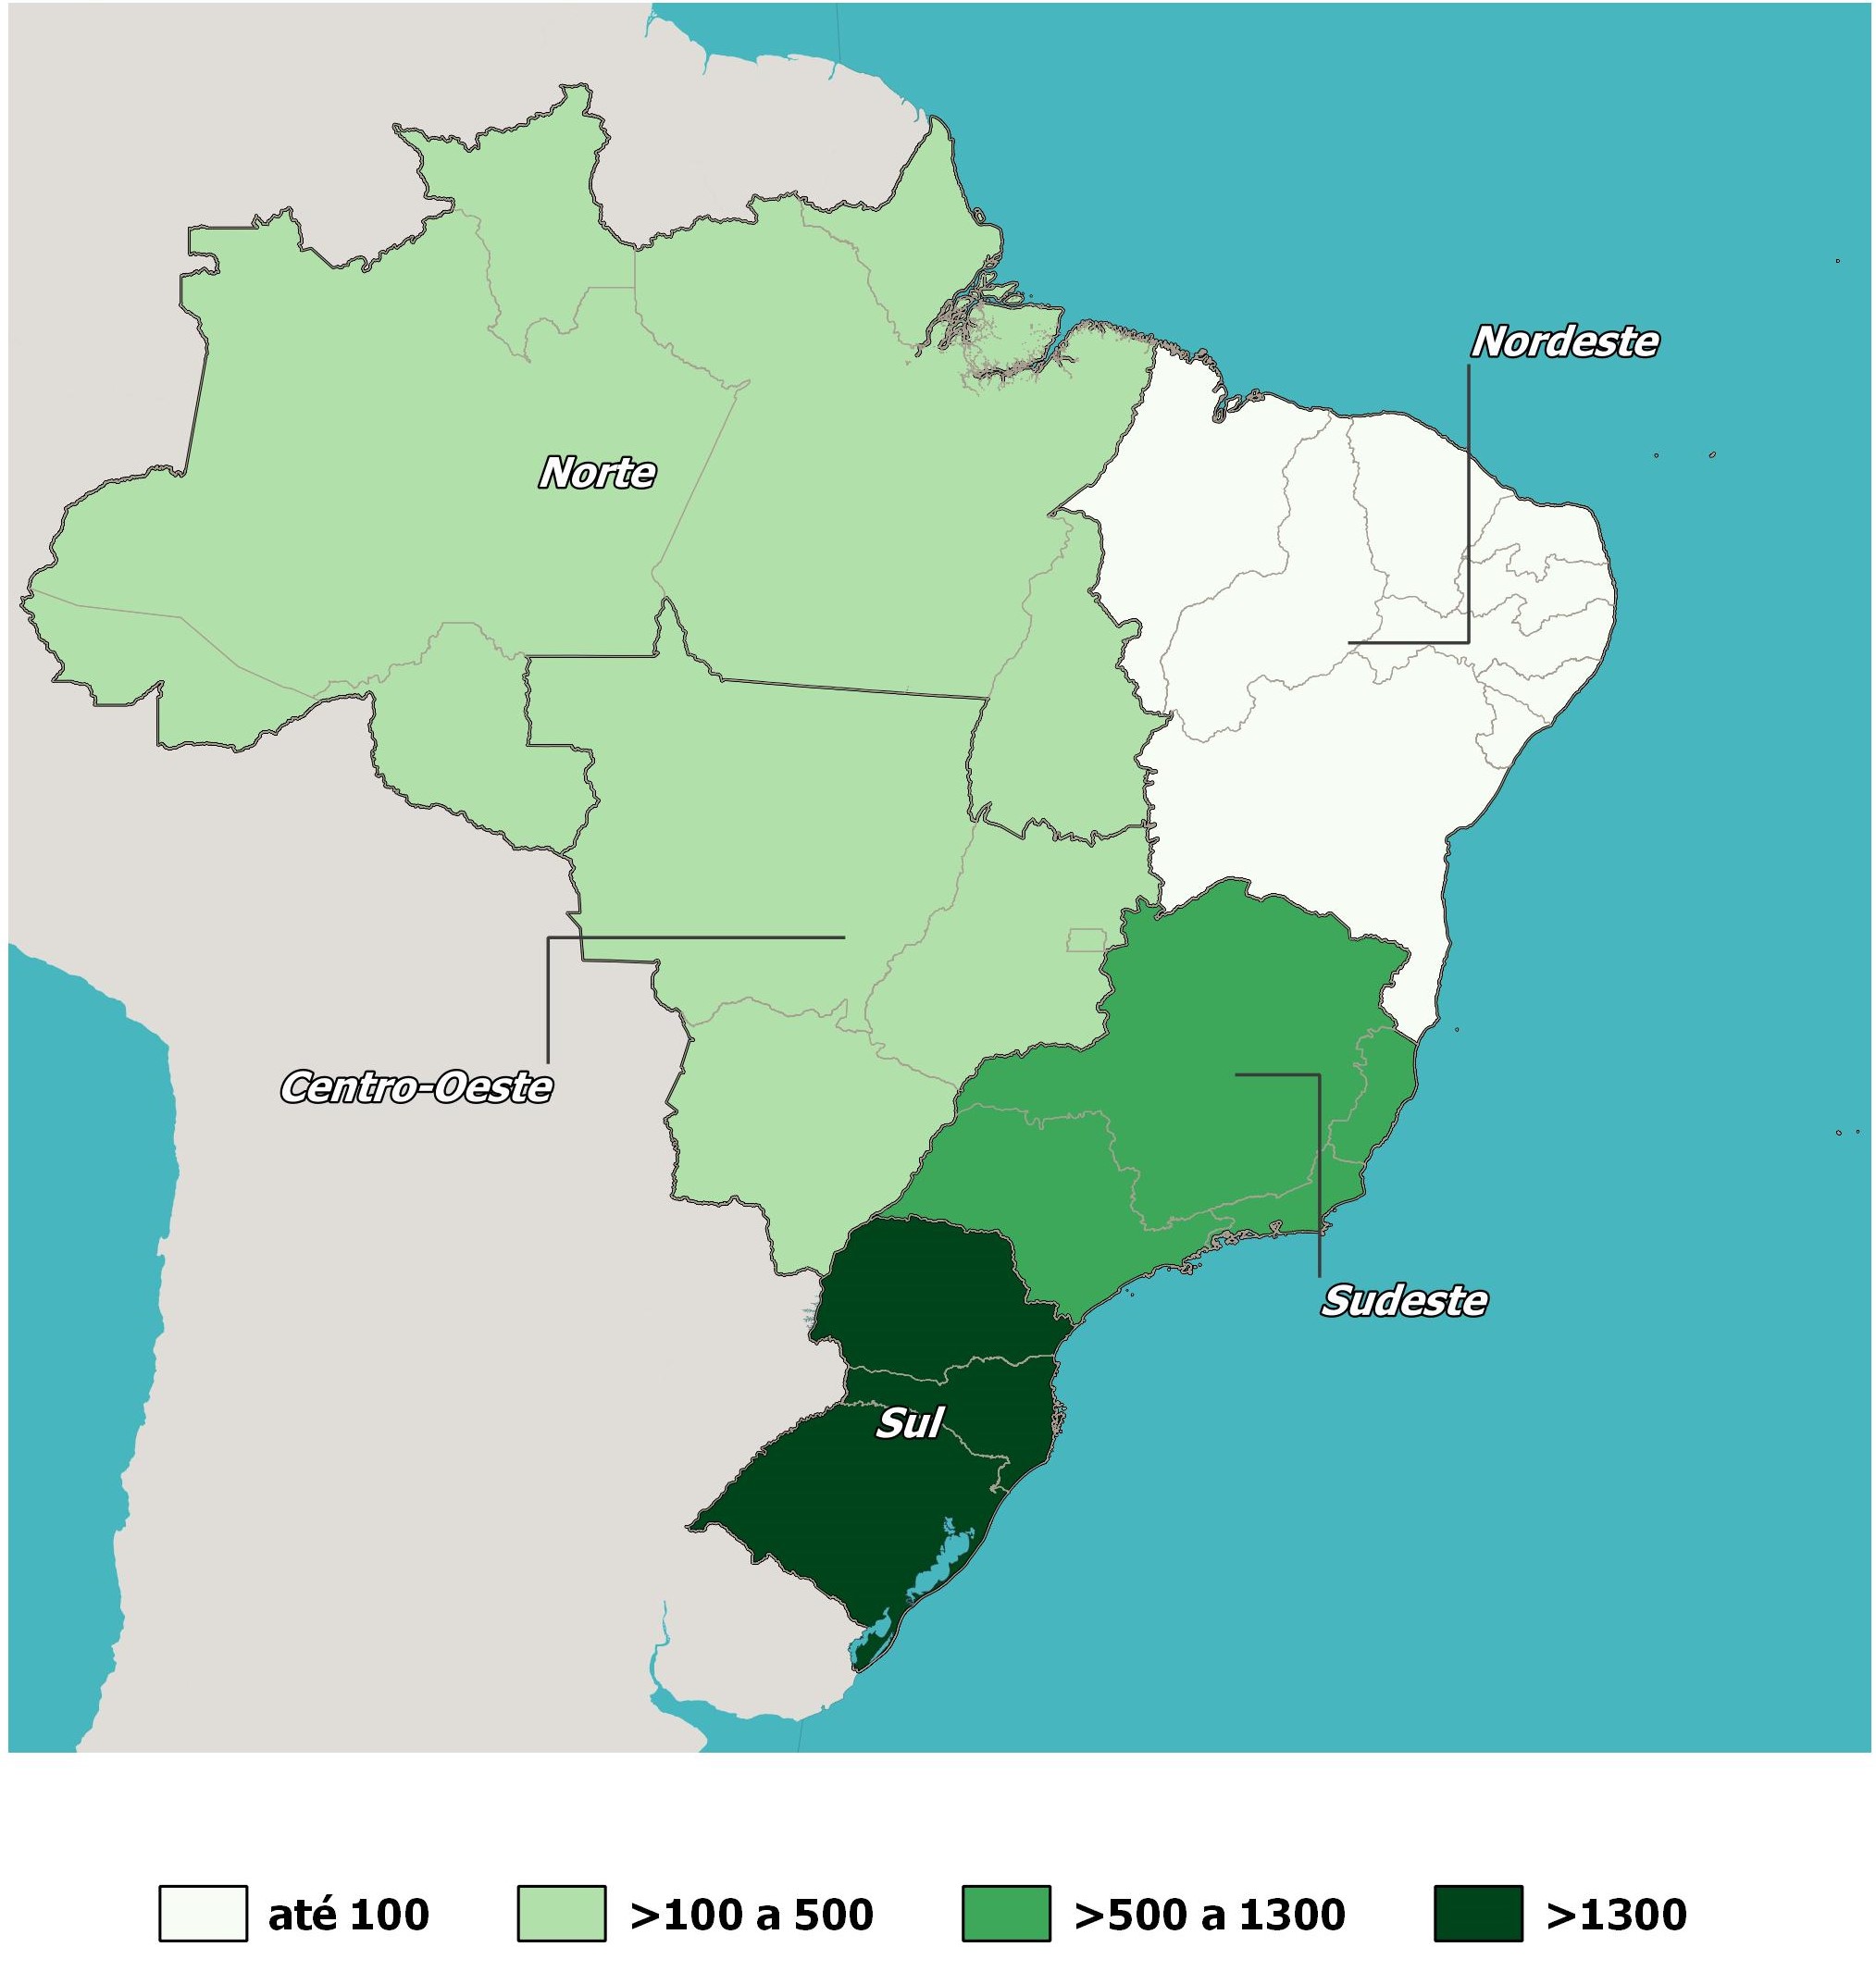
Source: OBMigra (October 2022), based on data from the Ministry of Economy, Harmonized database RAIS-CTPS-CAGED.
STI
STI (International Traffic System)
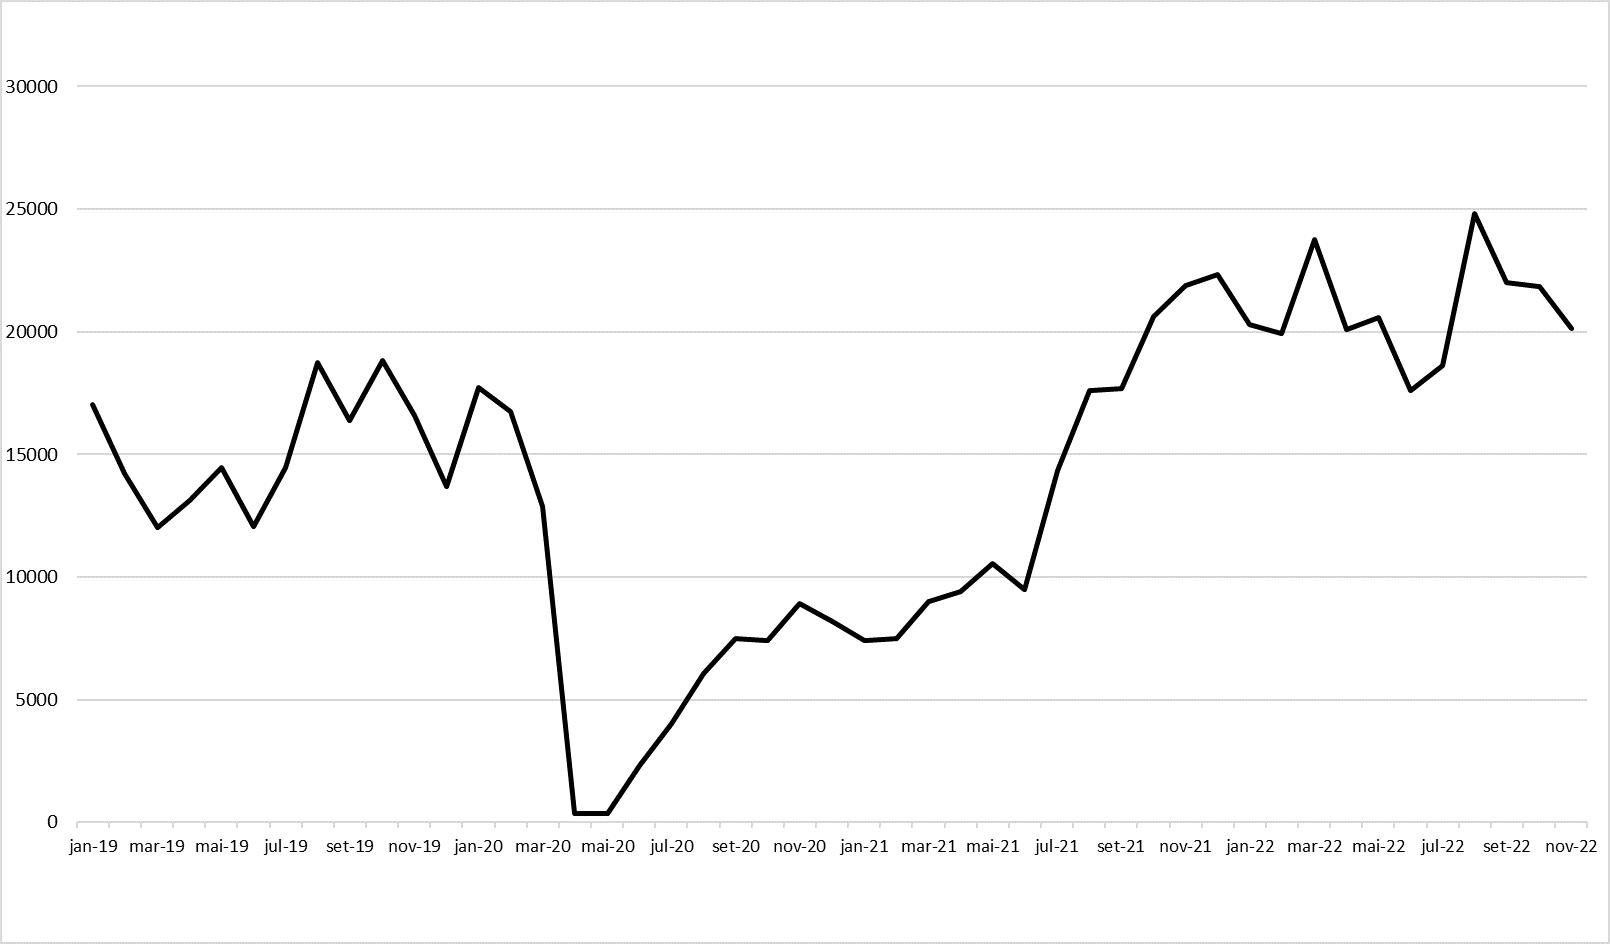
Since July, cross-border movements of people have remained stable, with approximately 1.7 million entries and exits recorded (Graph 6).
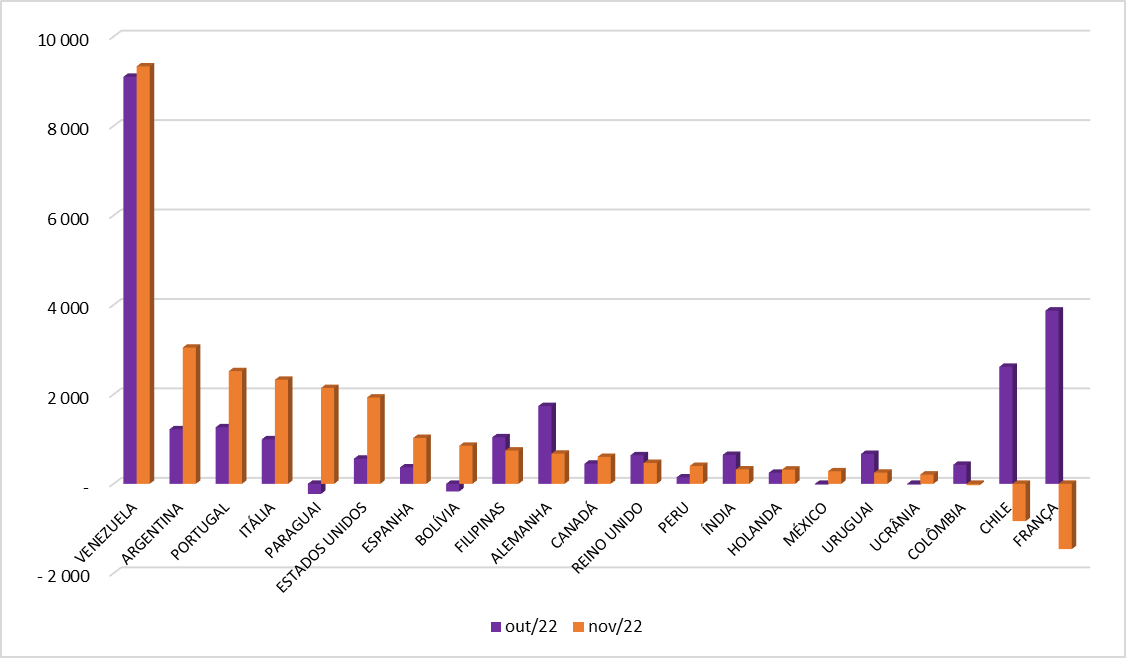
October and November witnessed positive balances in the country, breaking a sequence of negative results. This performance was largely
driven by Venezuelans, Argentinians, Portuguese, Italians, and Paraguayans (Graph 7).
GRAPH 6
Cross-border movements, by month of registration, Brazil 2019/2022
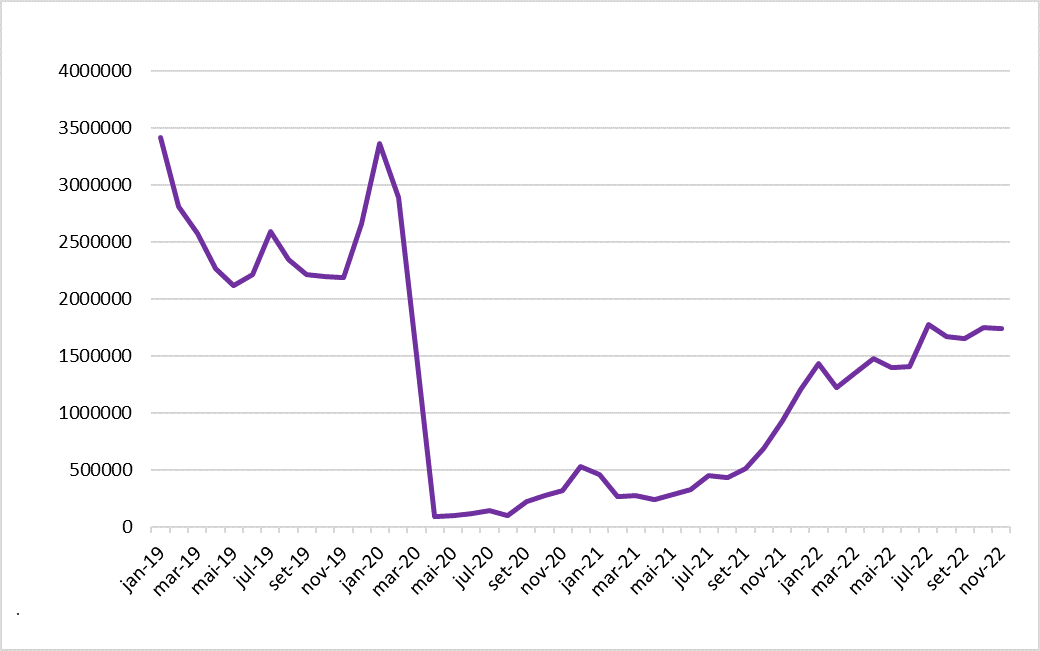
Source: OBMigra (2022), based on data from the Brazilian Federal Police, International Traffic System (STI).
GRAPH 7
Cross-border movement balance, by month and main countries - Brazil, October and November 2022.
 Source: OBMigra (November 2022), based on data from the Brazilian Federal Police, International Traffic System (STI).
SISMIGRA
SisMigra (National Migration Registry System)
Since August, there has been a downward trend in the number of residence registrations (Graph 8).
This result is primarily attributed to the decrease in temporary registrations (Graph 9).
In Map 2, it is evident that the main immigration flows consist of Venezuelans, followed by Bolivians and Cubans. On the other hand,
registrations of Haitians, which previously held top positions, have gradually diminished in importance in recent months.
GRAPH 8
Number of immigrant registrations, by month of registration - Brazil, 2019/2022
Source: OBMigra (2022), based on data from the Brazilian Federal Police, National Migration Registry System (SISMIGRA).
GRAPH 9
Number of migrant registrations, according to month of registration and classification - Brazil, October and November, 2022.
Source: OBMigra (November 2022), based on data from the Brazilian Federal Police, National Migration Registry System (SISMIGRA).
MAP 2
Number of immigrant registrations, by main countries of birth, November 2022.
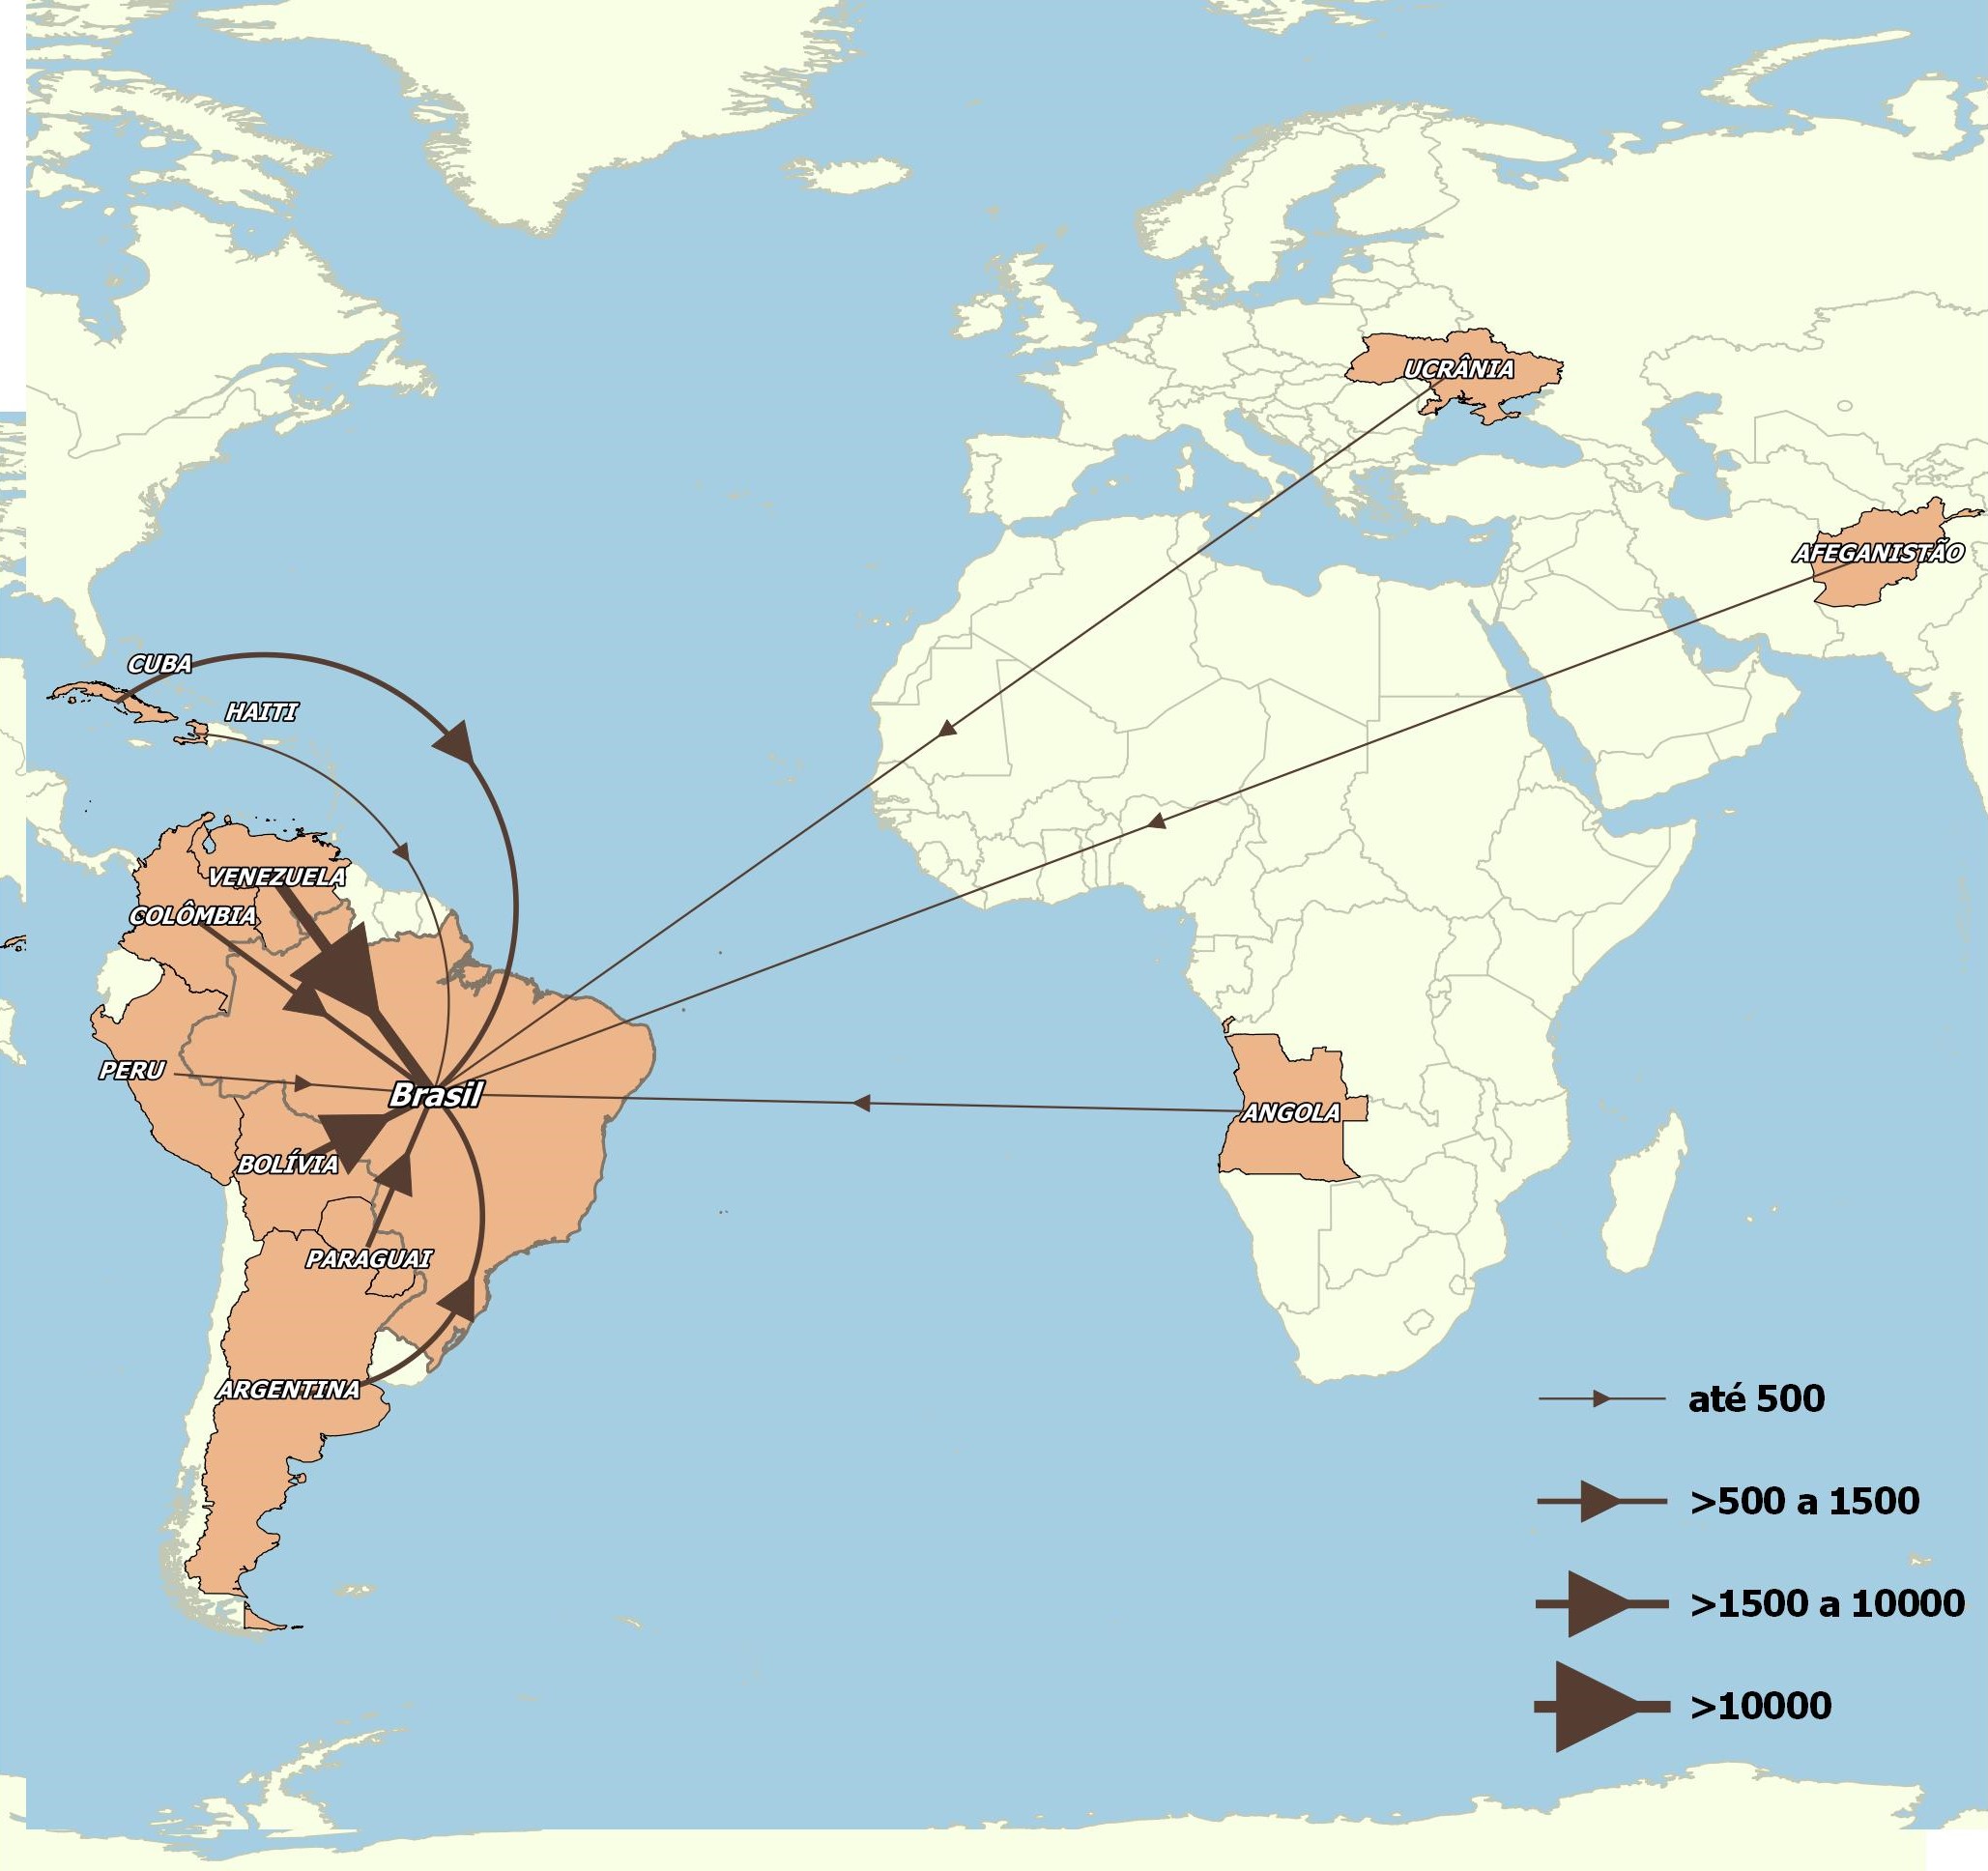
Source: OBMigra (November 2022), based on data from the Brazilian Federal Police, National Migration Registry System (SISMIGRA).
Solicitantes
Applicants for refugee status recognition
After experiencing a slight recovery in September and October, the number of applications for recognition of refugee status decreased by -
6.8% in November (Graph 10).
Among the main nationalities seeking recognition of refugee status, only the Chinese, Nigerians, Peruvians, and Moroccans recorded a positive
variation, albeit in very small absolute numbers (Graph 11).
In November, Venezuelans, Cubans, and Angolans were the primary nationalities seeking refugee recognition (Map 3).
GRAPH 10
Number of applications for recognition of refugee status, by month of registration - Brazil, 2019-2022
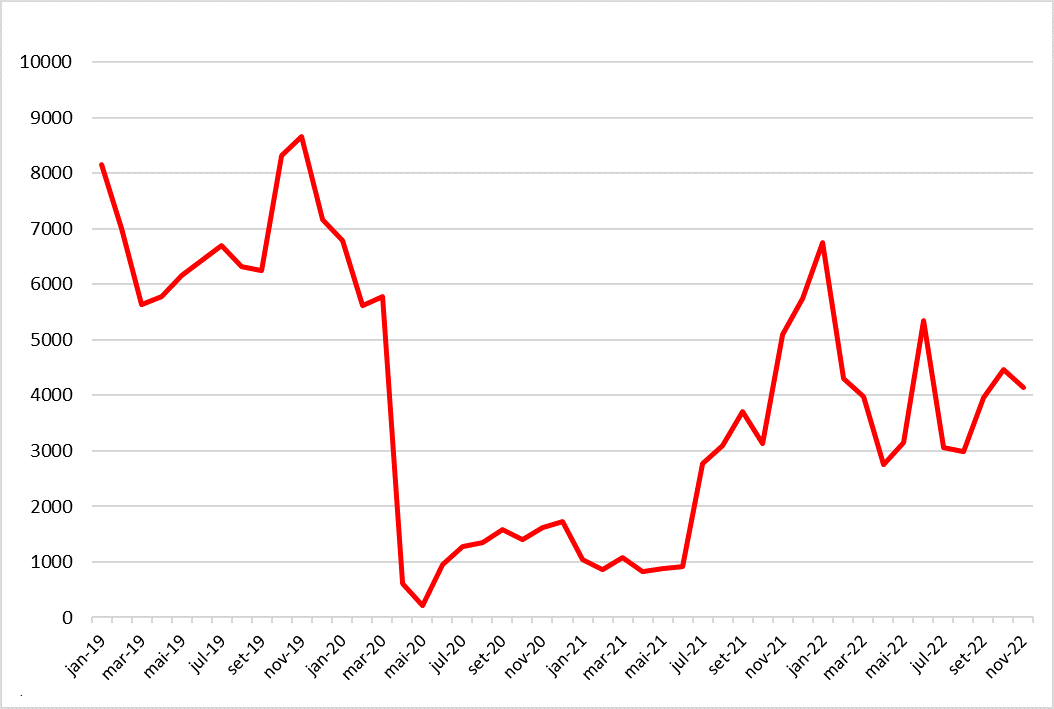
Source: OBMigra (2022), based on data from the Brazilian Federal Police, Asylum Claims, and the System of the National Committee for Refugees (SISCONARE).
GRAPH 11
Number of applications for recognition of refugee status, by month, sex, and main countries - Brazil, October and November 2022.
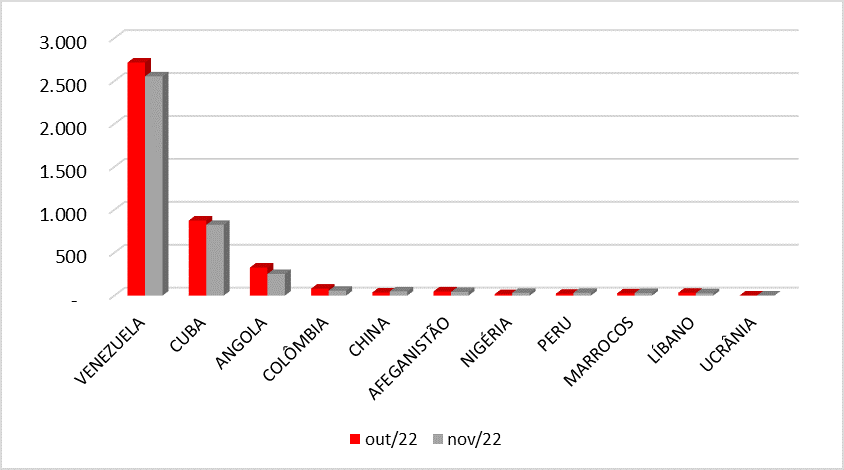
Source: OBMigra (November 2022), based on data from the Brazilian Federal Police (STI-MAR), and the System of the National Committee for Refugees (SISCONARE).
MAP 3
Number of applications for recognition of refugee status, according to country, November 2022
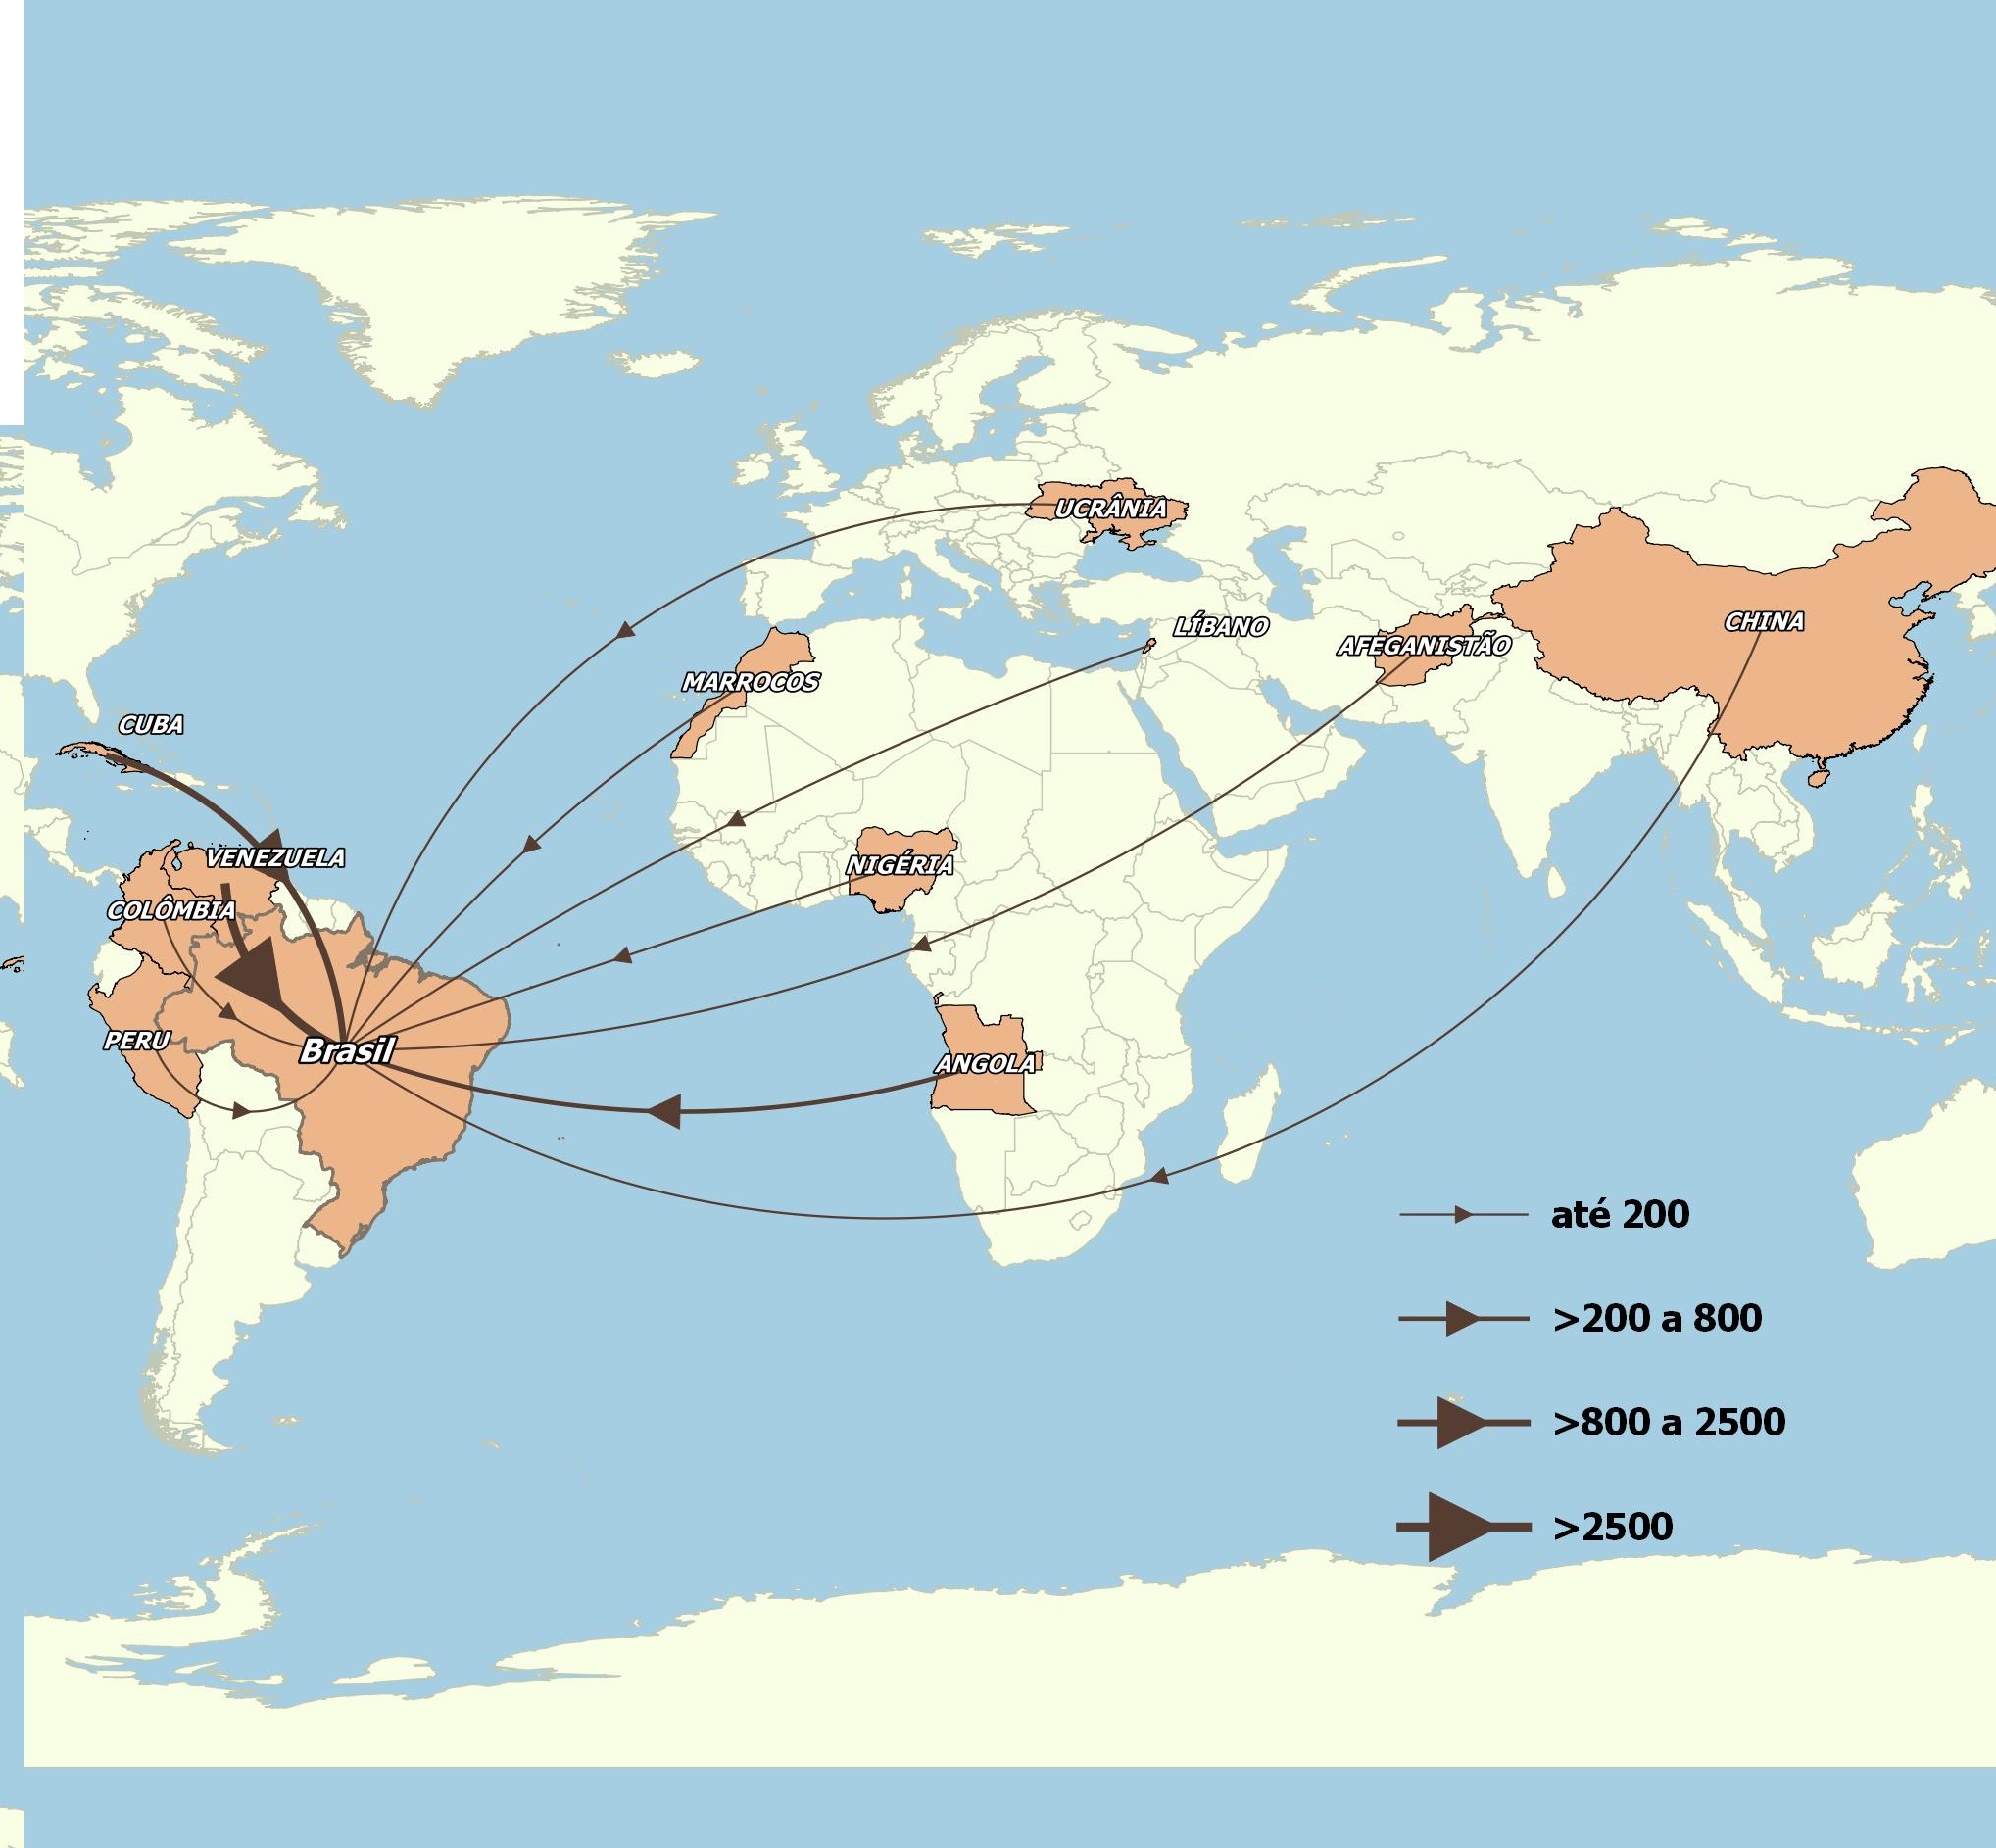
Source: OBMigra (November 2022), based on data from the Brazilian Federal Police, Asylum Claims.
MRE
MRE - Ministry of Foreign Affairs
The number of visas issued at the main consular offices increased by 71.0% compared to November 2021 and by 7.4% compared to the
previous month. The main offices issuing visas during the month were located in Angola, the United States, China, and India (Graph 12).
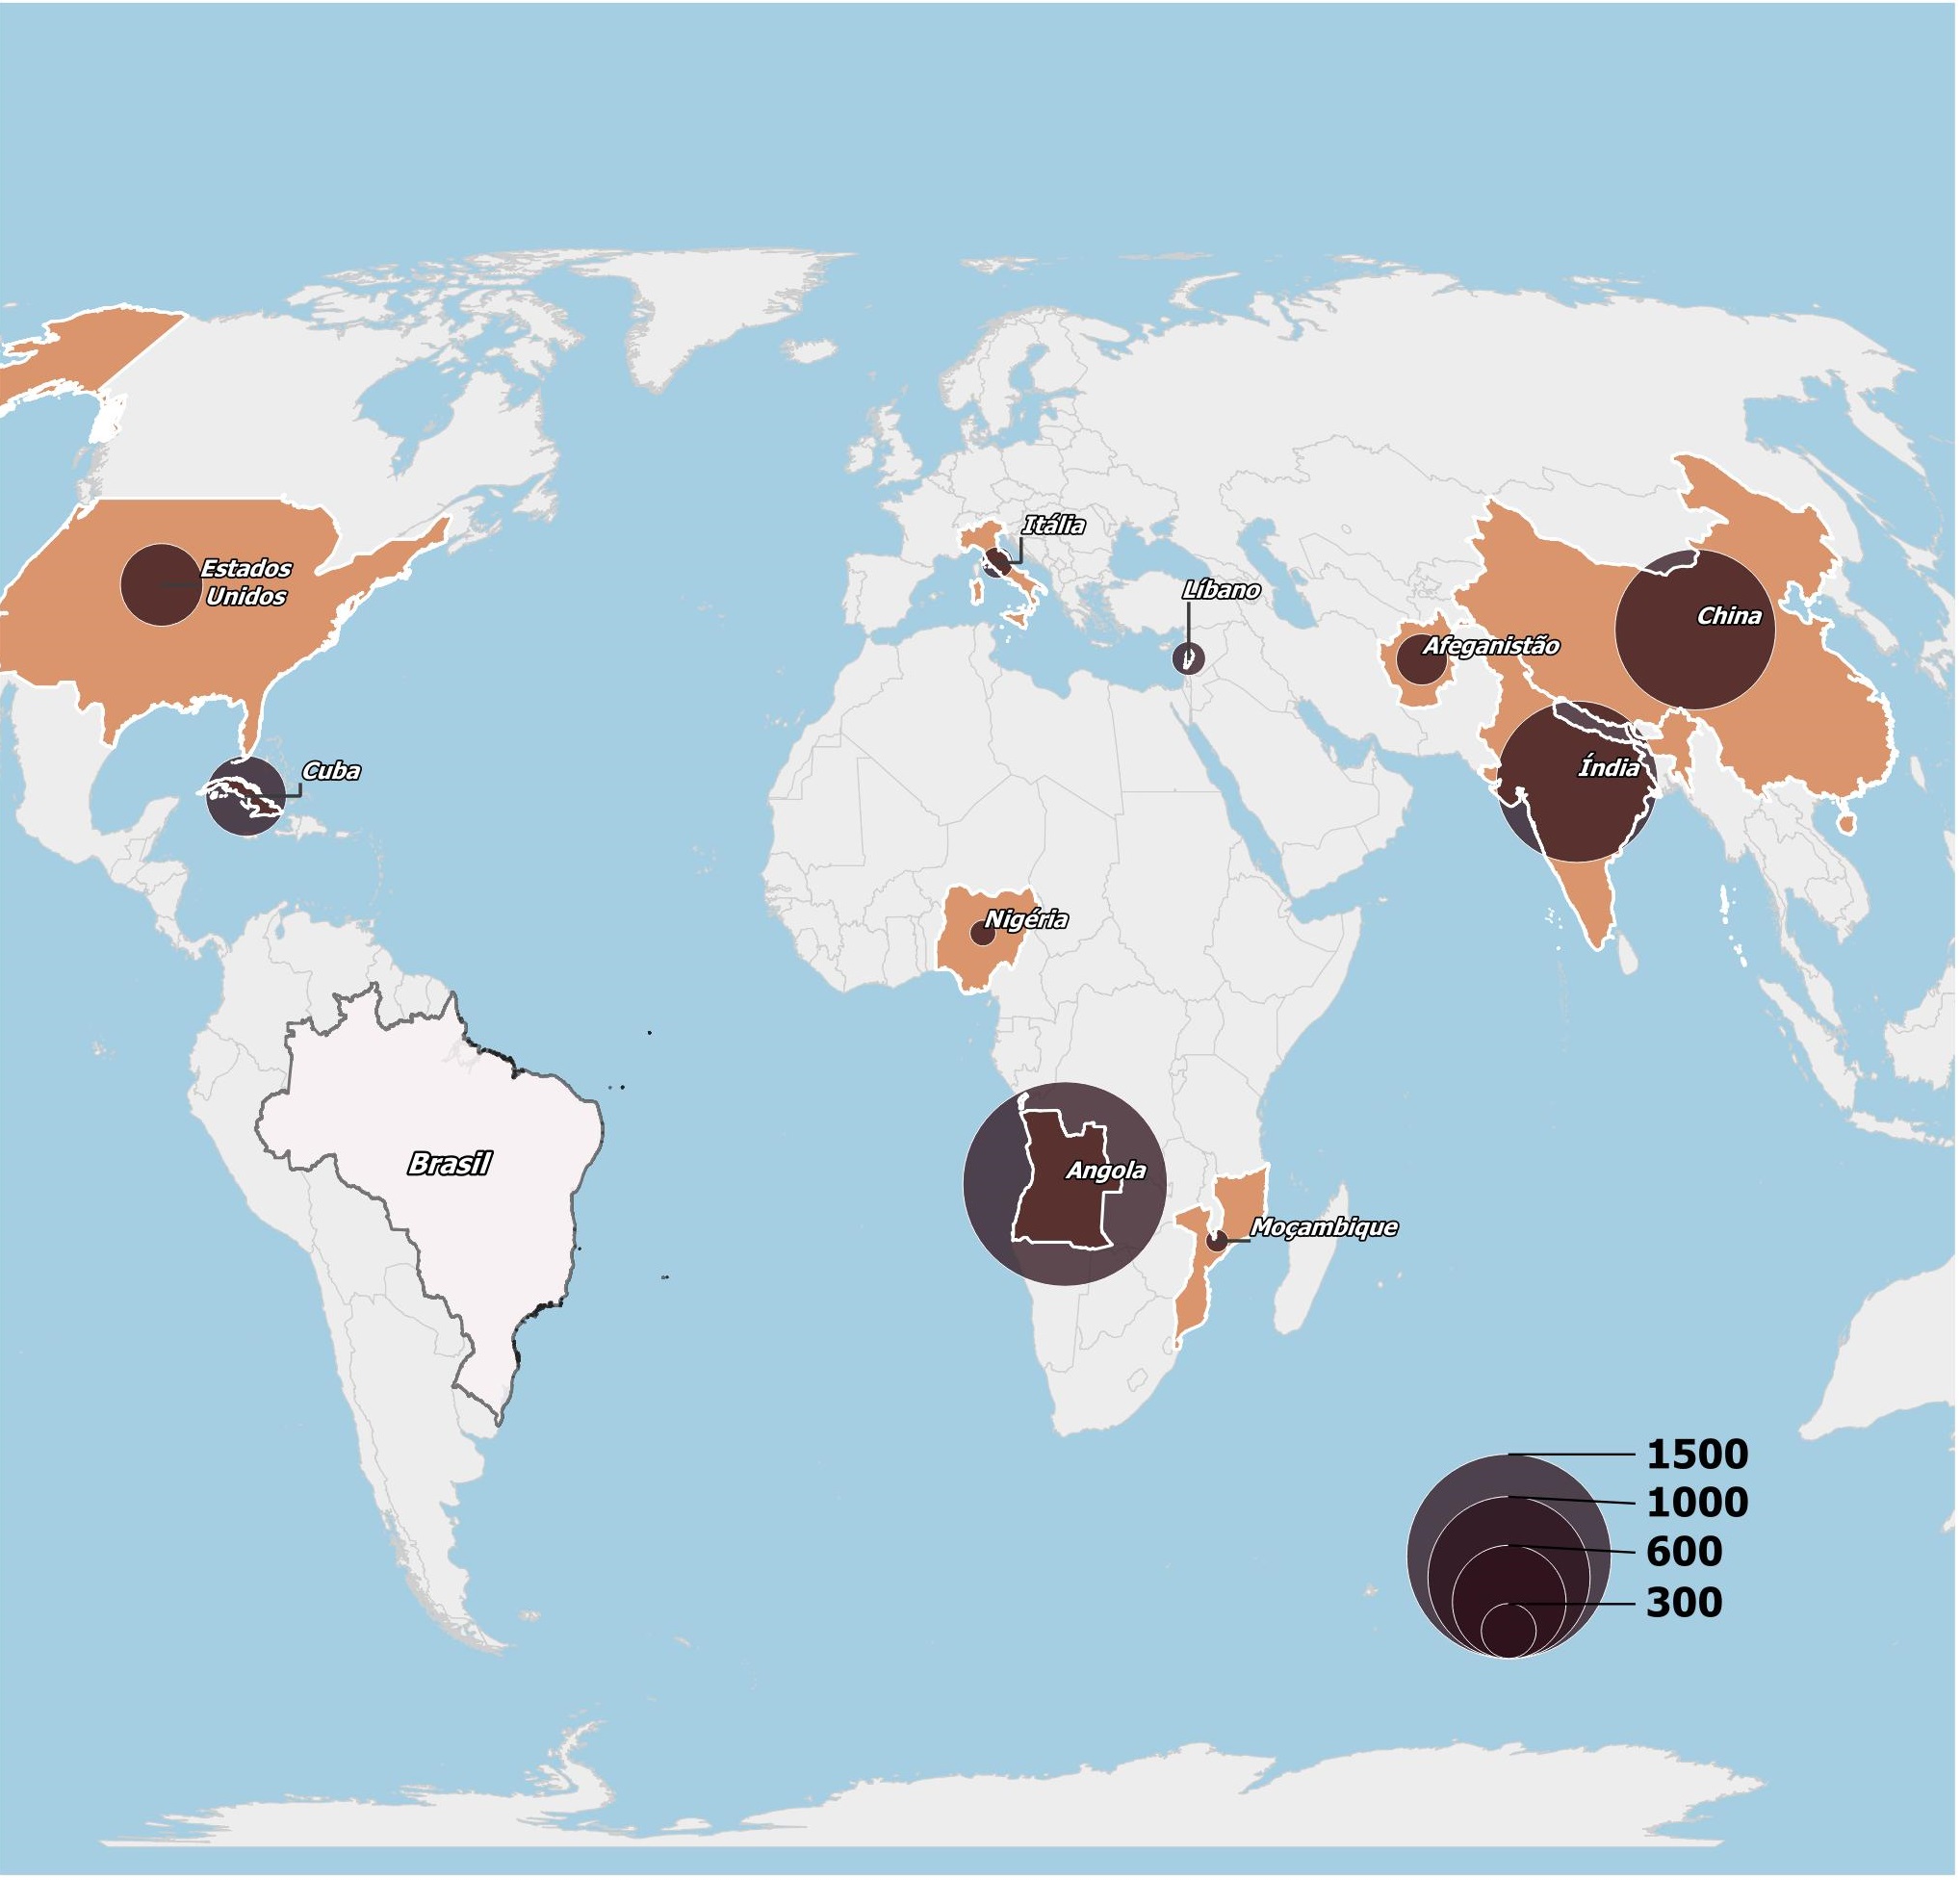
Angolans, Indians, and Chinese are the primary nationalities applying for visas to enter the country (Map 3).
The main types of visas issued are for tourism purposes, followed by those for work, with a noteworthy mention of visas granted for family
reunification (Graph 13).
GRAPH 12
Number of visas granted, by sex and main consular office locations - Brazil, November 2022.
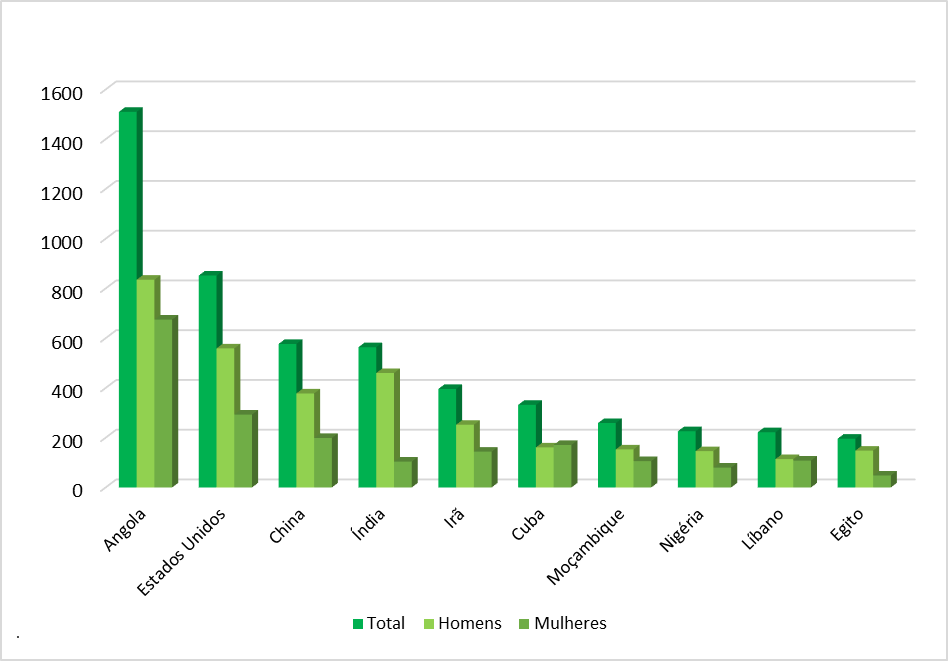
Source: OBMigra (November 2022), based on data from the Ministry of Foreign Affairs.
GRAPH 13
Number of visas granted, according to typologies - Brazil, November 2022

Source: OBMigra (November 2022), based on data from the Ministry of Foreign Affairs.
MAP 4
Number of visas granted by main nationalities - Brazil, November 2022.
Source: OBMigra (November 2022), based on data from the Ministry of Foreign Affairs.
COMO CITAR
The reproduction of this text and the data contained therein is permitted, provided that proper citation of the source is included. Reproduction
for commercial use is prohibited.
How to cite this text:
| CAVALCANTI, L; OLIVEIRA, T; FURTADO, A; DICK, P; QUINTINO, F; GUIMARÃES, B. Acompanhamento de fluxo e empregabilidade dos imigrantes no Brasil: Relatório Mensal do OBMigra Ano 3, Número 11, novembro de 2022/ Observatório das Migrações Internacionais; Brasília, DF: OBMigra, 2022. Disponível em: https://portaldeimigracao.mj.gov.br/pt/dados/relatorios-mensais |