CGIL
CGIL (General Coordination of Labor Immigration)
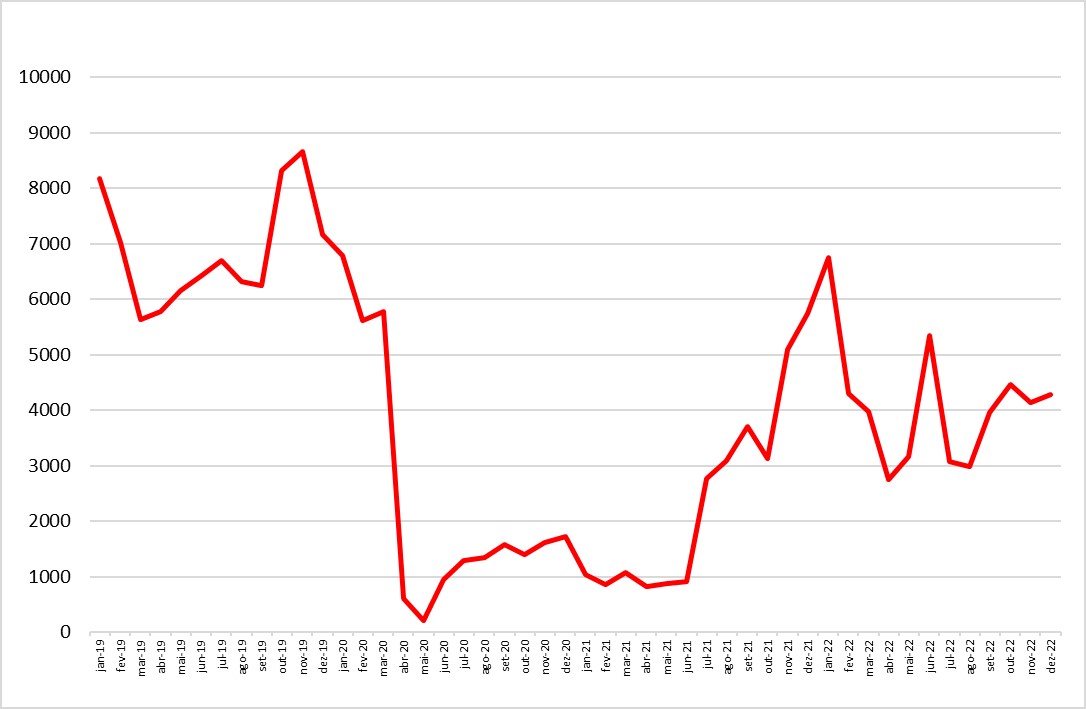
For the second consecutive month, there was a decline in the number of permits for work and investment purposes, with a negative fluctuation of approximately -2.9% compared to November (Graph 1).
Despite the overall reduction in permits, Chinese and Italian nationals showcased positive trends compared to November (Graph 2).
In December, there was an increase in the number of permits granted to qualified immigrants holding a master's degree (Graph 3).
GRAPH 1
Number of work permits for labor and investment purposes, by month of registration - Brazil, 2019-2022
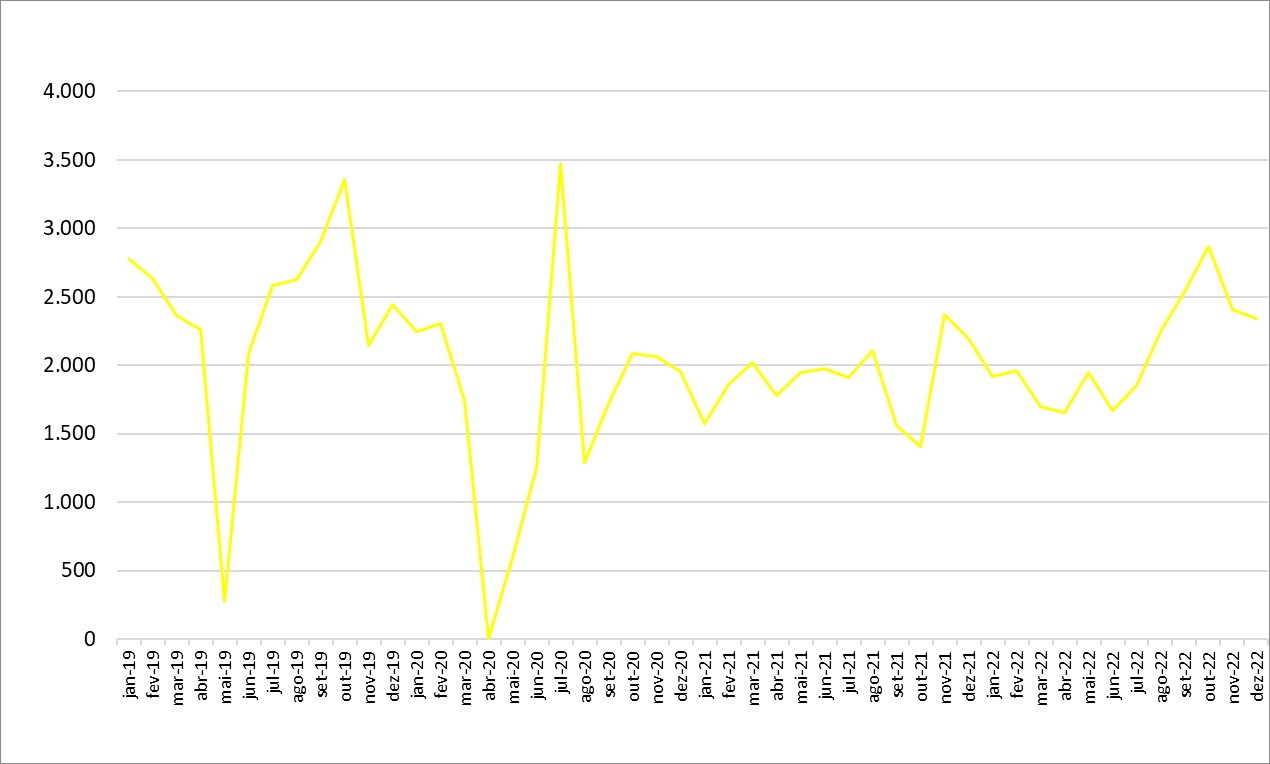
Source: OBMigra (2022), based on data from the General Coordination of Labor Immigration (CGIL).
GRAPH 2
Number of permits granted, by main countries - Brazil, November and December 2022.
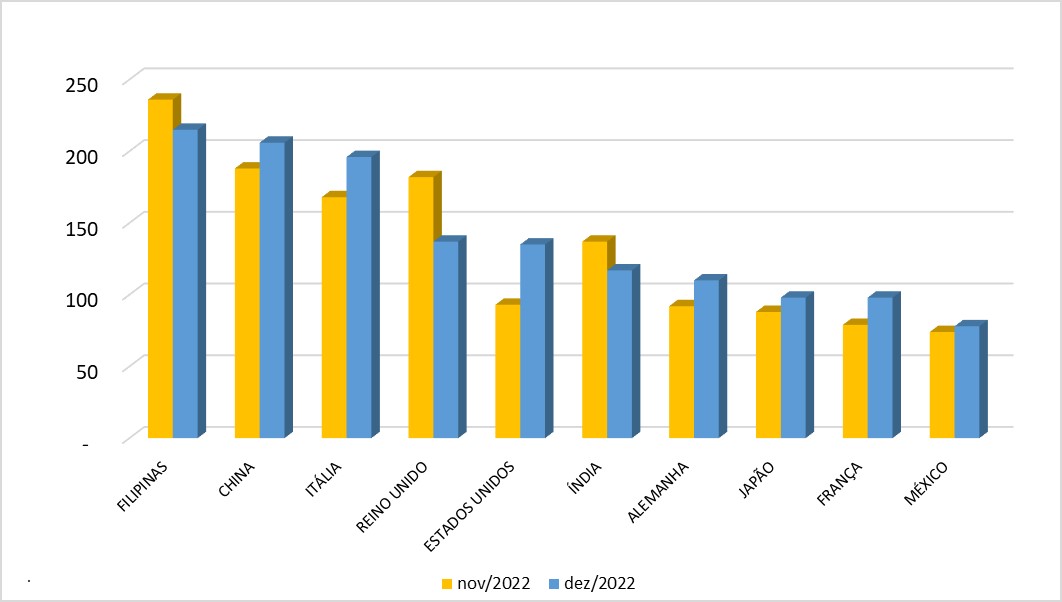 Source: OBMigra (November and December 2022),based on data from the General Coordination of Labor Immigration/Ministry of Justice and Public Security.
GRAPH 3
Number of permits granted for skilled workers, by month, according to education - October and November 2022.
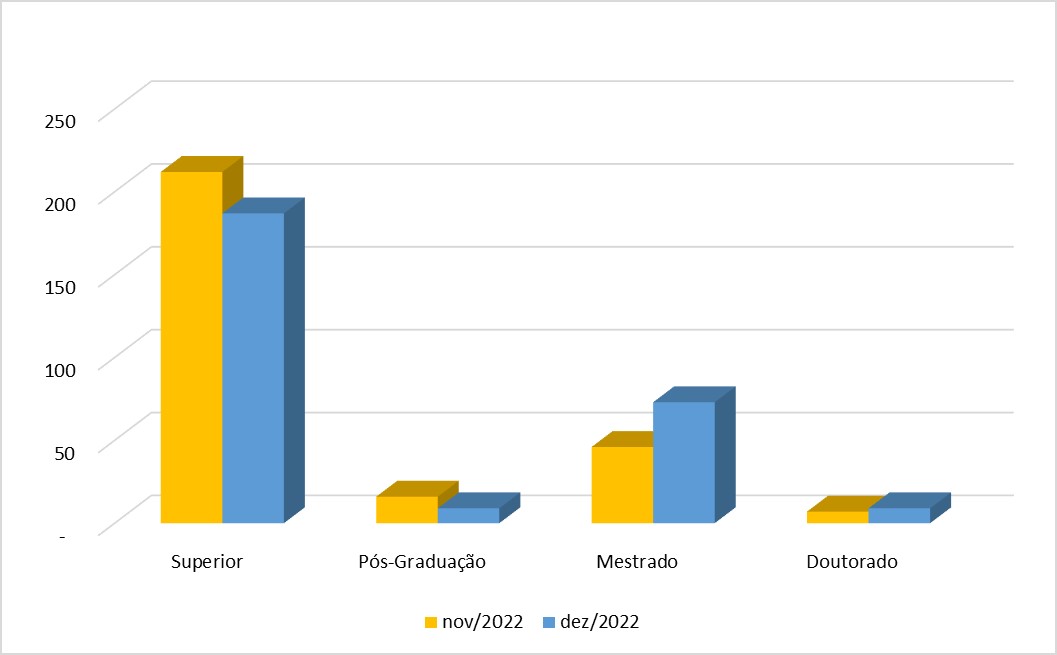
Source: OBMigra (November and December 2022), based on data from the General Coordination of Labor Immigration/Ministry of Justice and Public Security.
CTPS/RAIS/NOVO CAGED
Harmonized database Work and Social Security Card (CTPS)/Annual Report of Social Information (RAIS)/New General Register of Employed and Unemployed Persons (CAGED)
In the month of November, a sequence of decreasing job openings for immigrants was interrupted (Graph 4). This phenomenon was primarily due to a slowdown in the rate of layoffs observed during the month.
Venezuelans were the nationality that benefited the most from the creation of jobs in November (Graph 5).
The South Region continues to lead in terms of registering the highest positive balance in the formal labor market for immigrants (Map 1).
.
GRAPH 4
Jobs created for immigrants in the formal labor market, by month - Brazil, 2019/2022
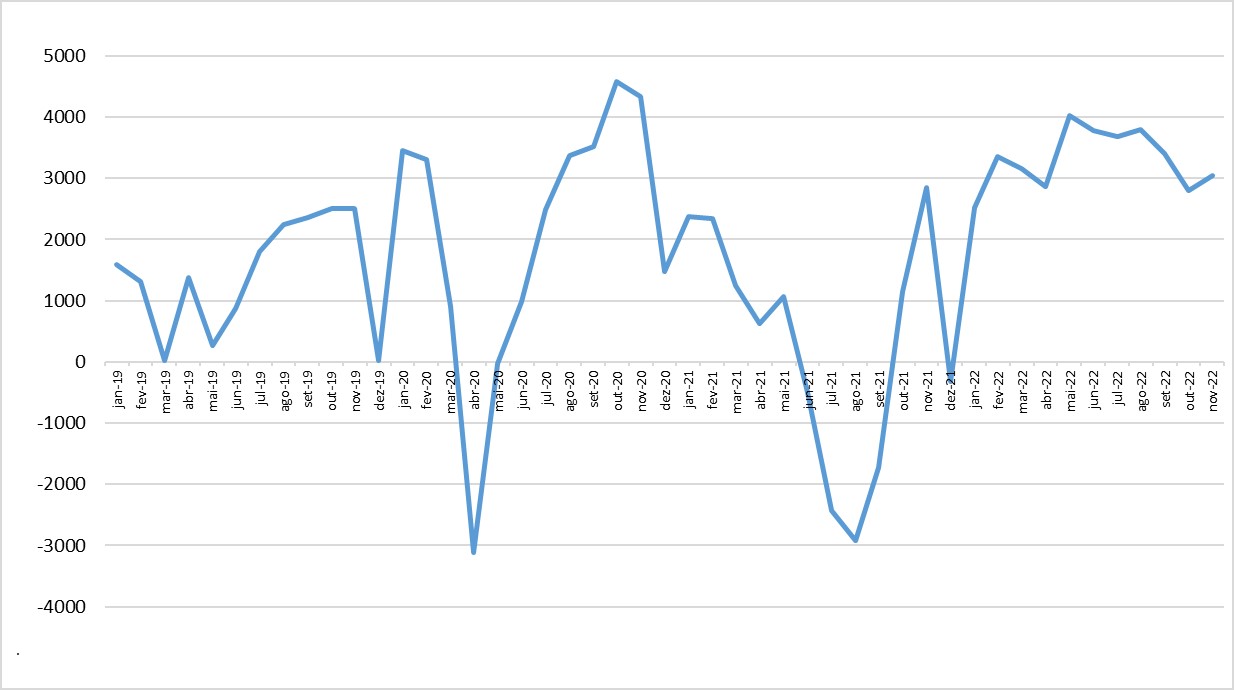
Source: OBMigra (2022), based on data from the harmonized database RAIS-CTPS-CAGED and the Digital System of Tax, Social Security and Labor Obligations (eSocial).
GRAPH 5
Movement of migrant workers in the formal labor market, by sex and main countries - Brazil, November 2022.
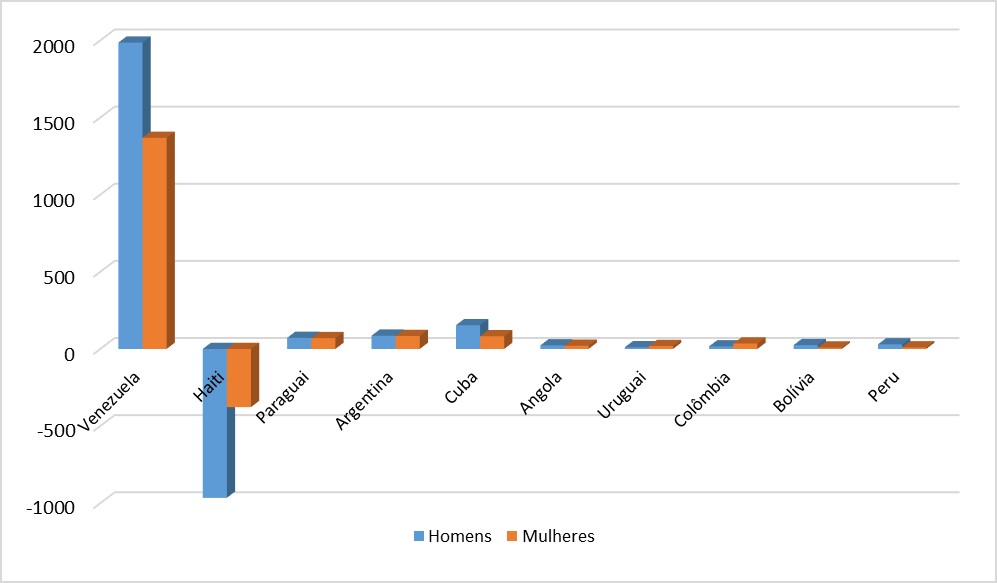
Source: OBMigra (November 2022), based on data from the Ministry of Economy, Harmonized database RAIS-CTPS-CAGED.
MAP 1
Number of jobs created for immigrants, according to Regions, November 2022.
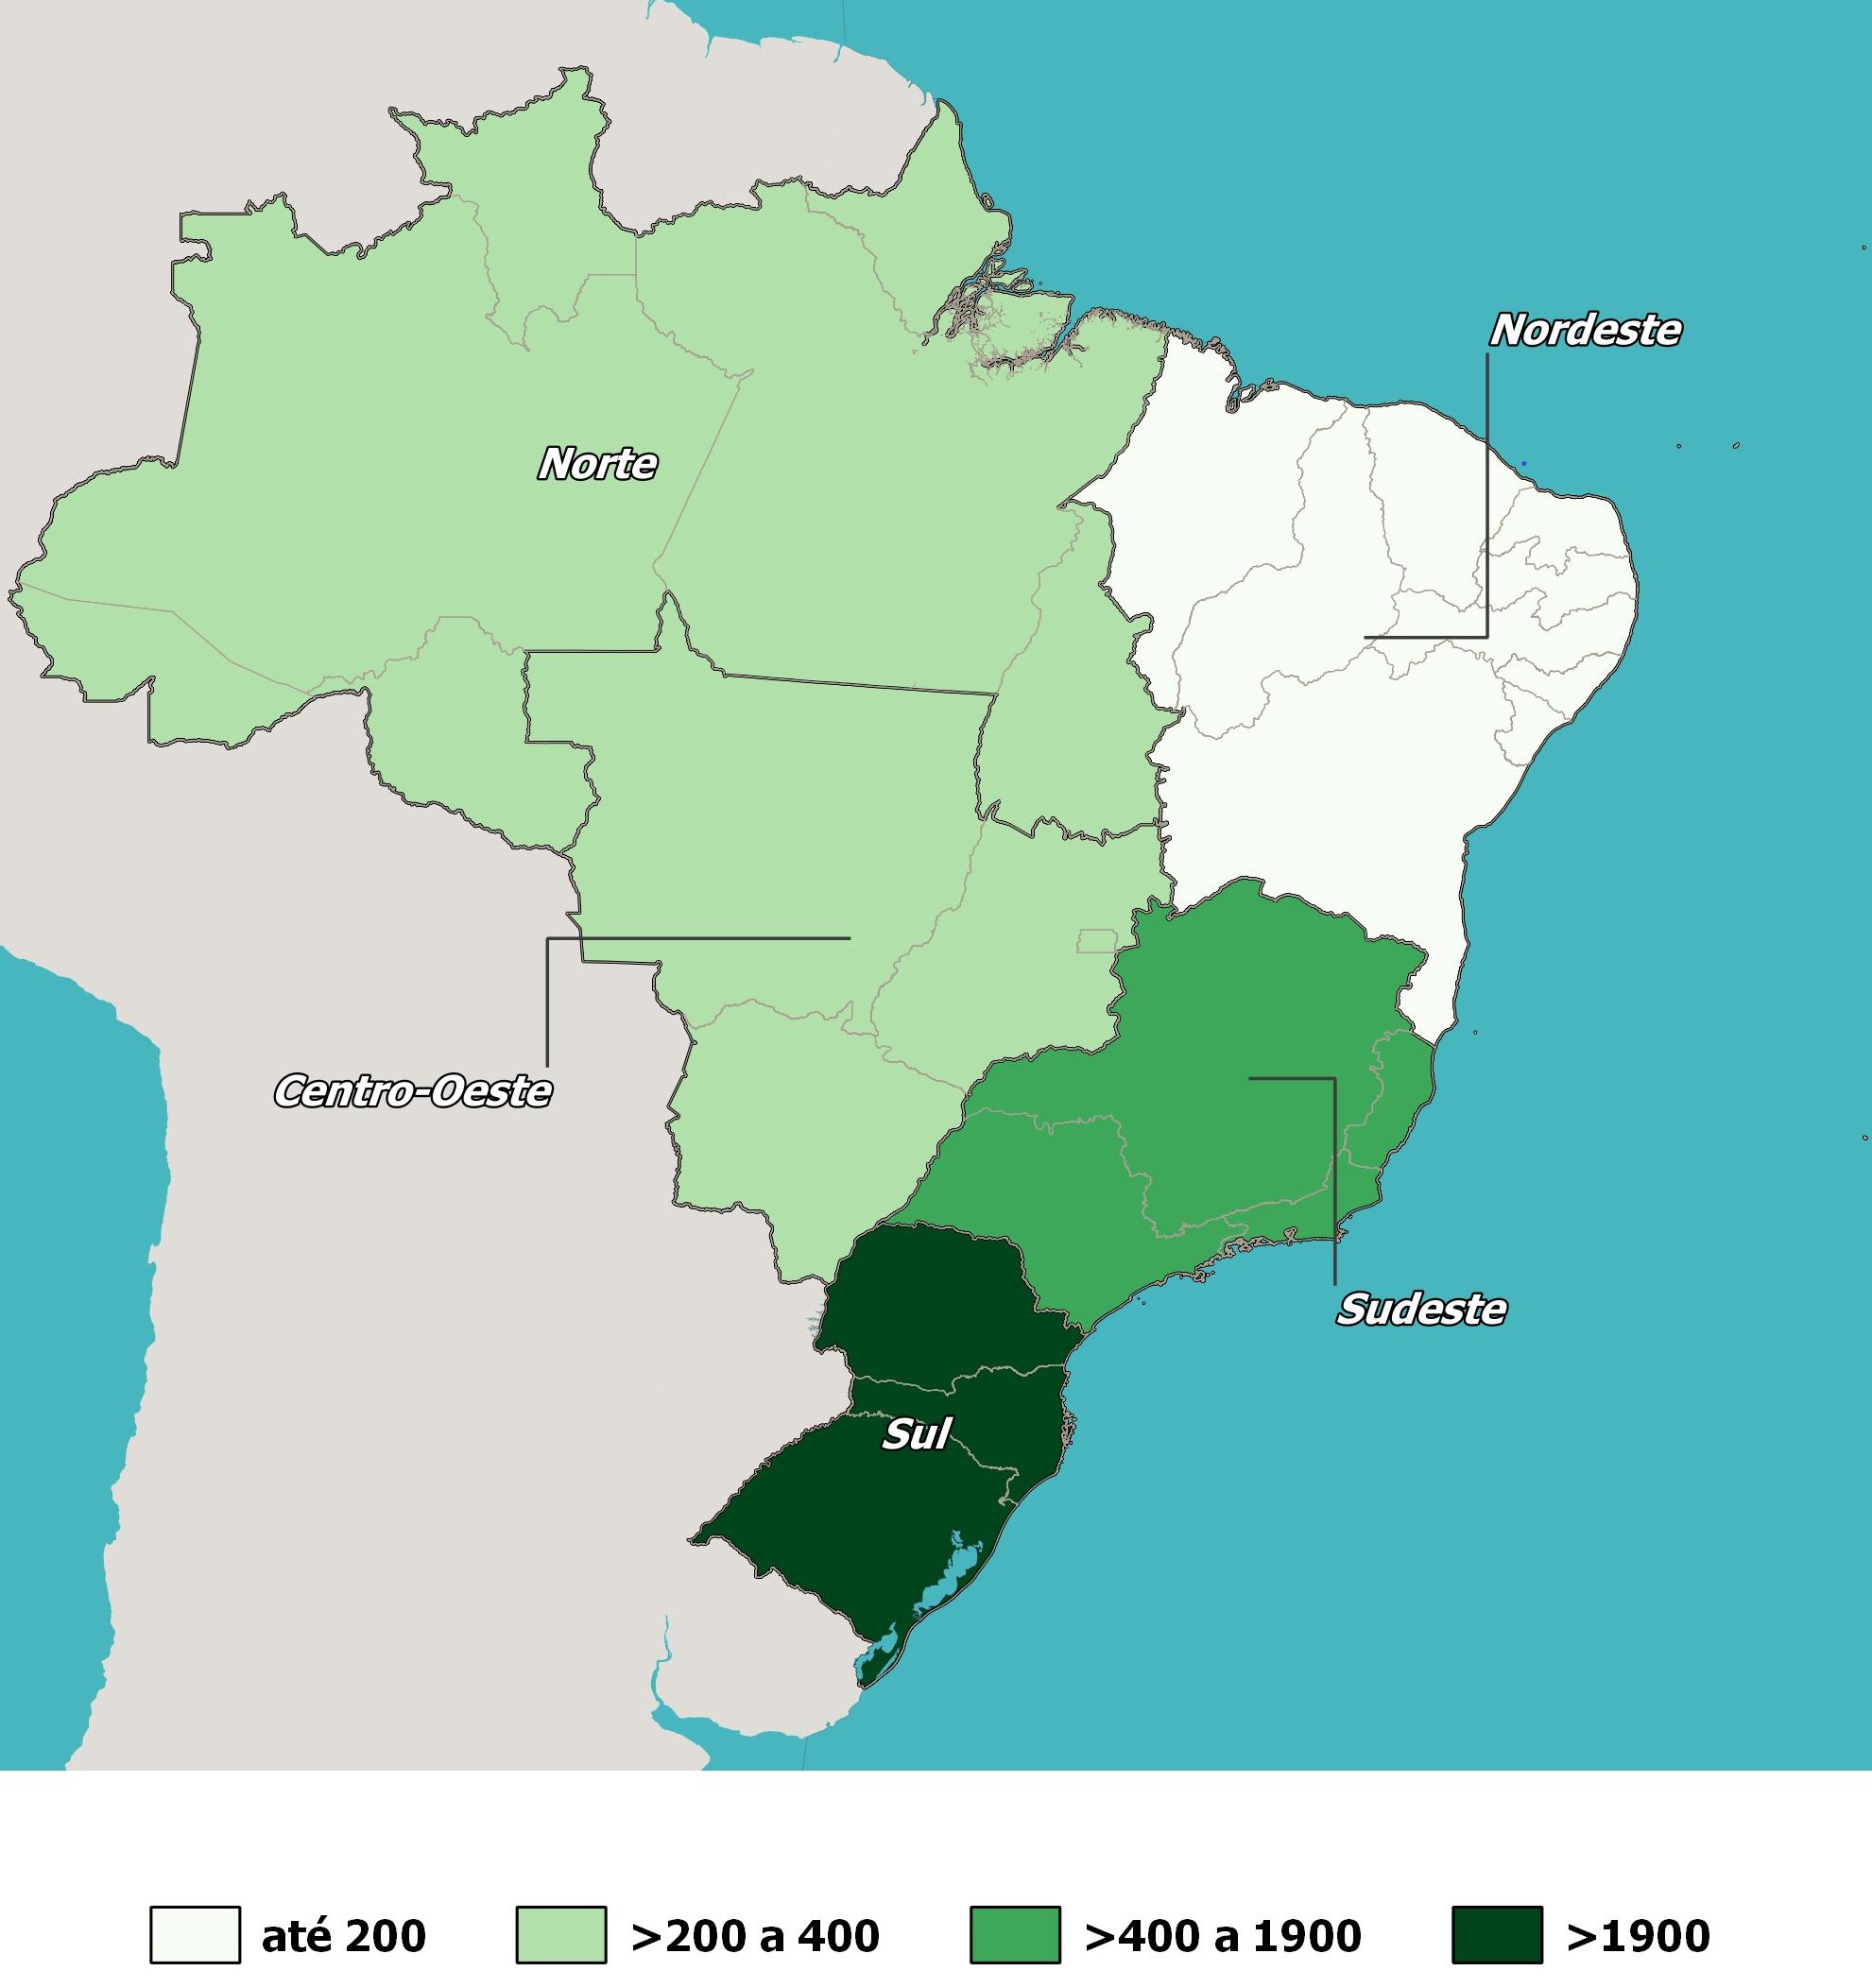
Source: OBMigra (November 2022), based on data from the Ministry of Economy, Harmonized database RAIS-CTPS-CAGED.
STI
STI (International Traffic System)
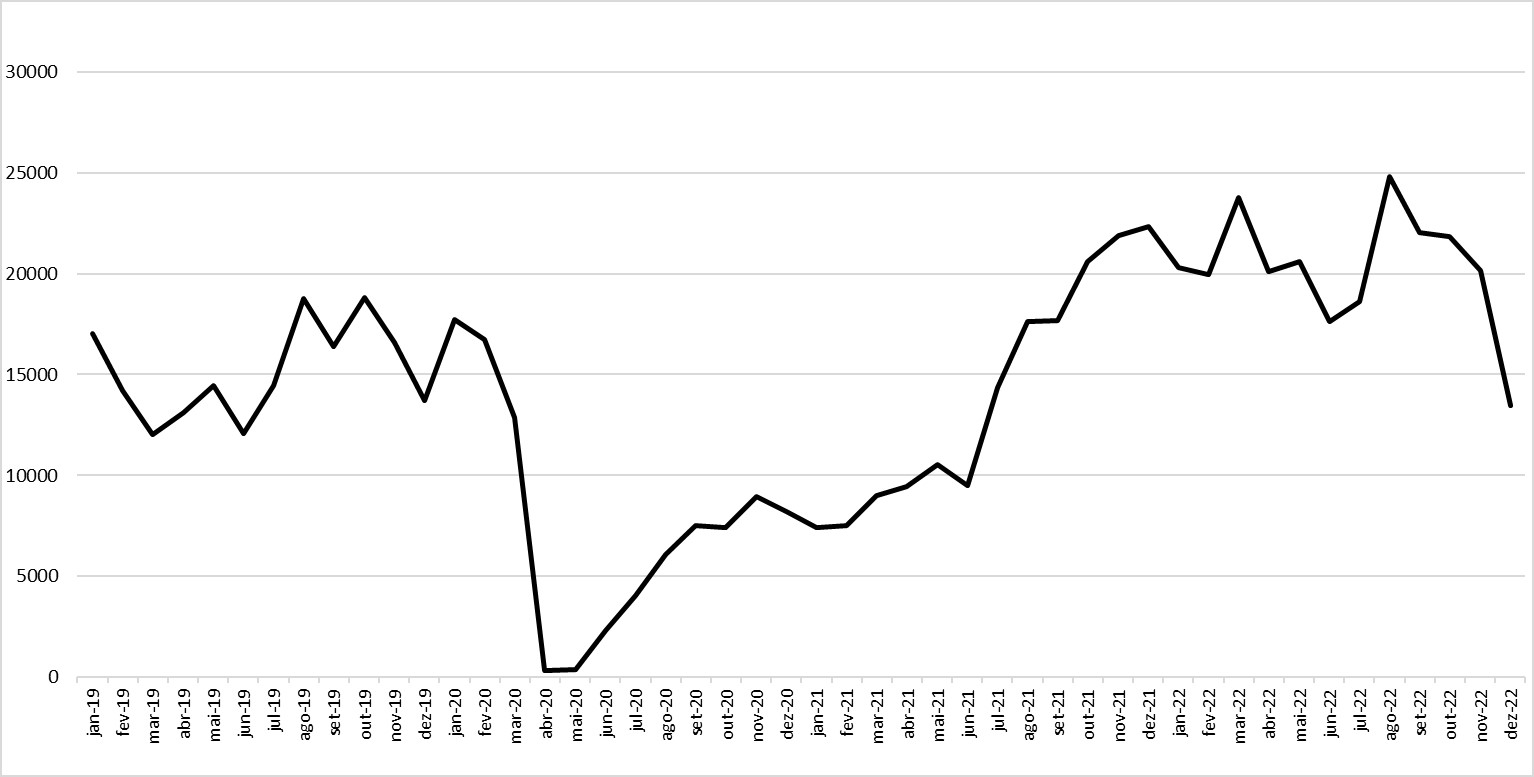
The recovery in cross-border movements of people has been slow and gradual, persisting in December and approaching the low point observed prior to the COVID-19 pandemic in May 2019 (Graph 6).
For the second consecutive month, the balance between arrivals and departures remained positive, primarily due to the increased movement of tourists (Graph 7).
GRAPH 6
Cross-border movements, by month of registration, Brazil 2019/2022
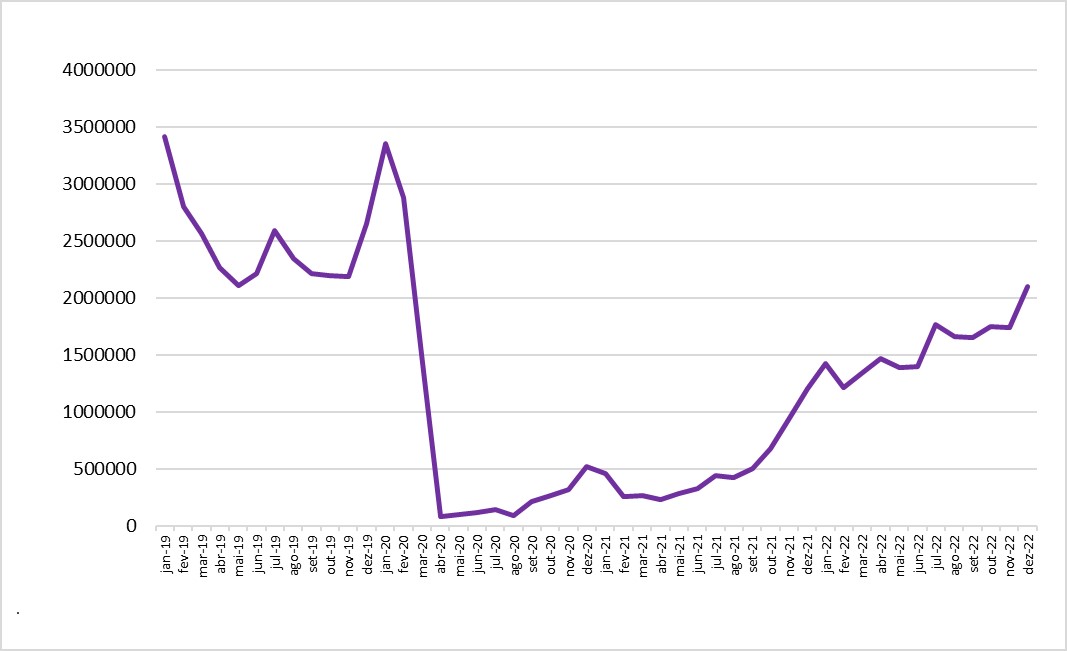
Source: OBMigra (2022), based on data from the Brazilian Federal Police, International Traffic System (STI).
GRAPH 7
Balance of the cross-border movements of people, according to typology - Brazil, November and December 2022.
.
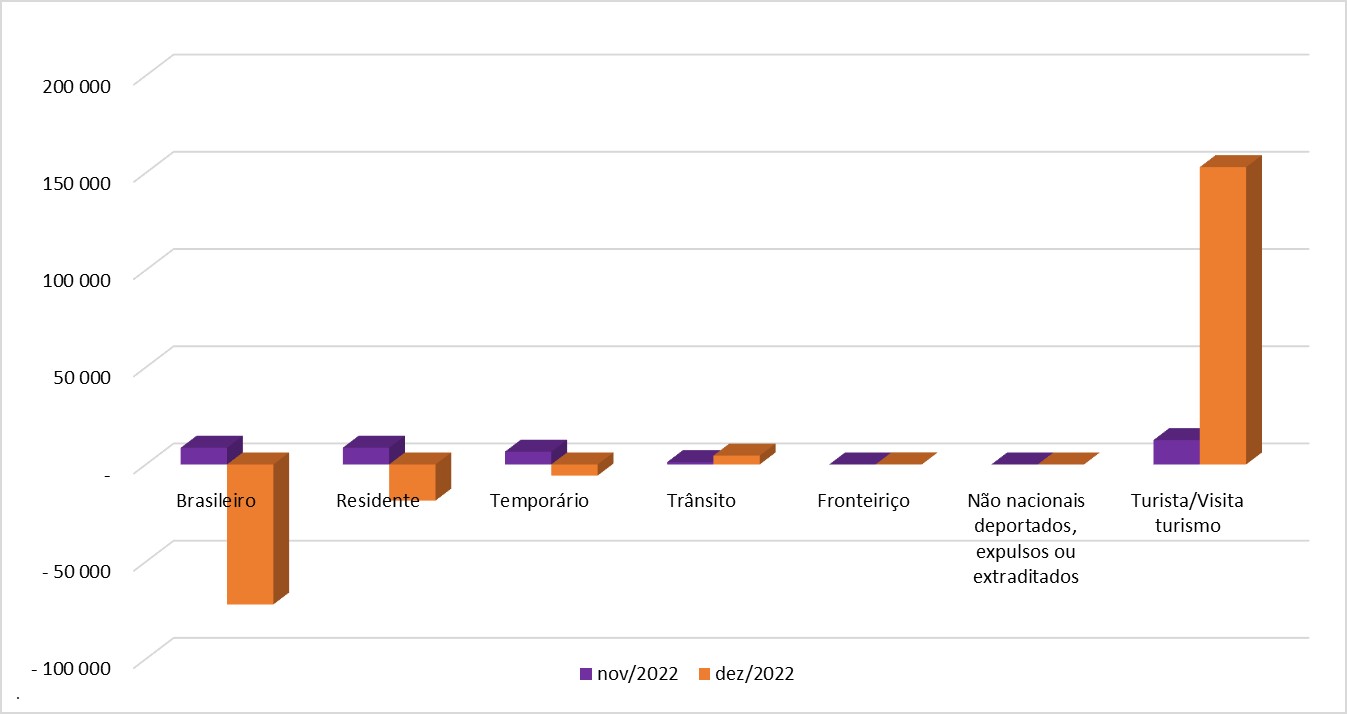
Source: OBMigra (December 2022), based on data from the Brazilian Federal Police, International Traffic System (STI).
SISMIGRA
SisMigra (National Migration Registry System)
Since September, there has been a downward trend in the number of residence application registrations, and in December, the reduction was -33.2% compared to the previous month (Graph 8).
Among the top ten nationalities, only Peruvians did not have a negative variation in the month (Graph 9).
Despite the decrease in the number of residence request registrations, Venezuelans remain the primary nationality (Map 2).
GRAPH 8
Number of immigrant registrations, by month of registration - Brazil, 2019/2022
Source: OBMigra (2022), based on data from the Brazilian Federal Police, National Migration Registry System (SISMIGRA).
GRAPH 9
Variation in immigrant registrations by main countries - Brazil, November 2022.
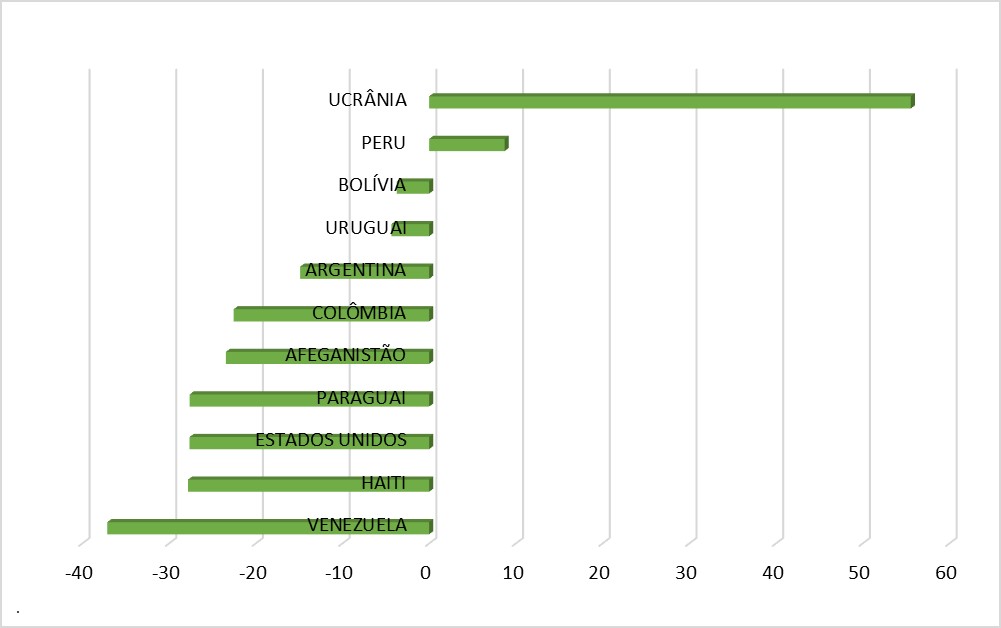
Source: OBMigra (December 2022), based on data from the Brazilian Federal Police, National Migration Registry System (SISMIGRA).
MAP 2
Number of immigrant registrations, by main countries of birth, December 2022.
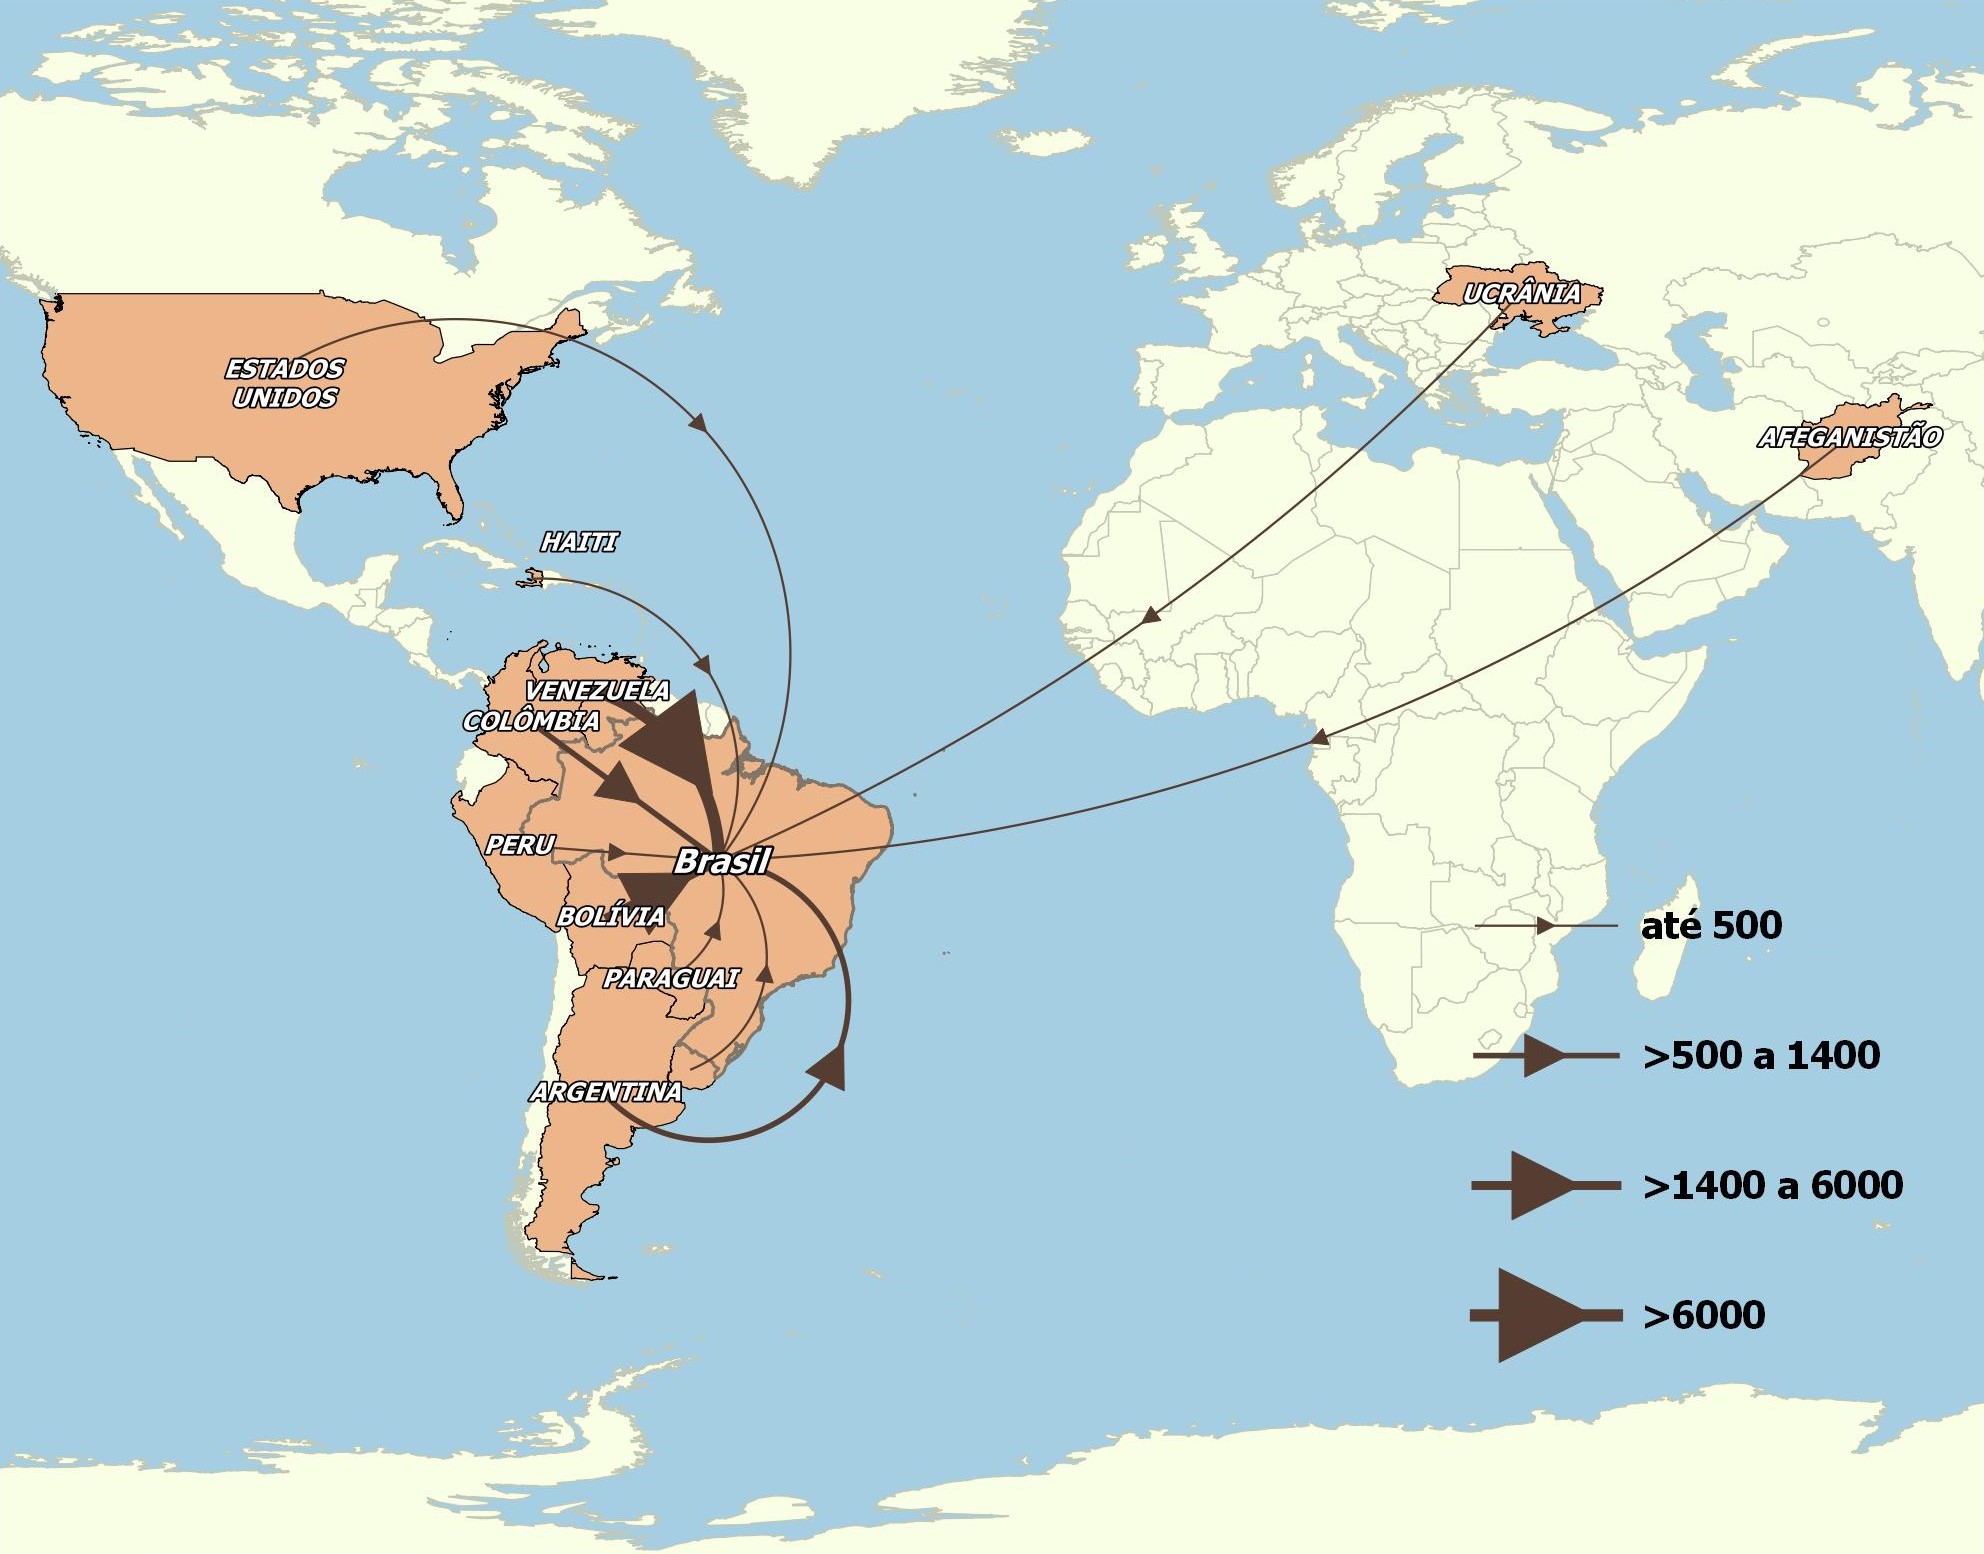
Source: OBMigra (December 2022), based on data from the Brazilian Federal Police, National Migration Registry System (SISMIGRA).
Solicitantes
Applicants for refugee status recognition
Since September of this year, the number of applications for recognition of refugee status has hovered around 4,000 requests (Graph 10).
While Pacaraima/RR remains the primary city for receiving requests for recognition of refugee status (Graph 11), Boa Vista experienced a positive variation of 22.5% compared to November.
Venezuelans were the primary nationality seeking asylum recognition, followed by Cubans and Angolans (Map 2).
GRAPH 10
Number of applications for recognition of refugee status, by month of registration - Brazil, 2019-2022
Source: OBMigra (2022), based on data from the Brazilian Federal Police, Asylum Claims, and the System of the National Committee for Refugees (SISCONARE).
GRAPH 11
Number of applications for recognition of refugee status, by main municipalities - Brazil, December 2022.
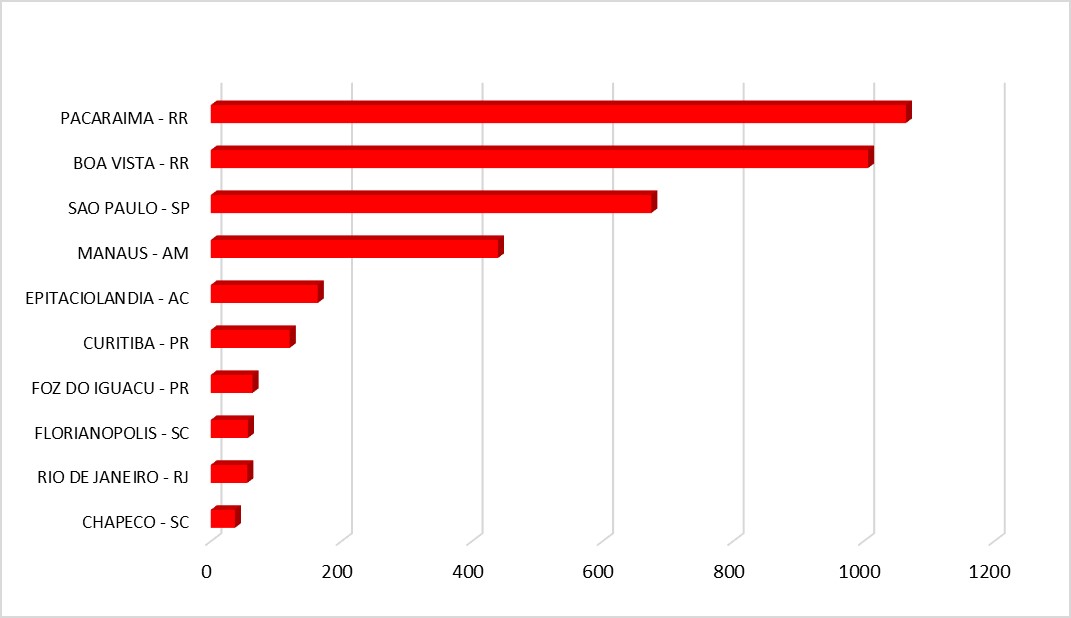
Source: OBMigra (December 2022), based on data from the Brazilian Federal Police, Asylum Claims..
MAP 3
Number of applications for recognition of refugee status, according to main countries, December 2022
Source: OBMigra (December 2022), based on data from the Brazilian Federal Police, Asylum Claims.
MRE
MRE - Ministry of Foreign Affairs
The historical series of visa issuances has been available since January 2021. During this period, there is a clear growth trend in registrations, with minor interruptions, particularly in February and December 2022 (Graph 12).
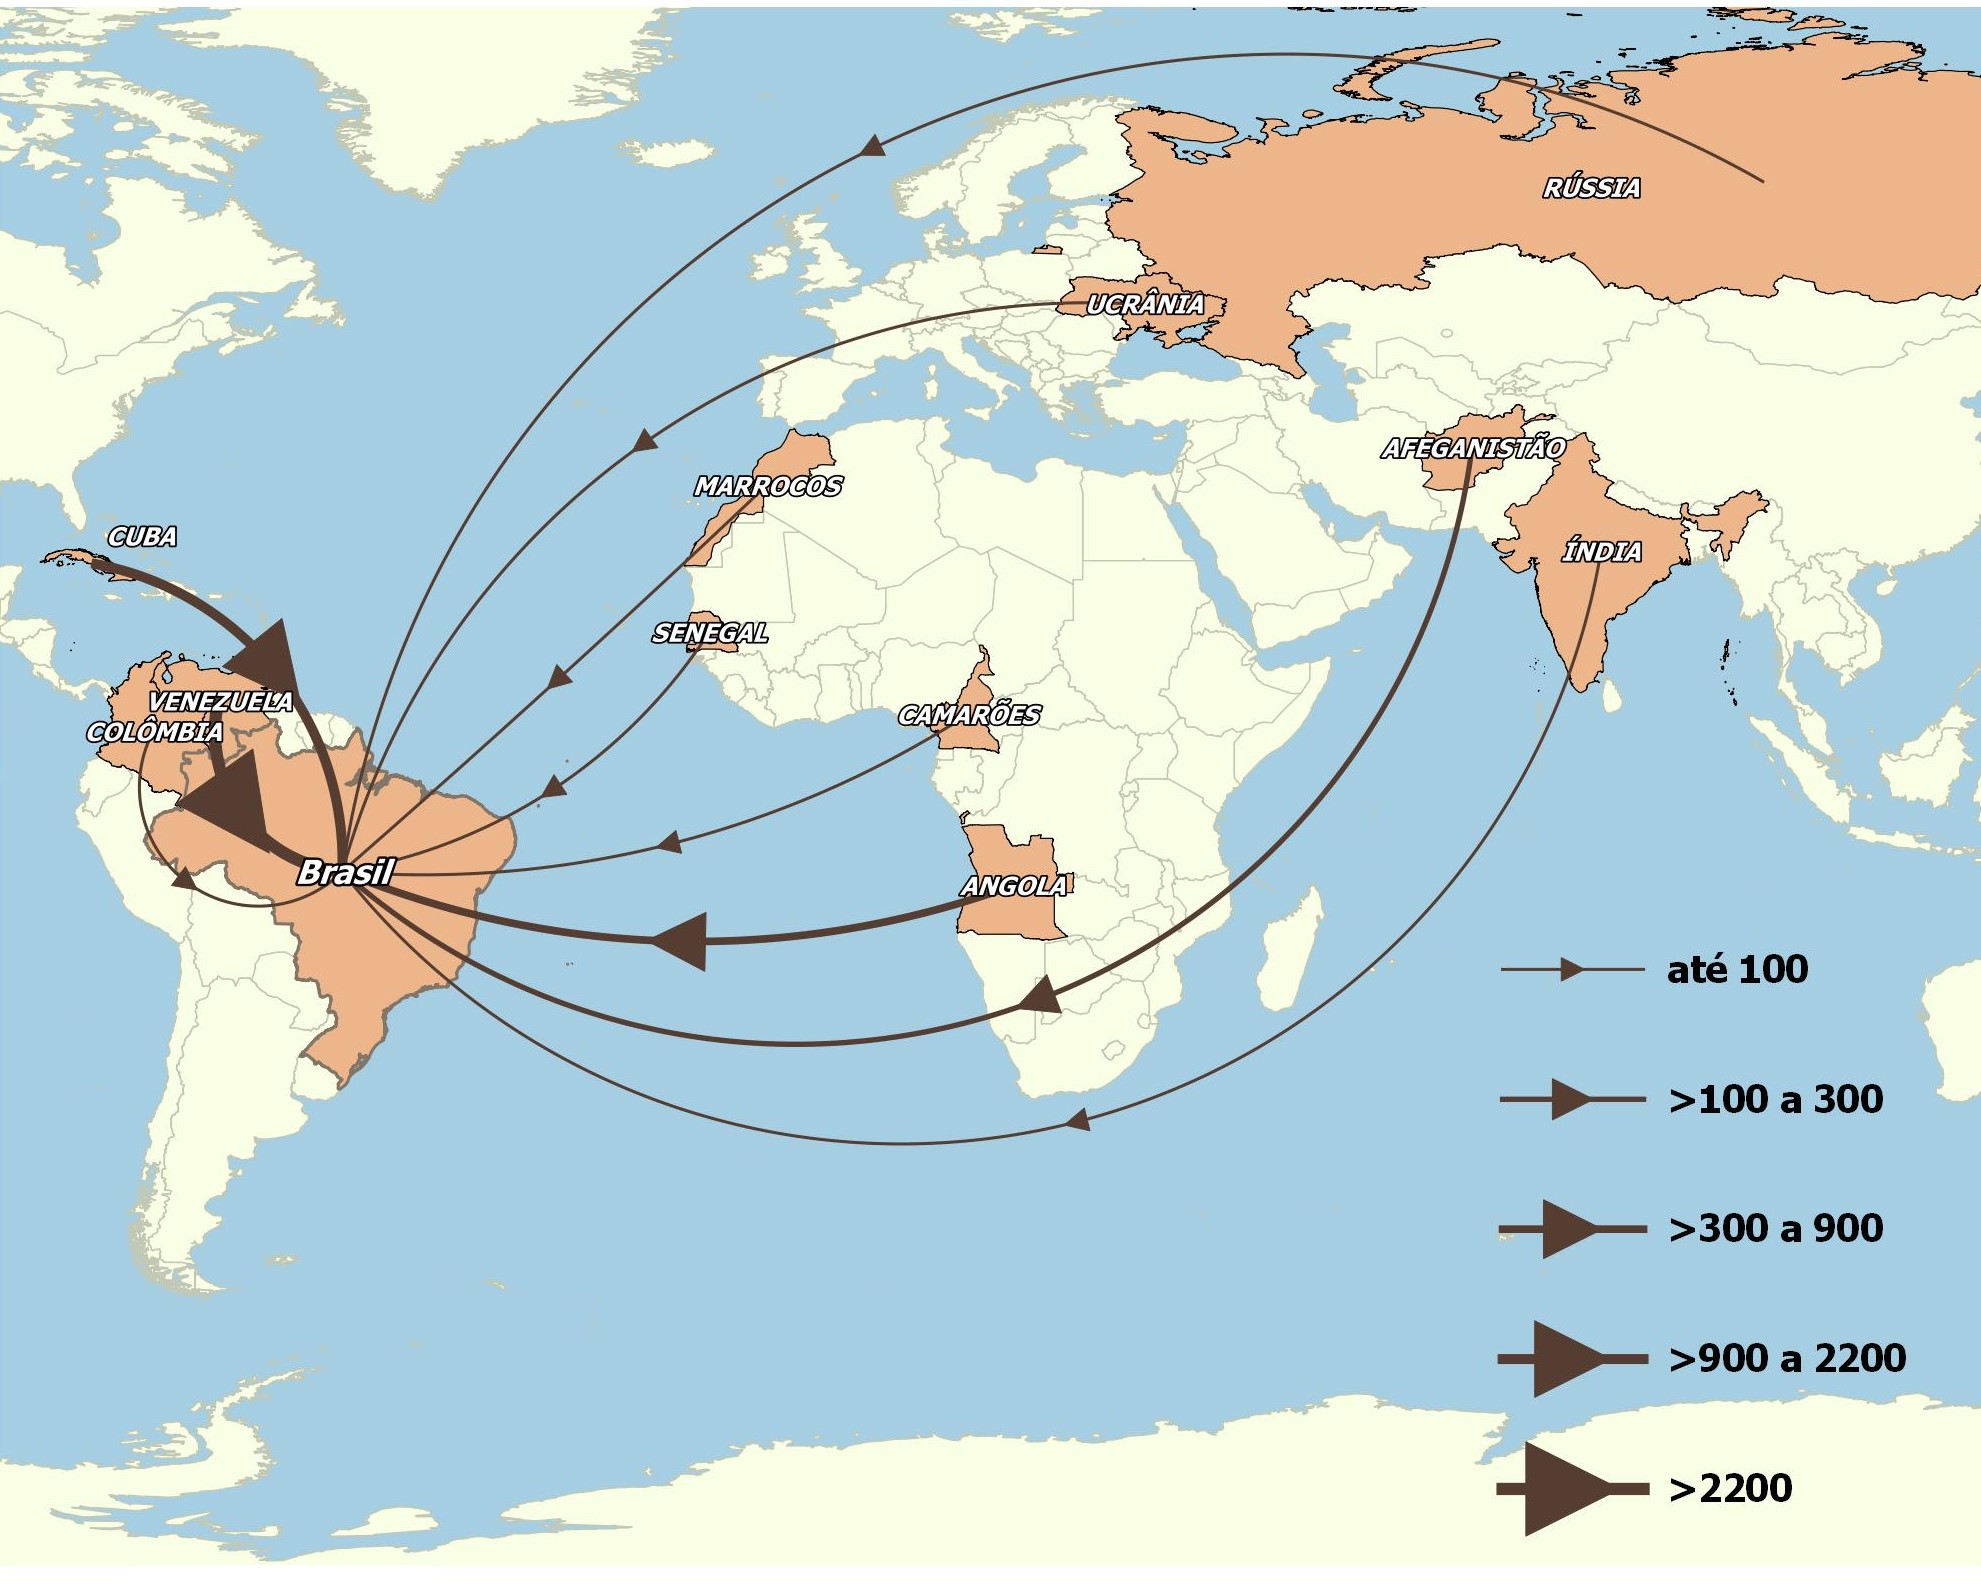
Angolans, Indians, and Chinese continued to be the nationalities that obtained the highest number of entry visas to the country (Map 4).
There was a reduction of approximately -18.5% in the issuance of visas compared to November, primarily due to a decrease in visit and work visas (Graph 13).
GRAPH 12
Number of visas issued by consular offices - Brazil, 2021-2022
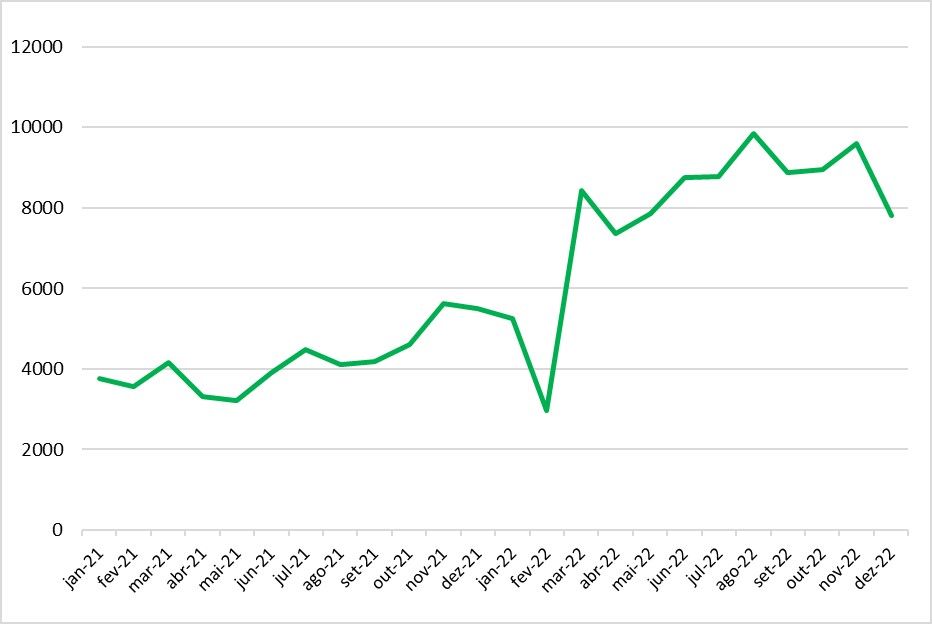
Source: OBMigra (2022), based on data from the Ministry of Foreign Affairs.
GRAPH 13
Number of visas granted, according to typologies - Brazil, November and December 2022.
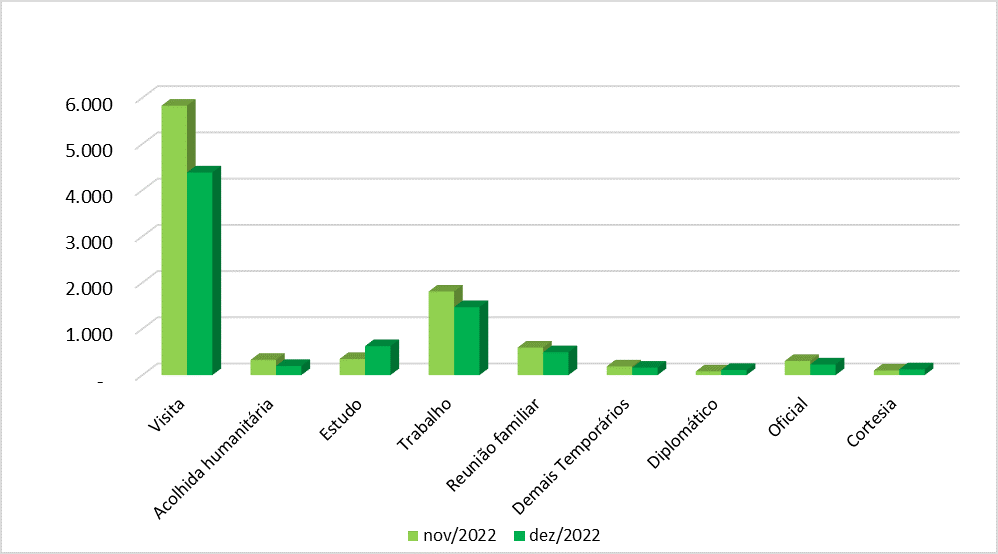
Source: OBMigra (November 2022), based on data from the Ministry of Foreign Affairs.
MAP 4
Number of visas granted by main nationalities - Brazil, December 2022.
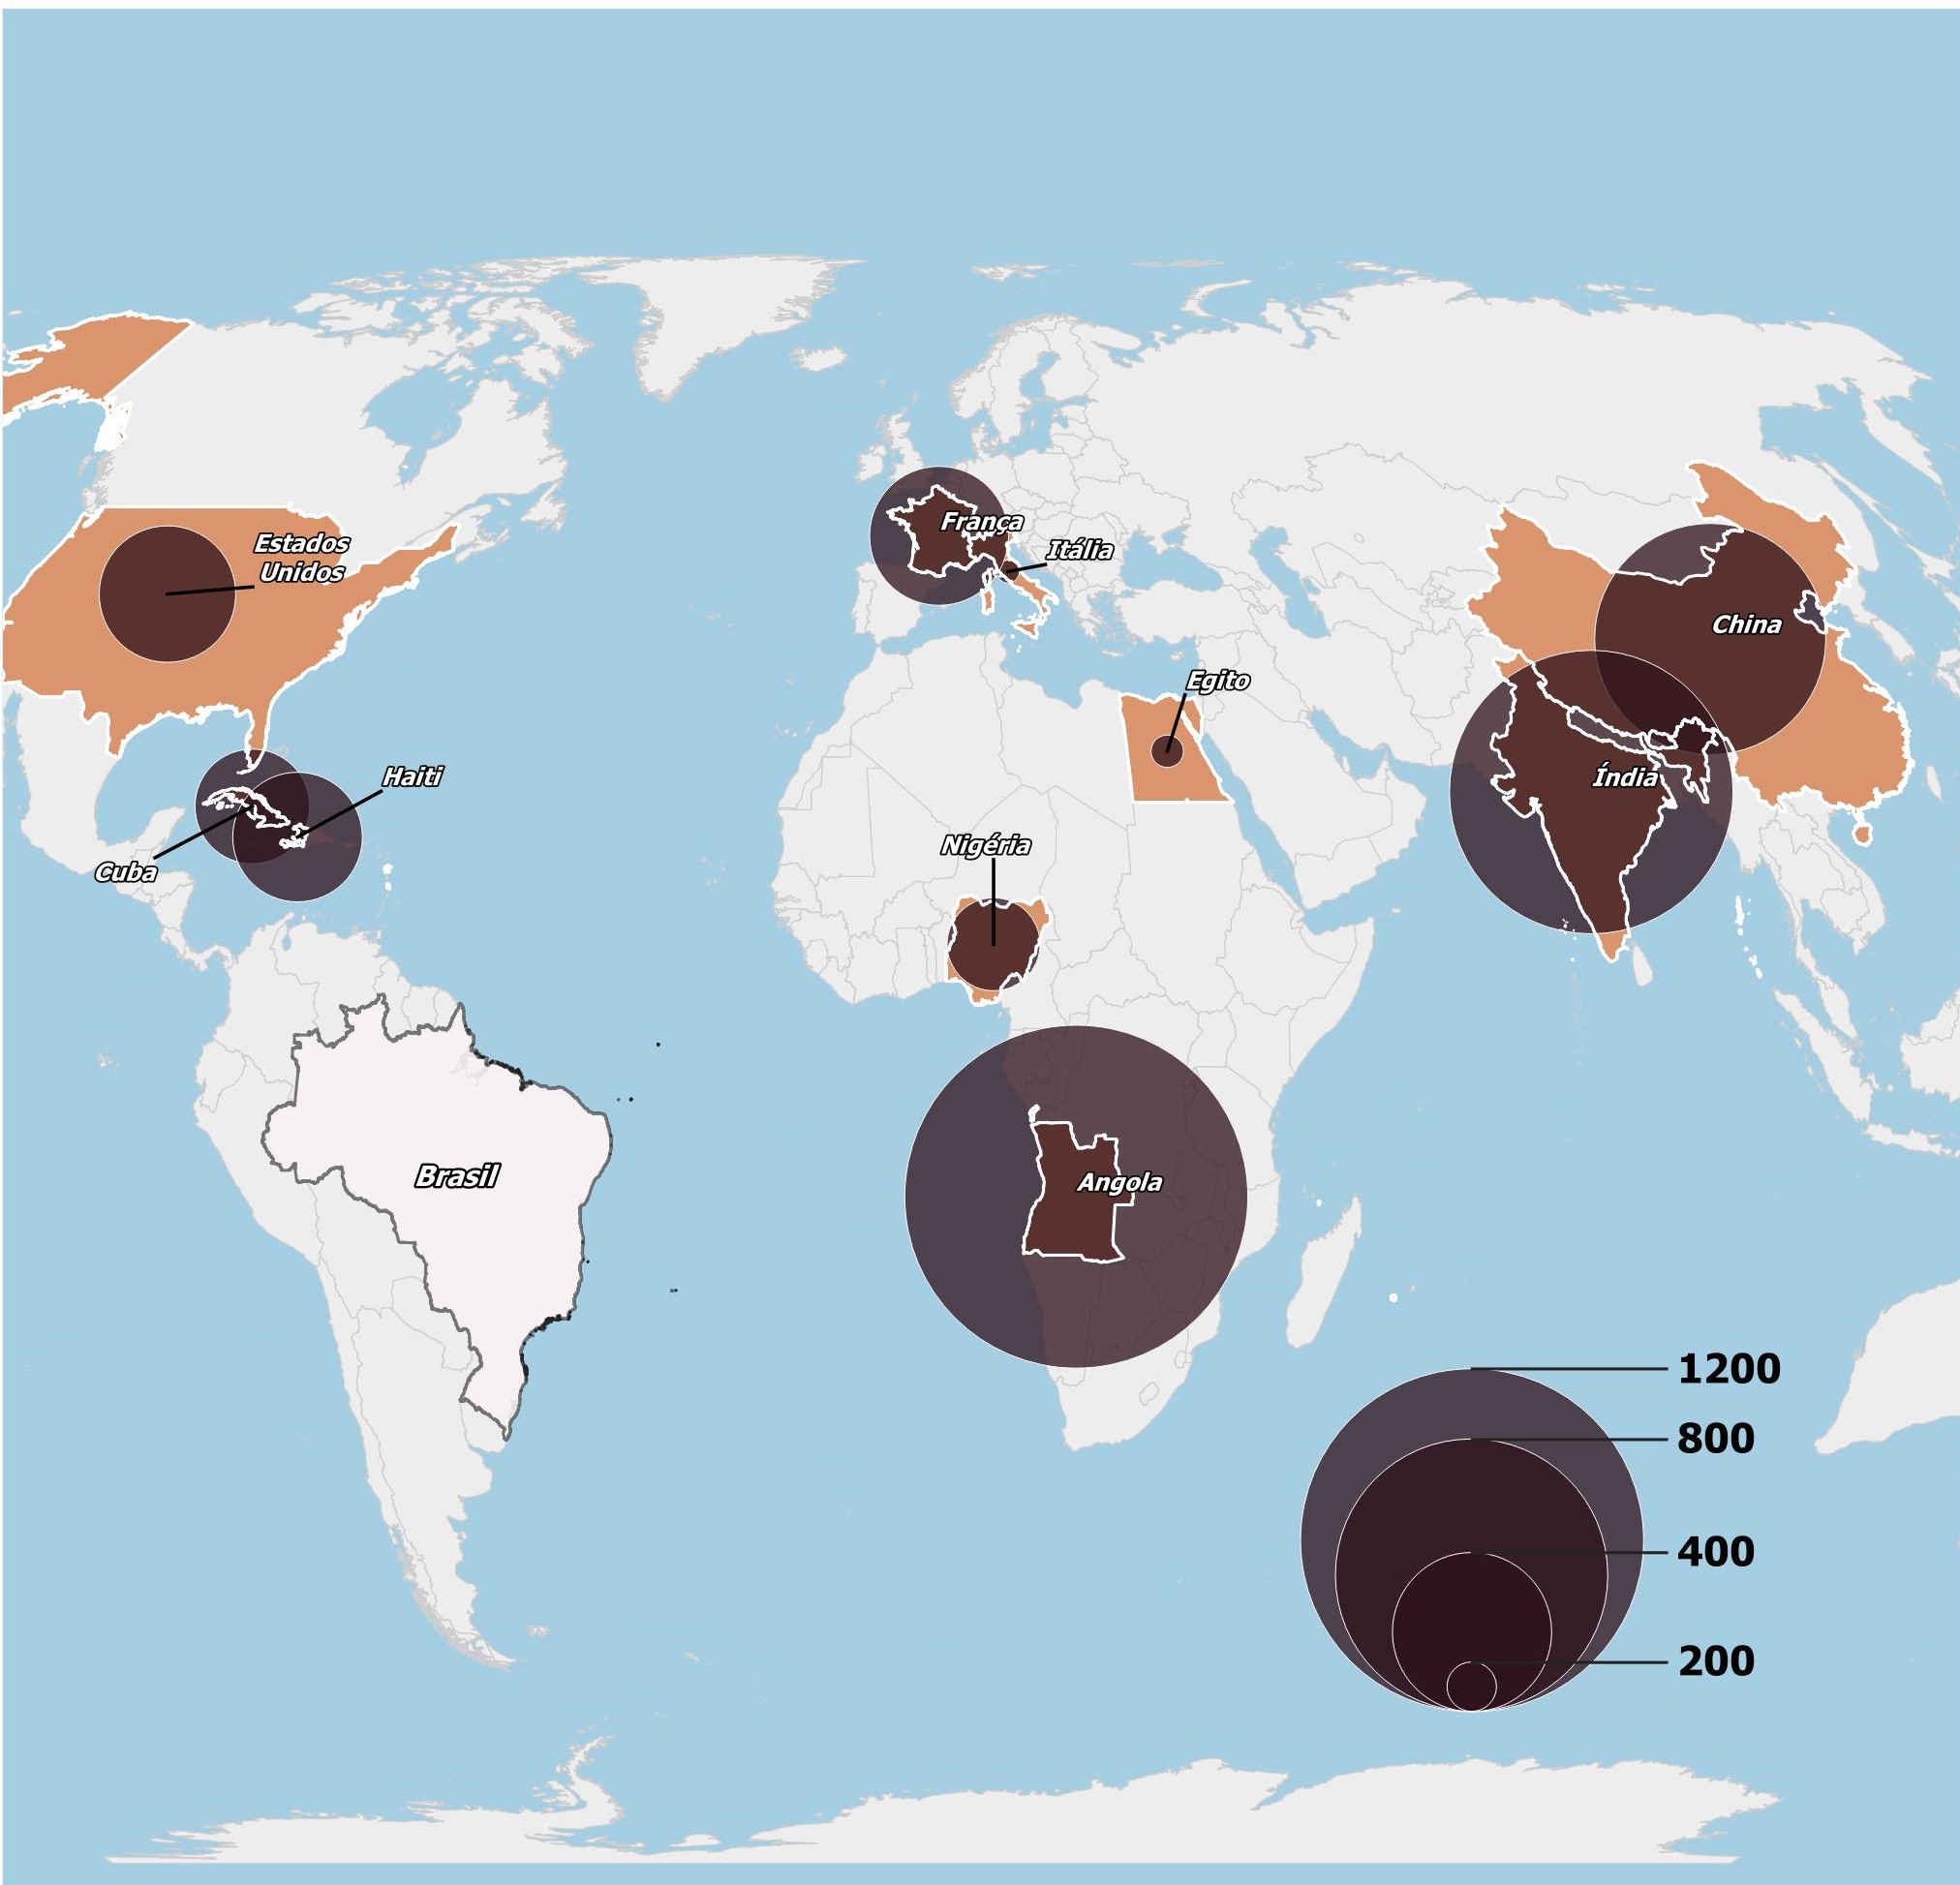
Source: OBMigra (December 2022), based on data from the Ministry of Foreign Affairs.
COMO CITAR
The reproduction of this text and the data contained therein is permitted, provided that proper citation of the source is included. Reproduction for commercial use is prohibited.
How to cite this text:
| CAVALCANTI, L; OLIVEIRA, T; FURTADO, A; DICK, P; QUINTINO, F; GUIMARÃES, B. Acompanhamento de fluxo e empregabilidade dos imigrantes no Brasil: Relatório Mensal do OBMigra Ano 3, Número 12, dezembro de 2022/ Observatório das Migrações Internacionais; Brasília, DF: OBMigra, 2022. Disponível em: https://portaldeimigracao.mj.gov.br/pt/dados/relatorios-mensais |