MRE
MRE - Ministry of Foreign Affairs
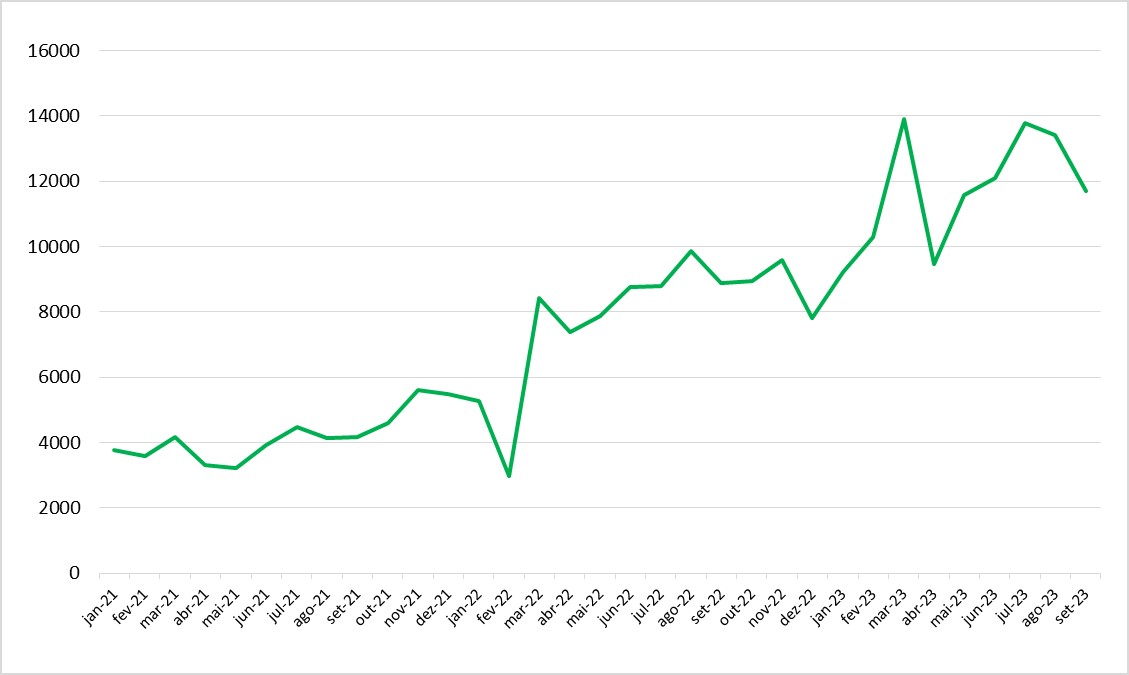
In September, there was a notable reduction in the number of visas issued, particularly evident in Graph 1, where there was a decrease of 12.8%.
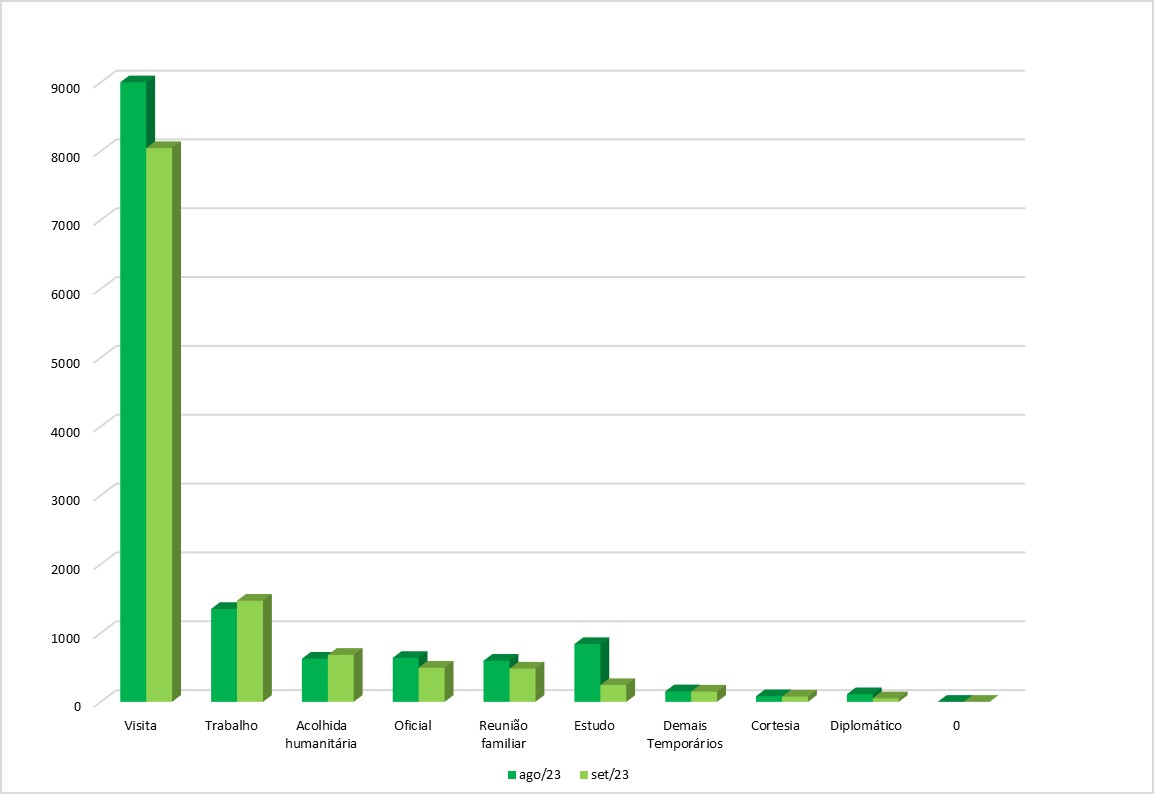
However, despite this overall decrease, visas for humanitarian reception and work permits showed positive variations, with increases of 8.8% and 8.9% respectively compared to the previous month (Graph 2).
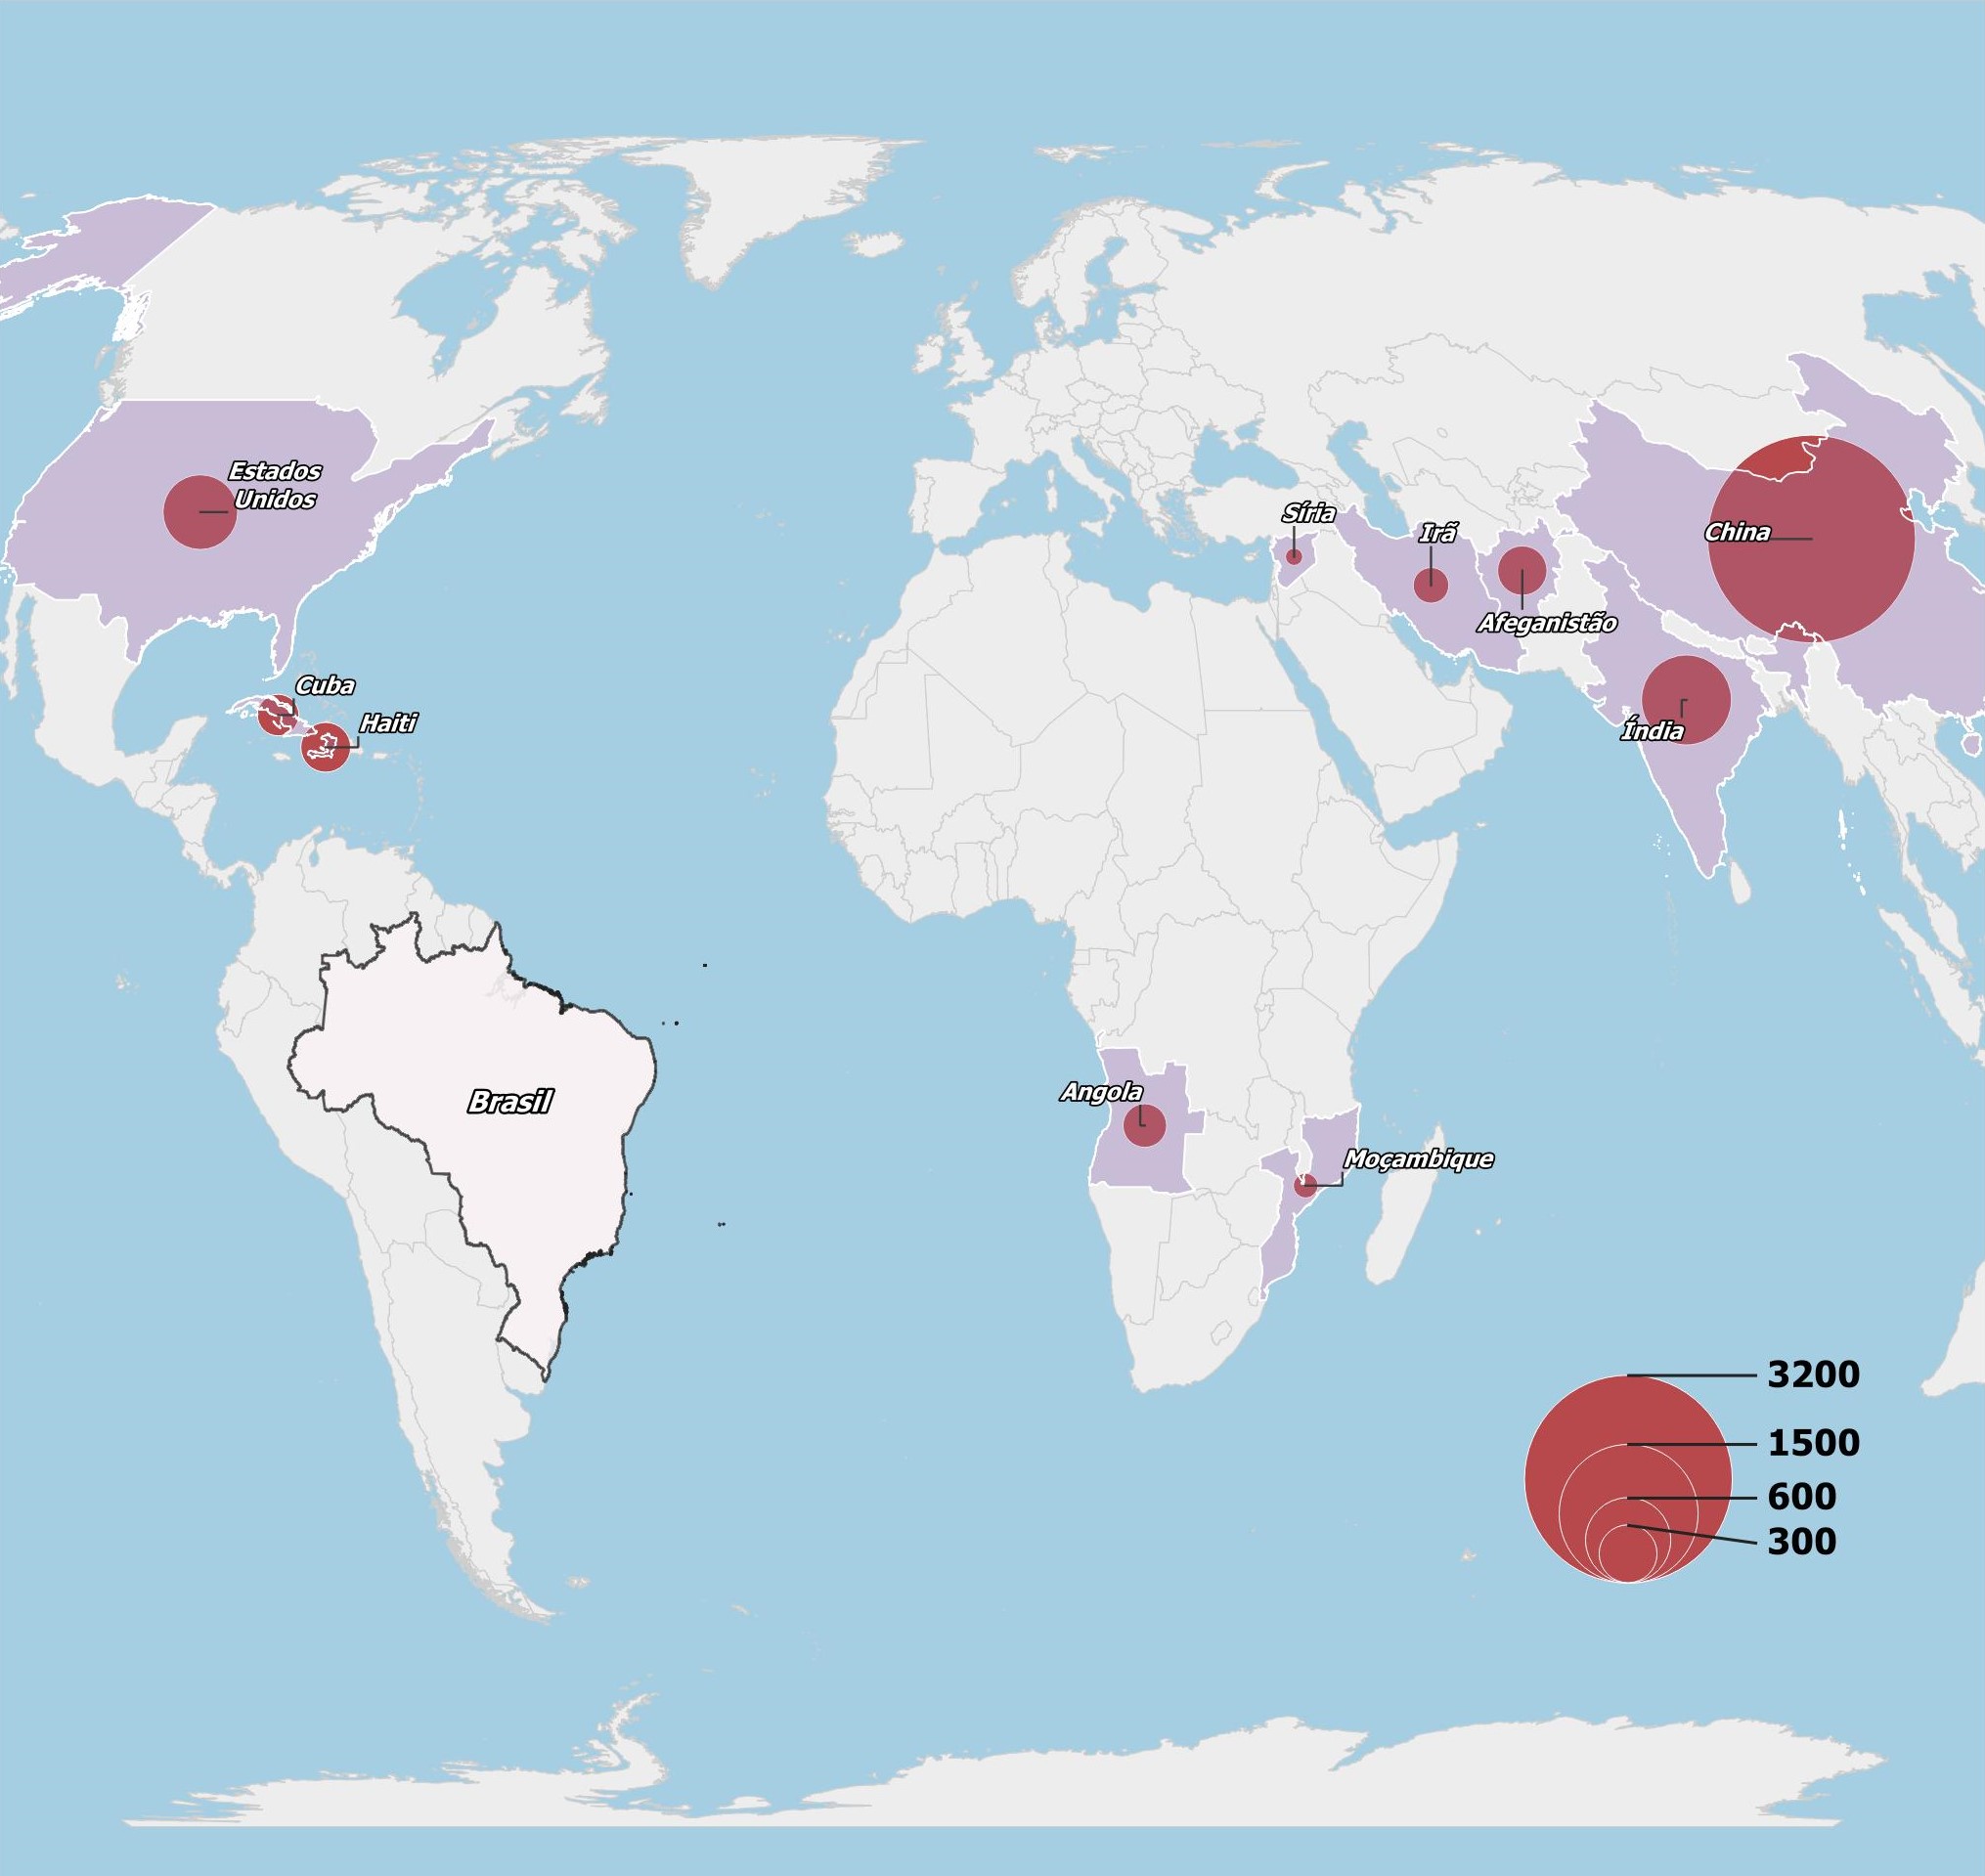
According to Map 1, Chinese and Indians remained the top nationalities to receive entry visas. However, there was a notable change in the rankings, with Haitians surpassing Afghans, Angolans, and Cubans to come fourth, just behind US nationals (Map 1).
GRAPH 1
Number of visas issued by consular offices - Brazil, 2021-2023
Source: OBMigra (2023), based on data from the Ministry of Foreign Affairs.
GRAPH 2
Number of visas granted, according to typologies - Brazil, August and September 2023.
Source: OBMigra (2023), based on data from the Ministry of Foreign Affairs.
Map 1
Number of visas granted by main nationalities - Brazil, September 2023.
Source: OBMigra (2023), based on data from the Ministry of Foreign Affairs.
STI
STI (International Traffic System)
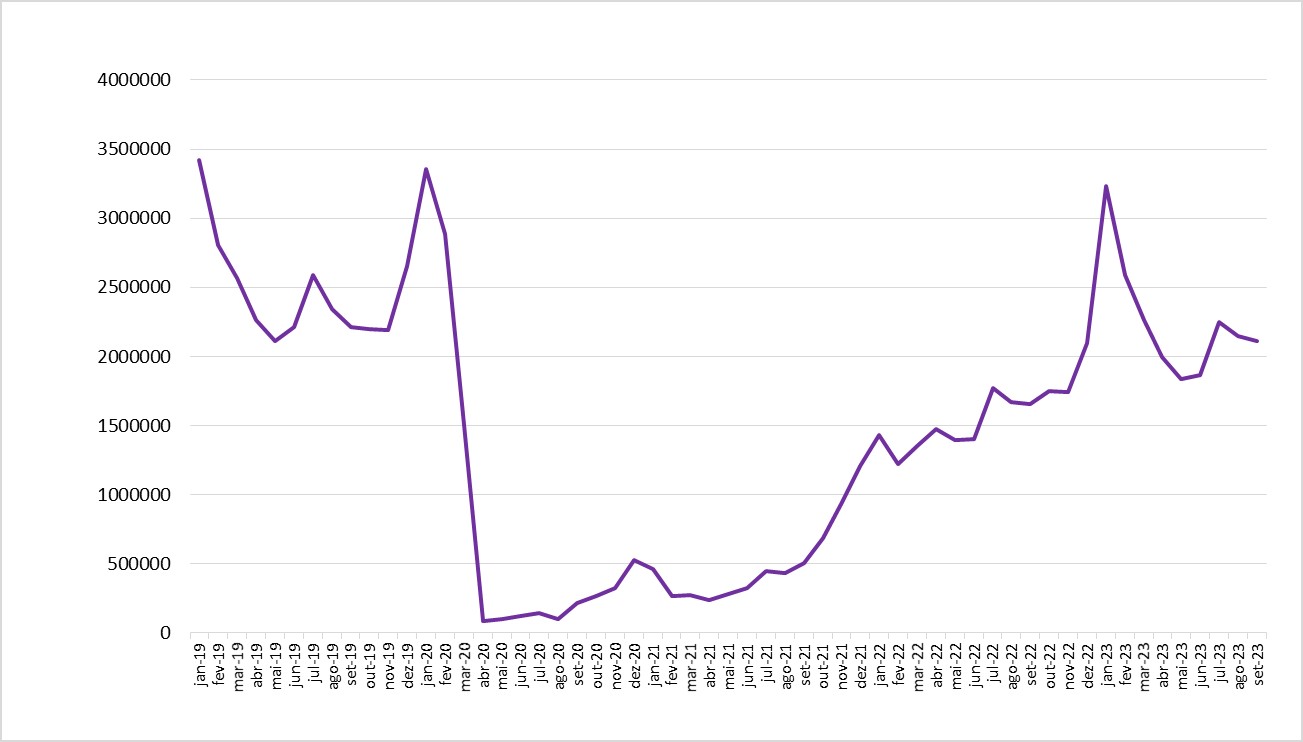
Compared to August, there was a decrease in the volume of cross-border movements, which can be attributed to seasonal effects. However, it remained higher than in September 2022, indicating a gradual recovery of international mobility following the pandemic (Graph 3).
The negative balance observed in September was primarily influenced by a higher outflow of Brazilians. Notably, among tourists, resident migrants, and temporary migrants, inflows surpassed outflows (Graph 4).
GRAPH 3
Cross-border movements, by month of registration, Brazil 2019/2023.
Source: OBMigra (September 2023), based on data from the Brazilian Federal Police, International Traffic System (STI).
GRAPH 4
Balance of cross-border movements of people, according to typology - Brazil, September 2023.
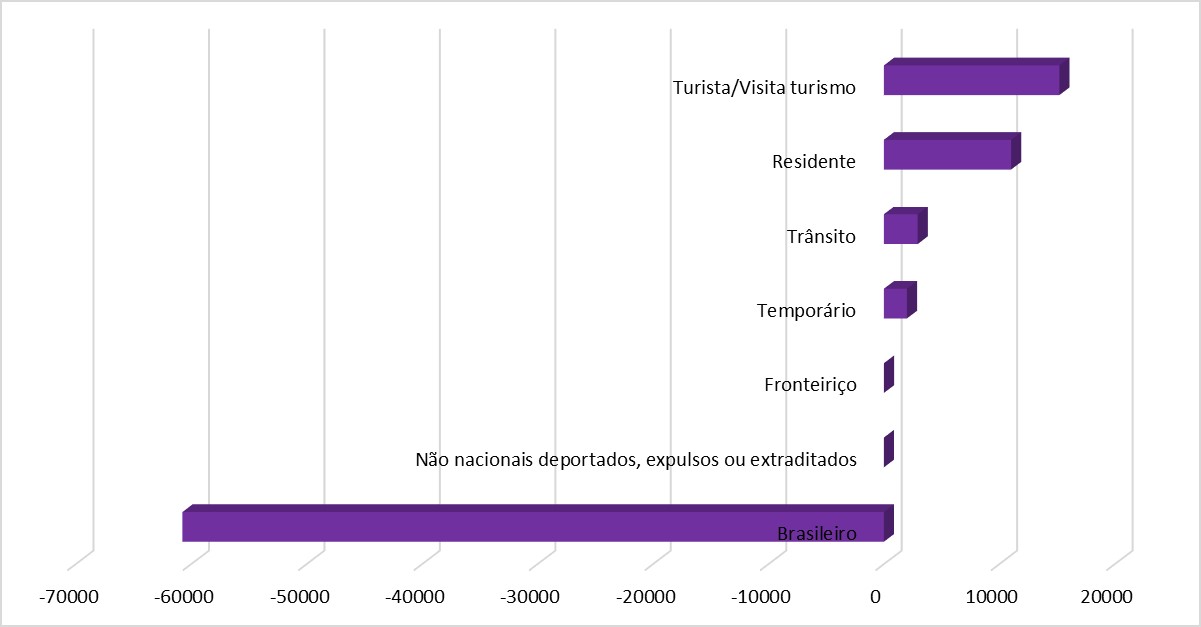
Source: OBMigra (August 2023), based on data from the Brazilian Federal Police, International Traffic System (STI).
SISMIGRA
SisMigra (National Migration Registry System)
The number of residence registrations experienced a decrease of -11.0% compared to the previous month and showed a negative fluctuation compared to September 2022, with a decrease of -4.7% (Graph 5).
Despite an overall decrease in the volume of registrations, Afghans saw a positive variation in the monthly comparison, with an increase of 9.4% (Graph 6). It's worth noting that there was also a notable increase of 14.4% compared to September 2022.
In September, Venezuelans, followed by Bolivians, were the nationalities with the highest number of residence registrations (Map 2).
GRAPH 5
Number of immigrant registrations, by month of registration - Brazil, 2019/2023.
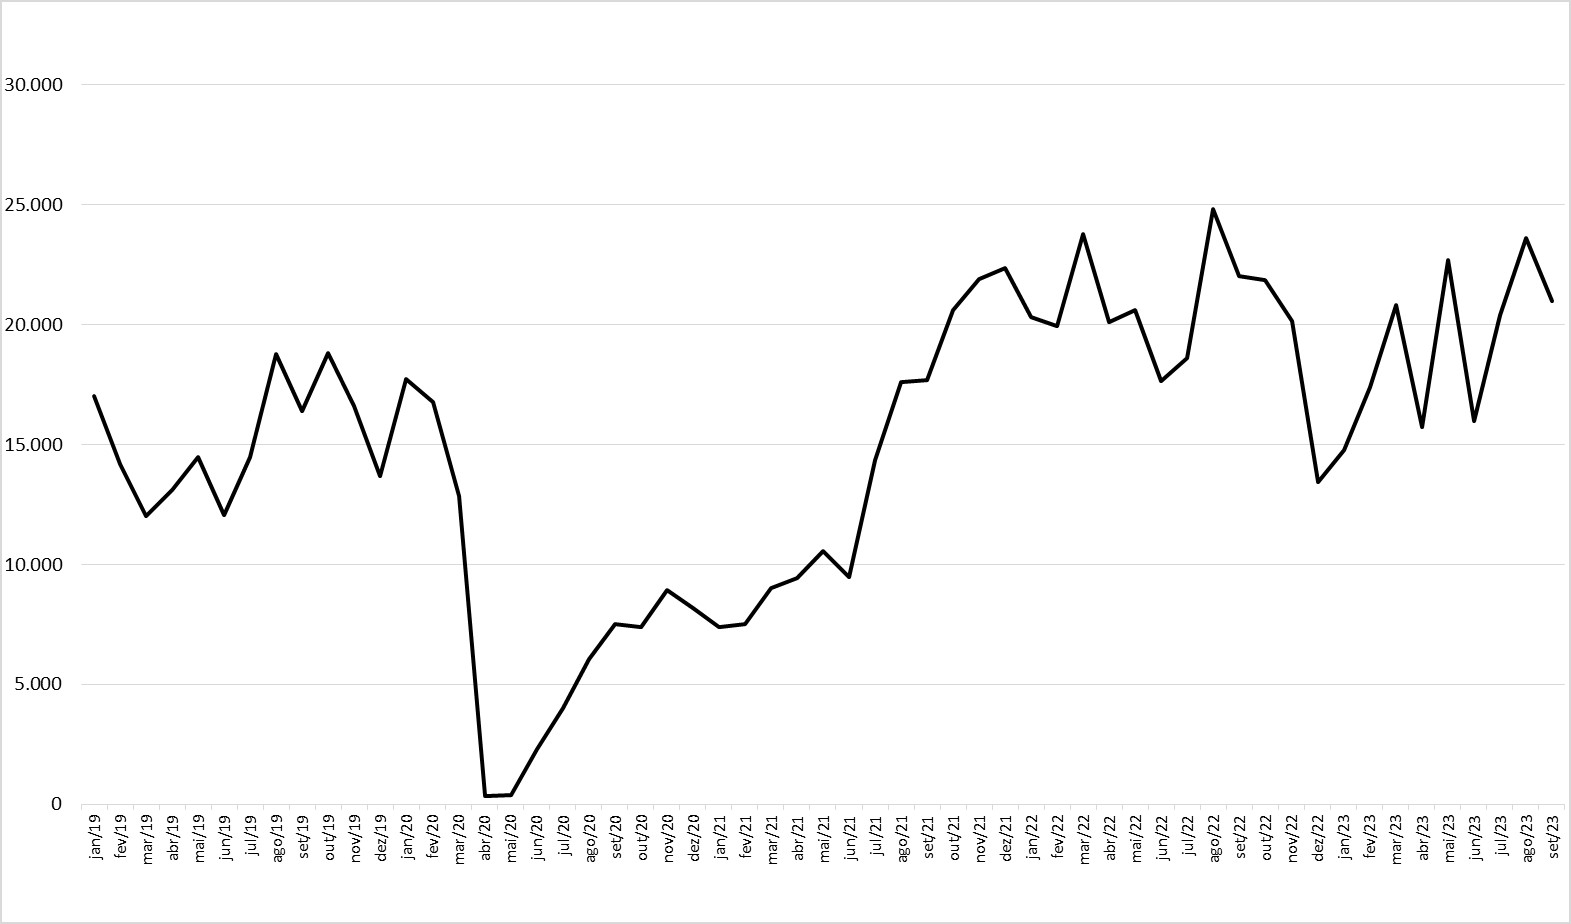
Source: OBMigra (2023), based on data from the Brazilian Federal Police, National Migration Registry System (SISMIGRA).
GRAPH 6
Number of residence permits granted to Afghans, by sex and month - Brazil, August and September 2023.

Source: OBMigra (2023), based on data from the Brazilian Federal Police, National Migration Registry System (SISMIGRA).
Map 2
Number of immigrant registrations, by main countries of birth, September 2023.
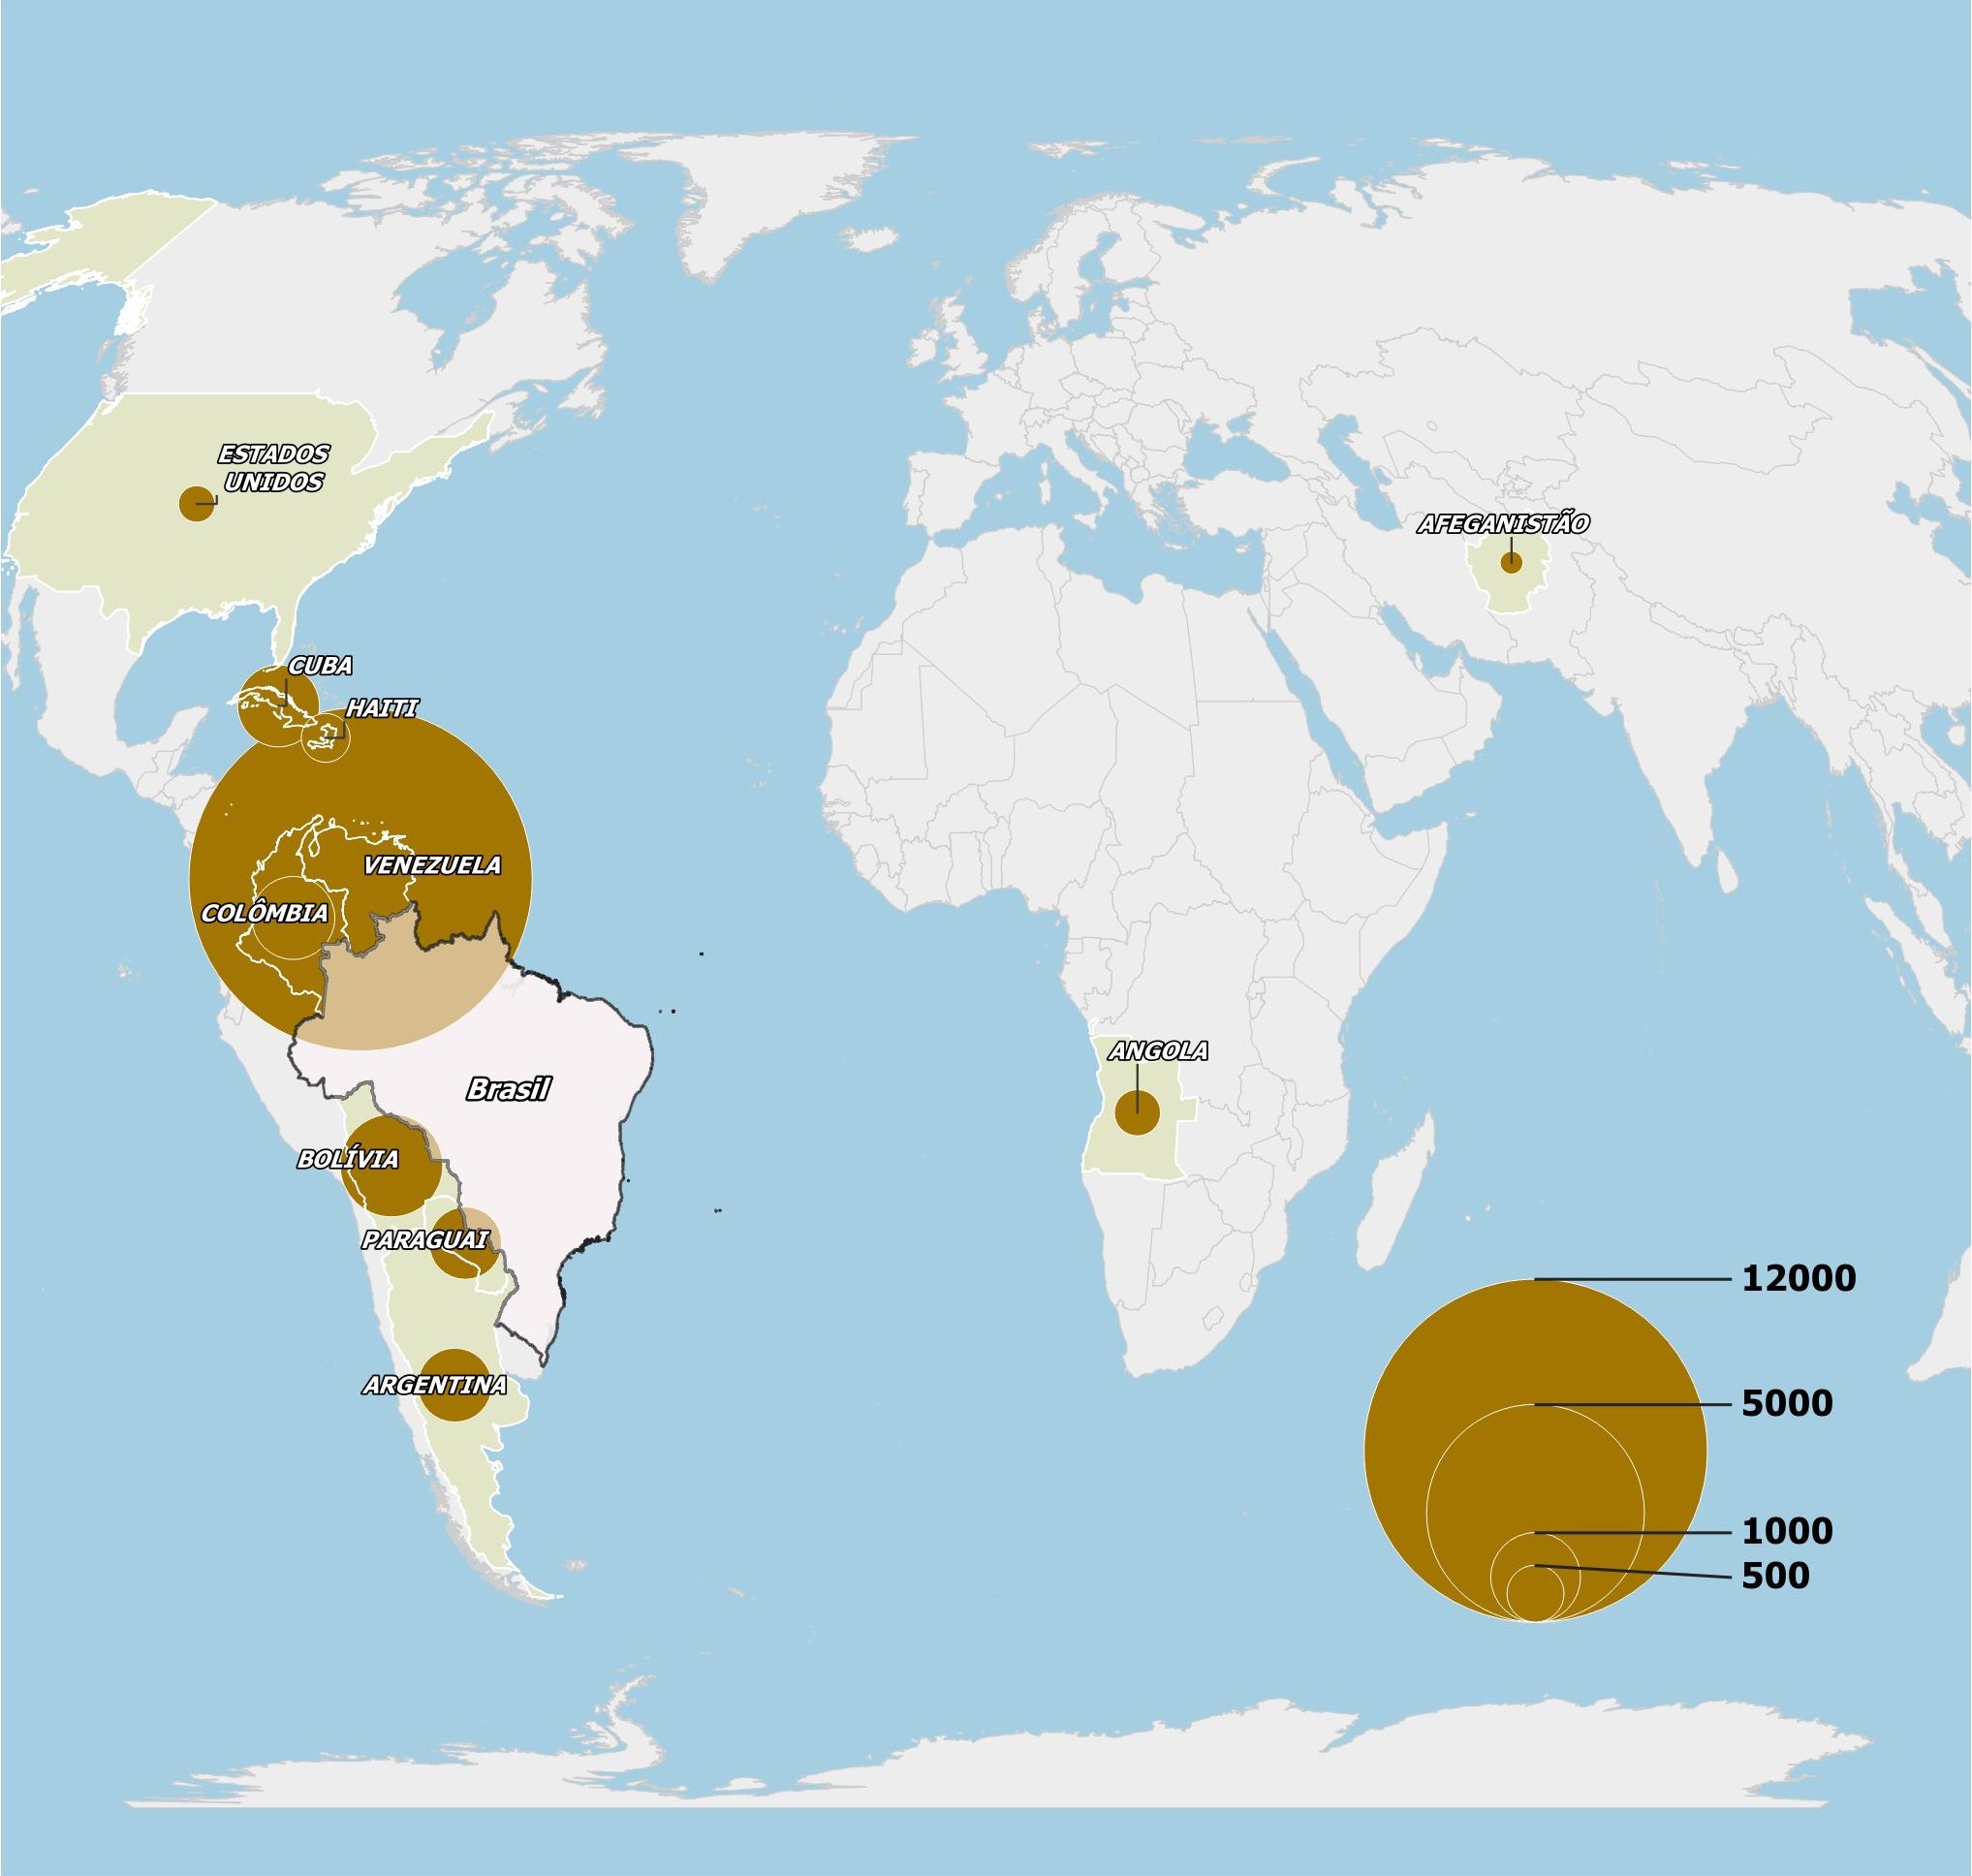
Source: OBMigra (2023), based on data from the Brazilian Federal Police, National Migration Registry System (SISMIGRA).
Solicitantes
Asylum seekers (Sisconare)
The number of asylum applications has exhibited considerable fluctuation throughout the year, with a monthly average of approximately 4,900 applications. In September, there was a slight reduction compared to August (-6.1%), but a significant increase compared to the previous 12 months (21.3%) (Graph 7).
Despite the overall reduction in applications, the cities of São Paulo/SP, Manaus/AM, and Epitaciolândia/AC demonstrated positive performance in September (Graph 8).
Venezuelans and Cubans remain the primary nationalities applying for asylum in Brazil (Map 3). However, it's noteworthy that Angolans and Colombians, albeit in smaller volumes, contributed to the increased number of applications in the month.
GRAPH 7
Number of applications for recognition of refugee status, by month of registration - Brazil, 2019-2023.

Source: OBMigra (2023), based on data from the General Coordination of the National Committee for Refugees, Asylum Claims.
GRAPH 8
Number of asylum applications, by month and main municipalities - Brazil, August and September 2023.

Source: OBMigra (September, 2023), based on data from the General Coordination of the National Committee for Refugees, Asylum Claims.
MAP 3
Number of asylum applications, according to main countries, September 2023
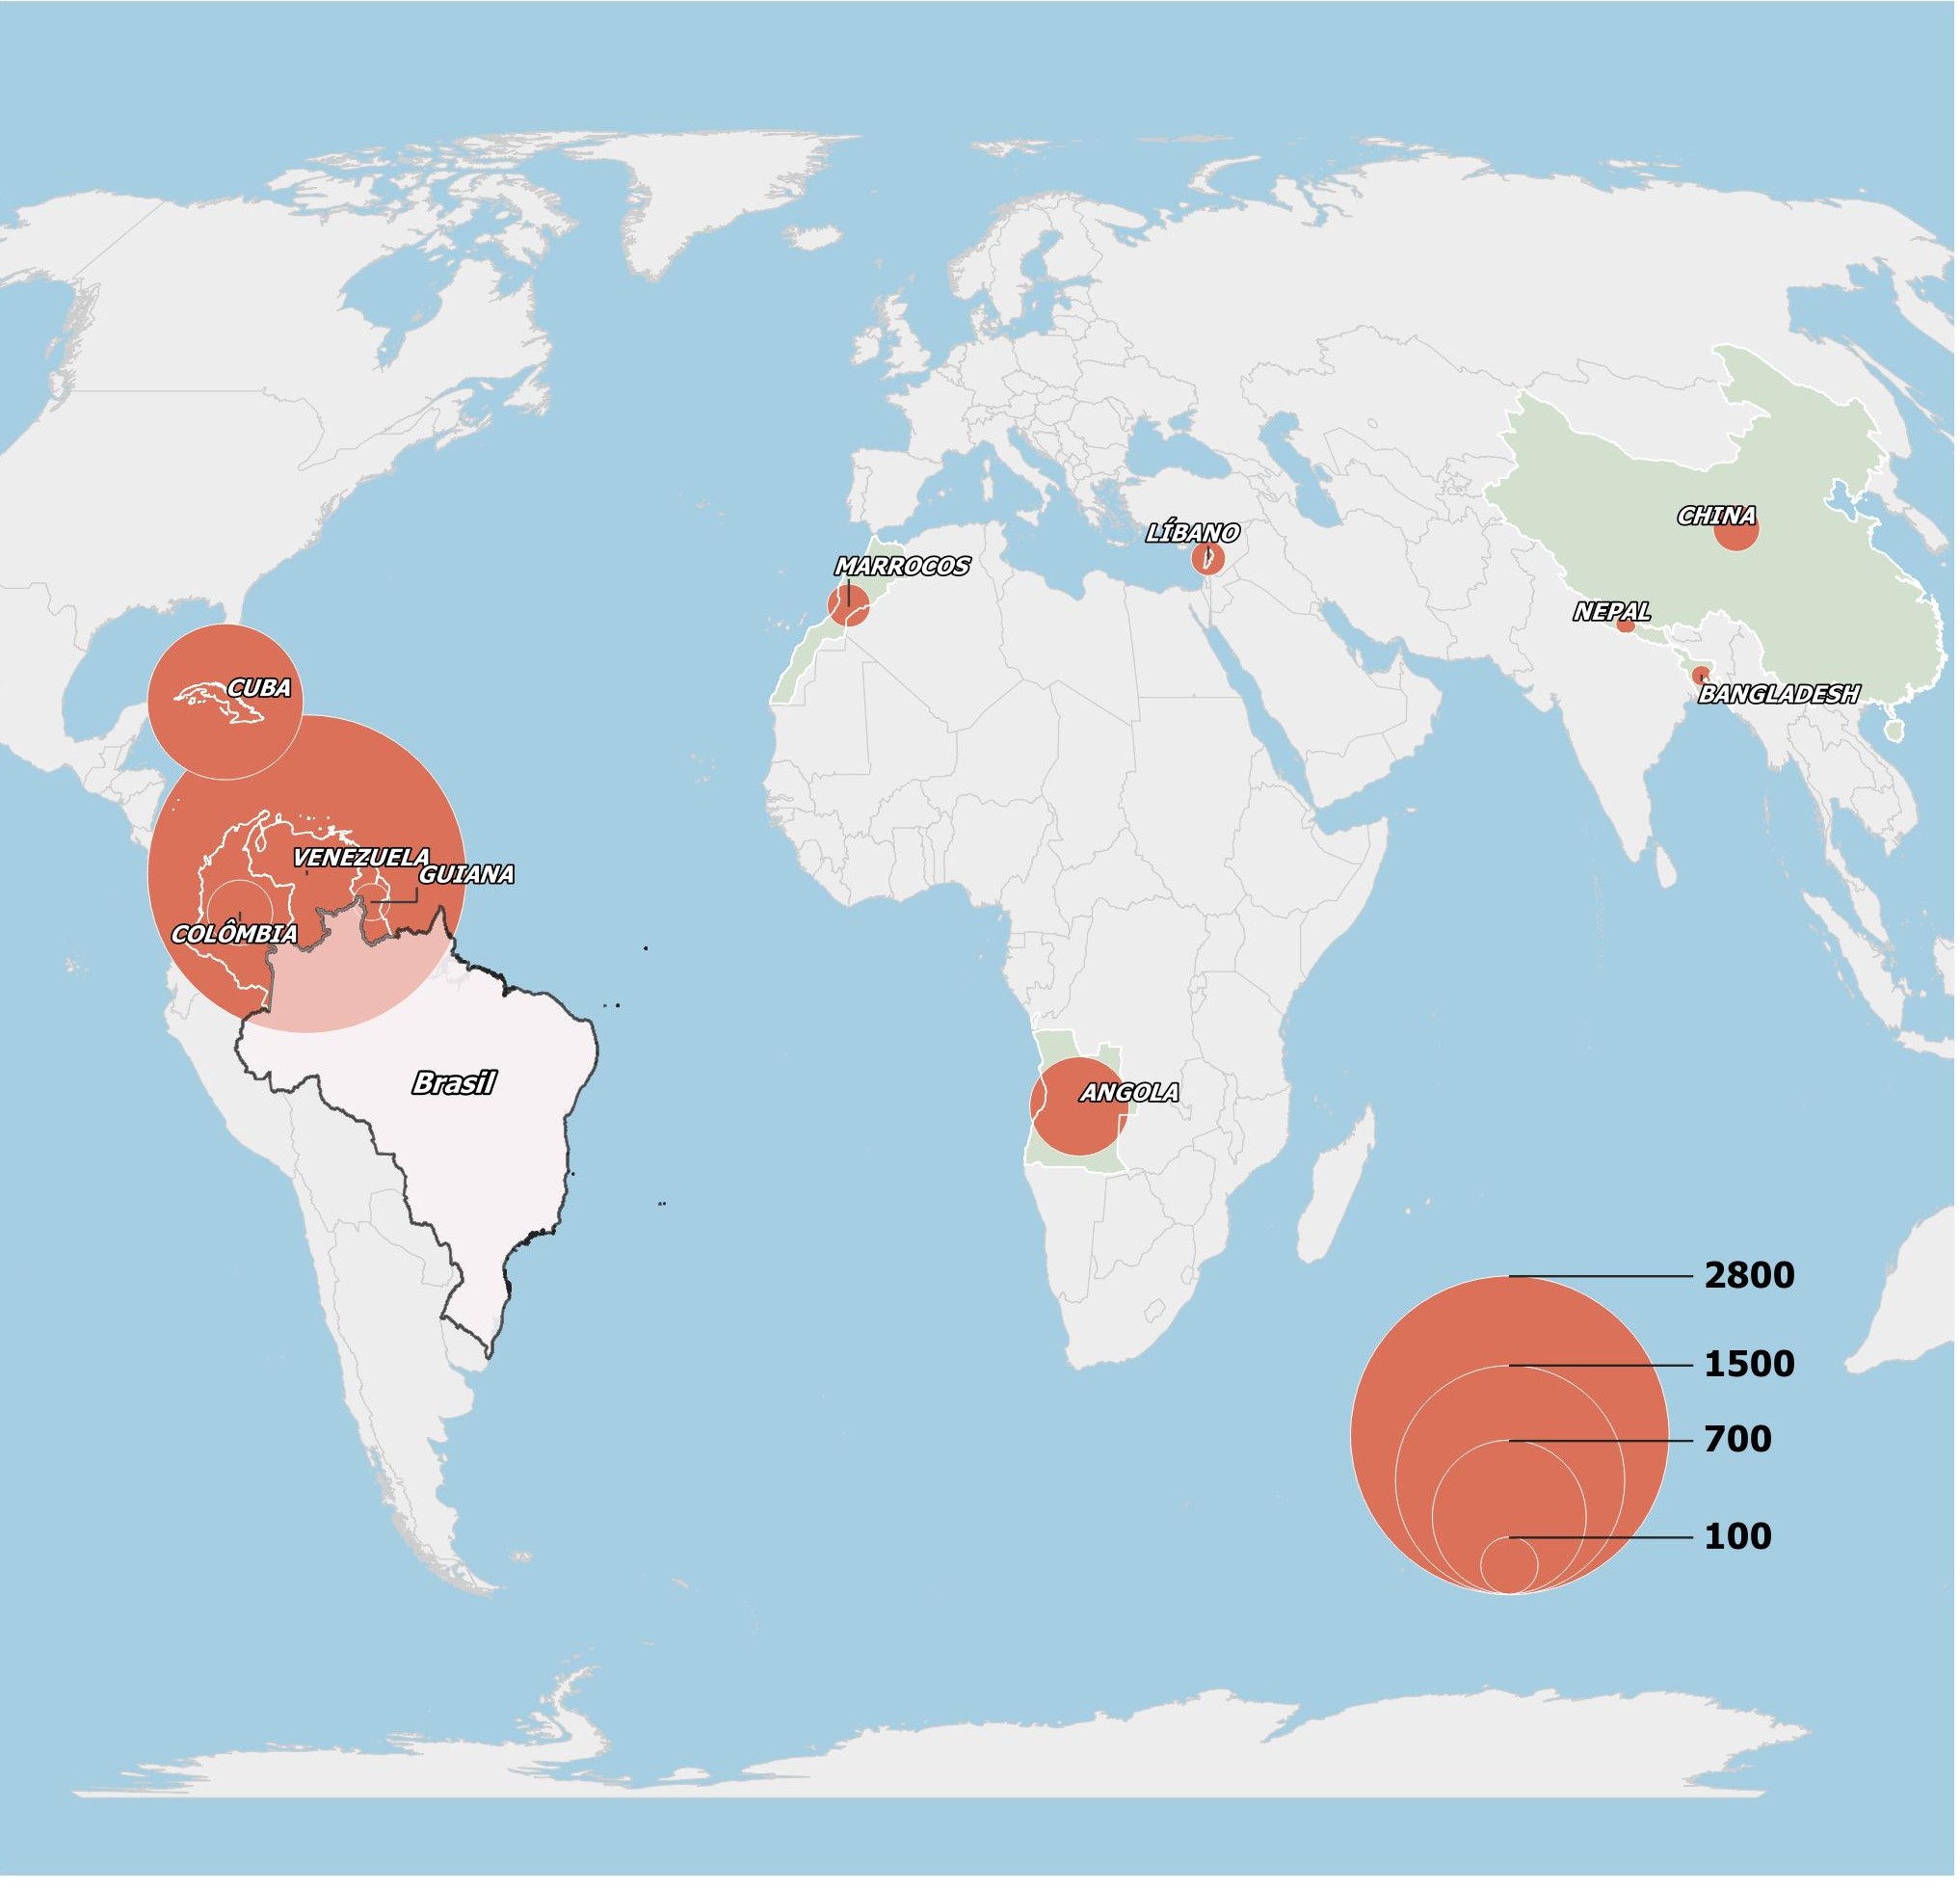
Source: OBMigra (September, 2023), based on data from the General Coordination of the National Committee for Refugees, Asylum Claims.
Decisões
Decisions on asylum applications (Sisconare)
In September, we introduced a new section in the monthly report containing data on decisions made by the National Committee for Refugees. Throughout 2023, a total of 99,644 decisions have been reached, surpassing the number for the entire year of 2022, which amounted to 41,297 cases.
Graph 9 illustrates the fluctuation in decision-making, with March 2023 notably standing out with 28,248 decisions. Another notable characteristic is the variability in the volume of decisions across the months.
In September, no decisions were upheld. However, in August, there were 14,557 favorable decisions, the vast majority of which were granted to Venezuelans (Graph 10).
GRAPH 9
Number of decisions on asylum applications - Brazil, 2022-2023

Source: OBMigra (2023), based on data from the General Coordination of the National Committee for Refugees (SISCONARE).
GRAPH 10
Number of people recognized as refugees, by sex - Brazil, August 2023

Source: OBMigra (2023), based on data from the General Coordination of the National Committee for Refugees (SISCONARE).
CGIL
CGIL (General Coordination of Labor Immigration)
The volume of residence permits for work and investment purposes increased by 19.5% compared to the previous month (Graph 11).
This rise can be attributed to the performance of the Prior Residence modality, which saw a growth of 32.0% compared to the previous August, in contrast to the Residence modality, which experienced a decrease of -12.5% (Graph 12).
Moreover, the number of residence permits for skilled workers witnessed a notable increase of 16.5% compared to August, particularly among Chinese and Japanese workers (Graph 13).
GRAPH 11
Number of work permits for labor and investment purposes, by month of registration - Brazil, 2019-2023

Source: OBMigra (2023), based on data from the General Coordination of Labor Immigration/Ministry of Justice and Public Security.
GRAPH 12
Number of permits granted, by month, according to type of permit - Brazil, August and September 2023.

Source: OBMigra (September 2023), based on data from the General Coordination of Labor Immigration/Ministry of Justice and Public Security.
GRAPH 13
Number of permits granted to skilled workers, by main countries - Brazil, September 2023.

Source: OBMigra (September 2023), based on data from the General Coordination of Labor Immigration/Ministry of Justice and Public Security.
CTPS/RAIS/NOVO CAGED
Base harmonizada CTPS/RAIS/Novo CAGED
No mês de agosto foi observado aumento não apenas no volume de trabalhadores se movimentando no mercado formal, como também na criação de postos de trabalho, 21,5% na comparação com julho (Gráfico 14).
As ocupações de alimentador de linha de produção, magarefe e faxineiro foram as que mais tiveram vagas de trabalho criadas no mês agosto para a força de trabalho imigrante (Gráfico 15).
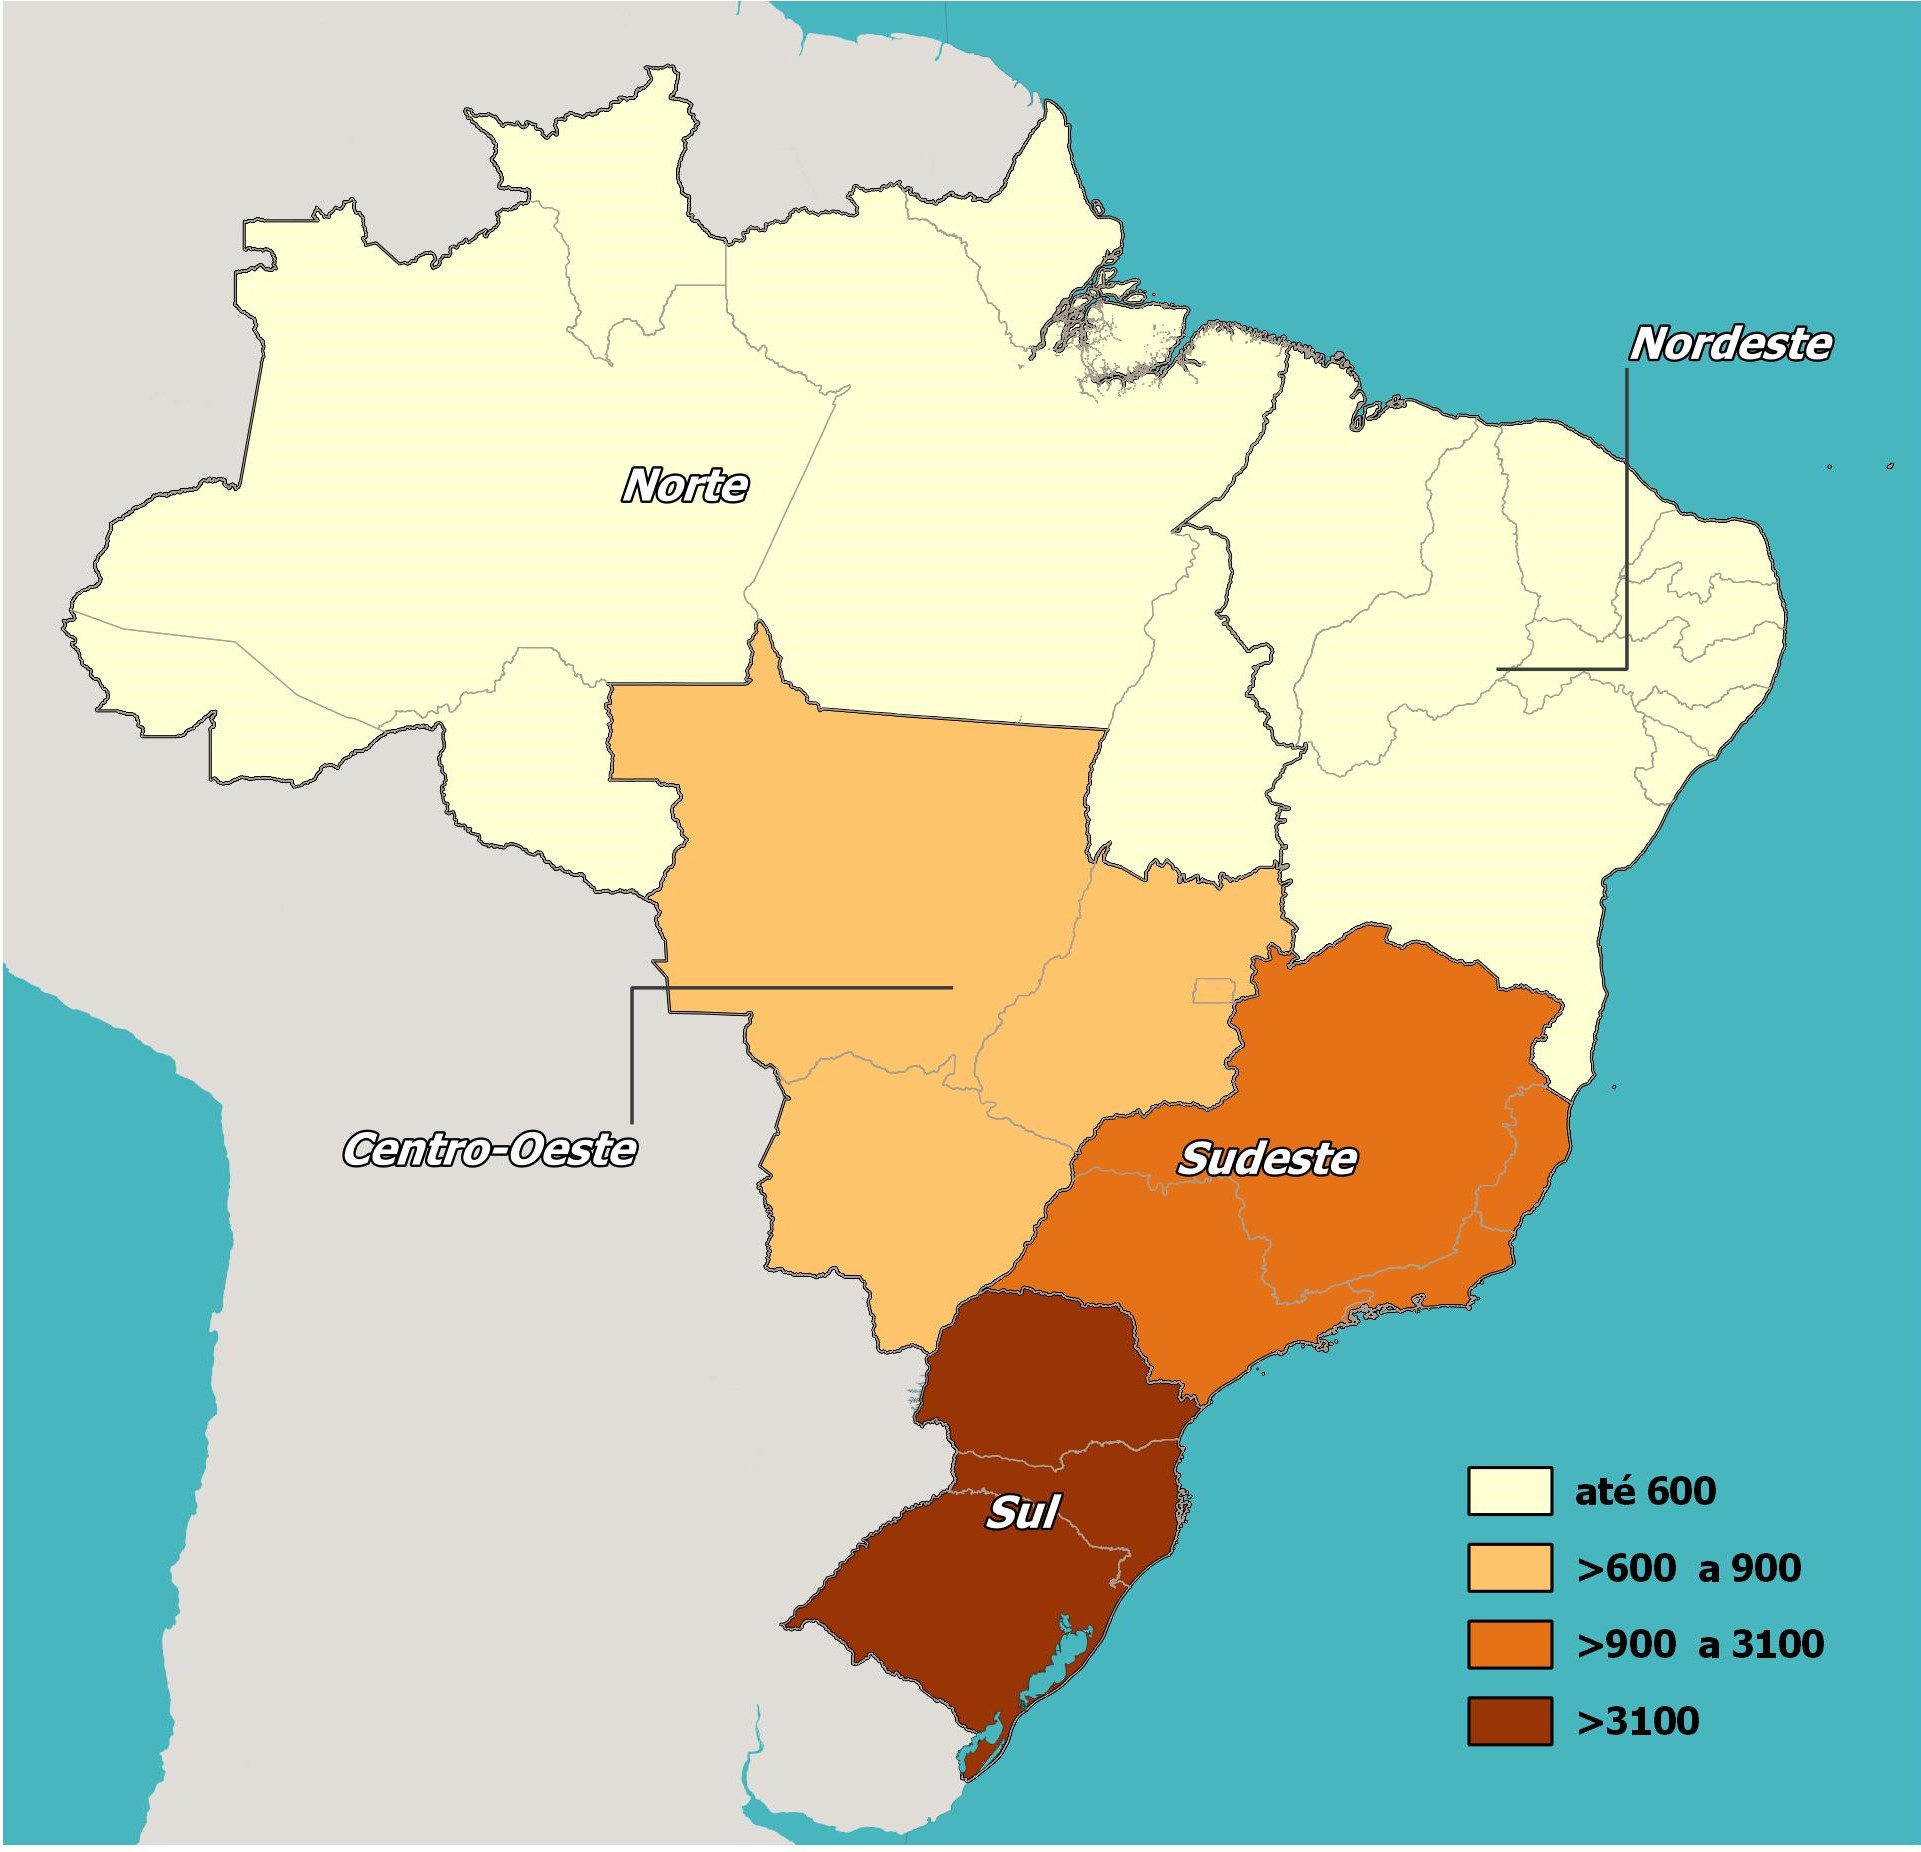
Foram criados na Região Sul mais postos de trabalho para a mão de obra imigrante que em todas as demais Regiões somadas (Mapa 4).
GRAPH 14
Jobs created for immigrants in the formal labor market, by month - Brazil, 2019/2023.

Source: OBMigra (2023), based on data from the harmonized database RAIS-CTPS-CAGED and the Digital System of Tax, Social Security and Labor Obligations (eSocial).
GRAPH 15
Job positions created for migrants in the formal labor market, according to main occupations - Brazil, August 2023.

Source: OBMigra (August 2023), based on data from the Ministry of Economy, Harmonized database RAIS-CTPS-CAGED
MAP 4
Number of jobs created for immigrants, according to Regions, August 2023.
Source: OBMigra (August 2023), based on data from the Ministry of Economy, Harmonized database RAIS-CTPS-CAGED
BACEN - Transferências Pessoais
BACEN - Personal Bank Transfer
The balance of transfers rebounded by 6.9% compared to July, reaching a total of US$155 million. This outcome signifies a return to the levels observed in January and February of this year (Graph 16). It's worth noting that the movement of resources, encompassing both inflows and outflows, has been declining every month. However, the improved performance is attributed to a smaller reduction in expenditure compared to income.
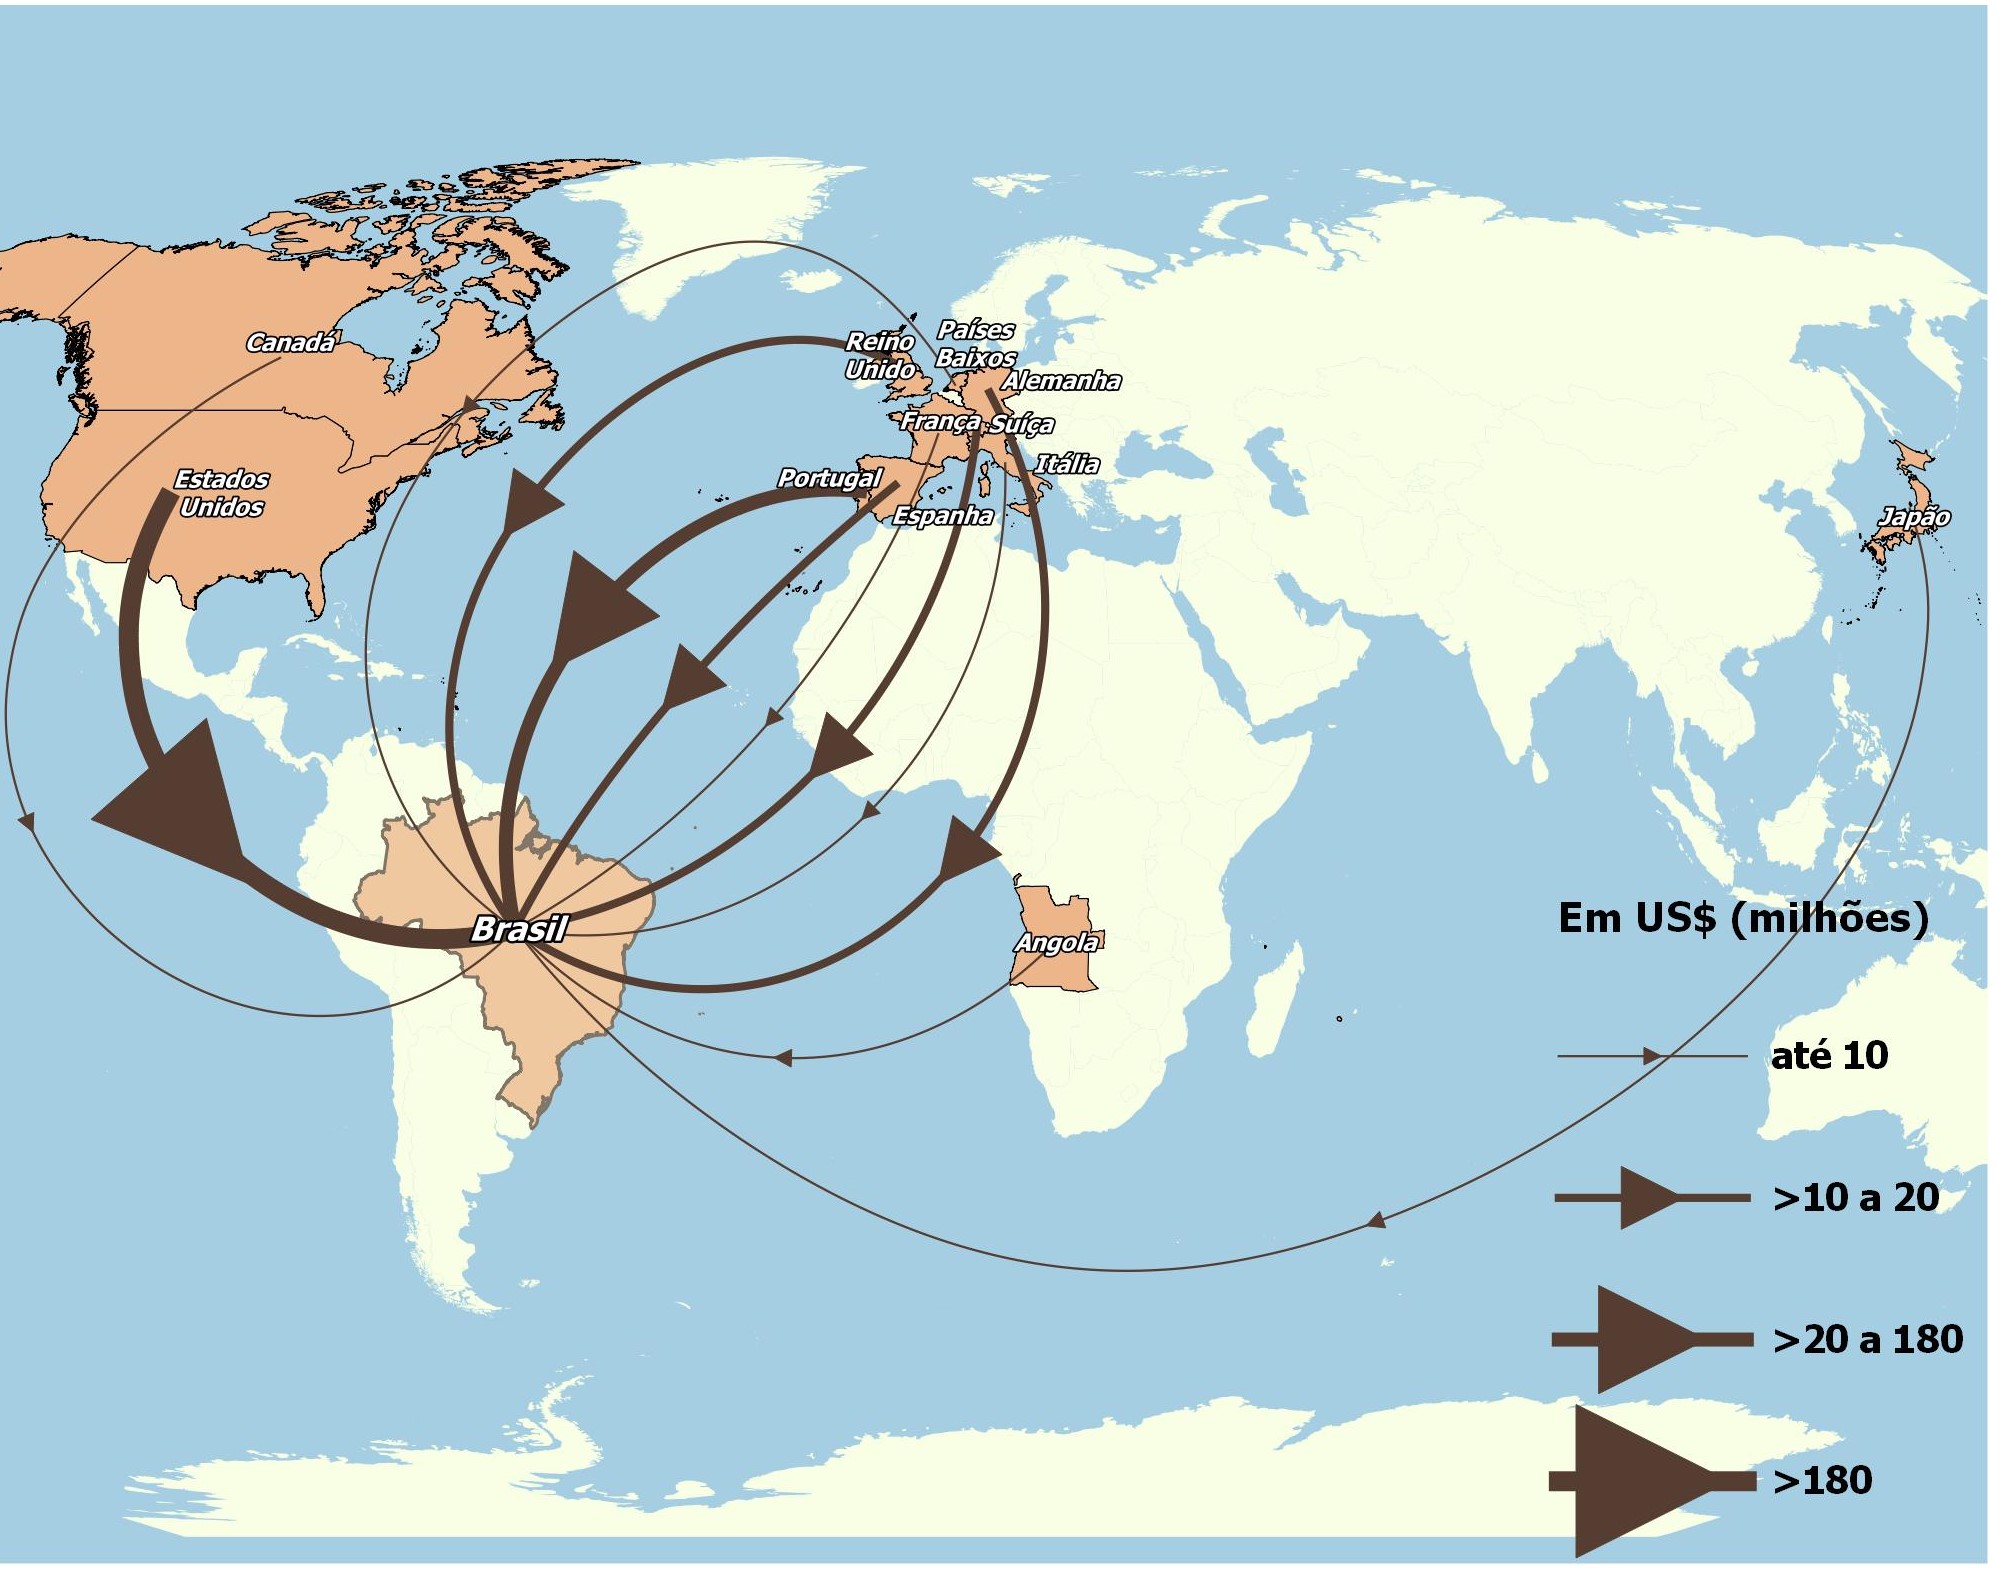
egarding the primary destinations of transfers, there were no changes compared to July, with the USA, Portugal, and the United Kingdom maintaining their positions at the top (Map 5).
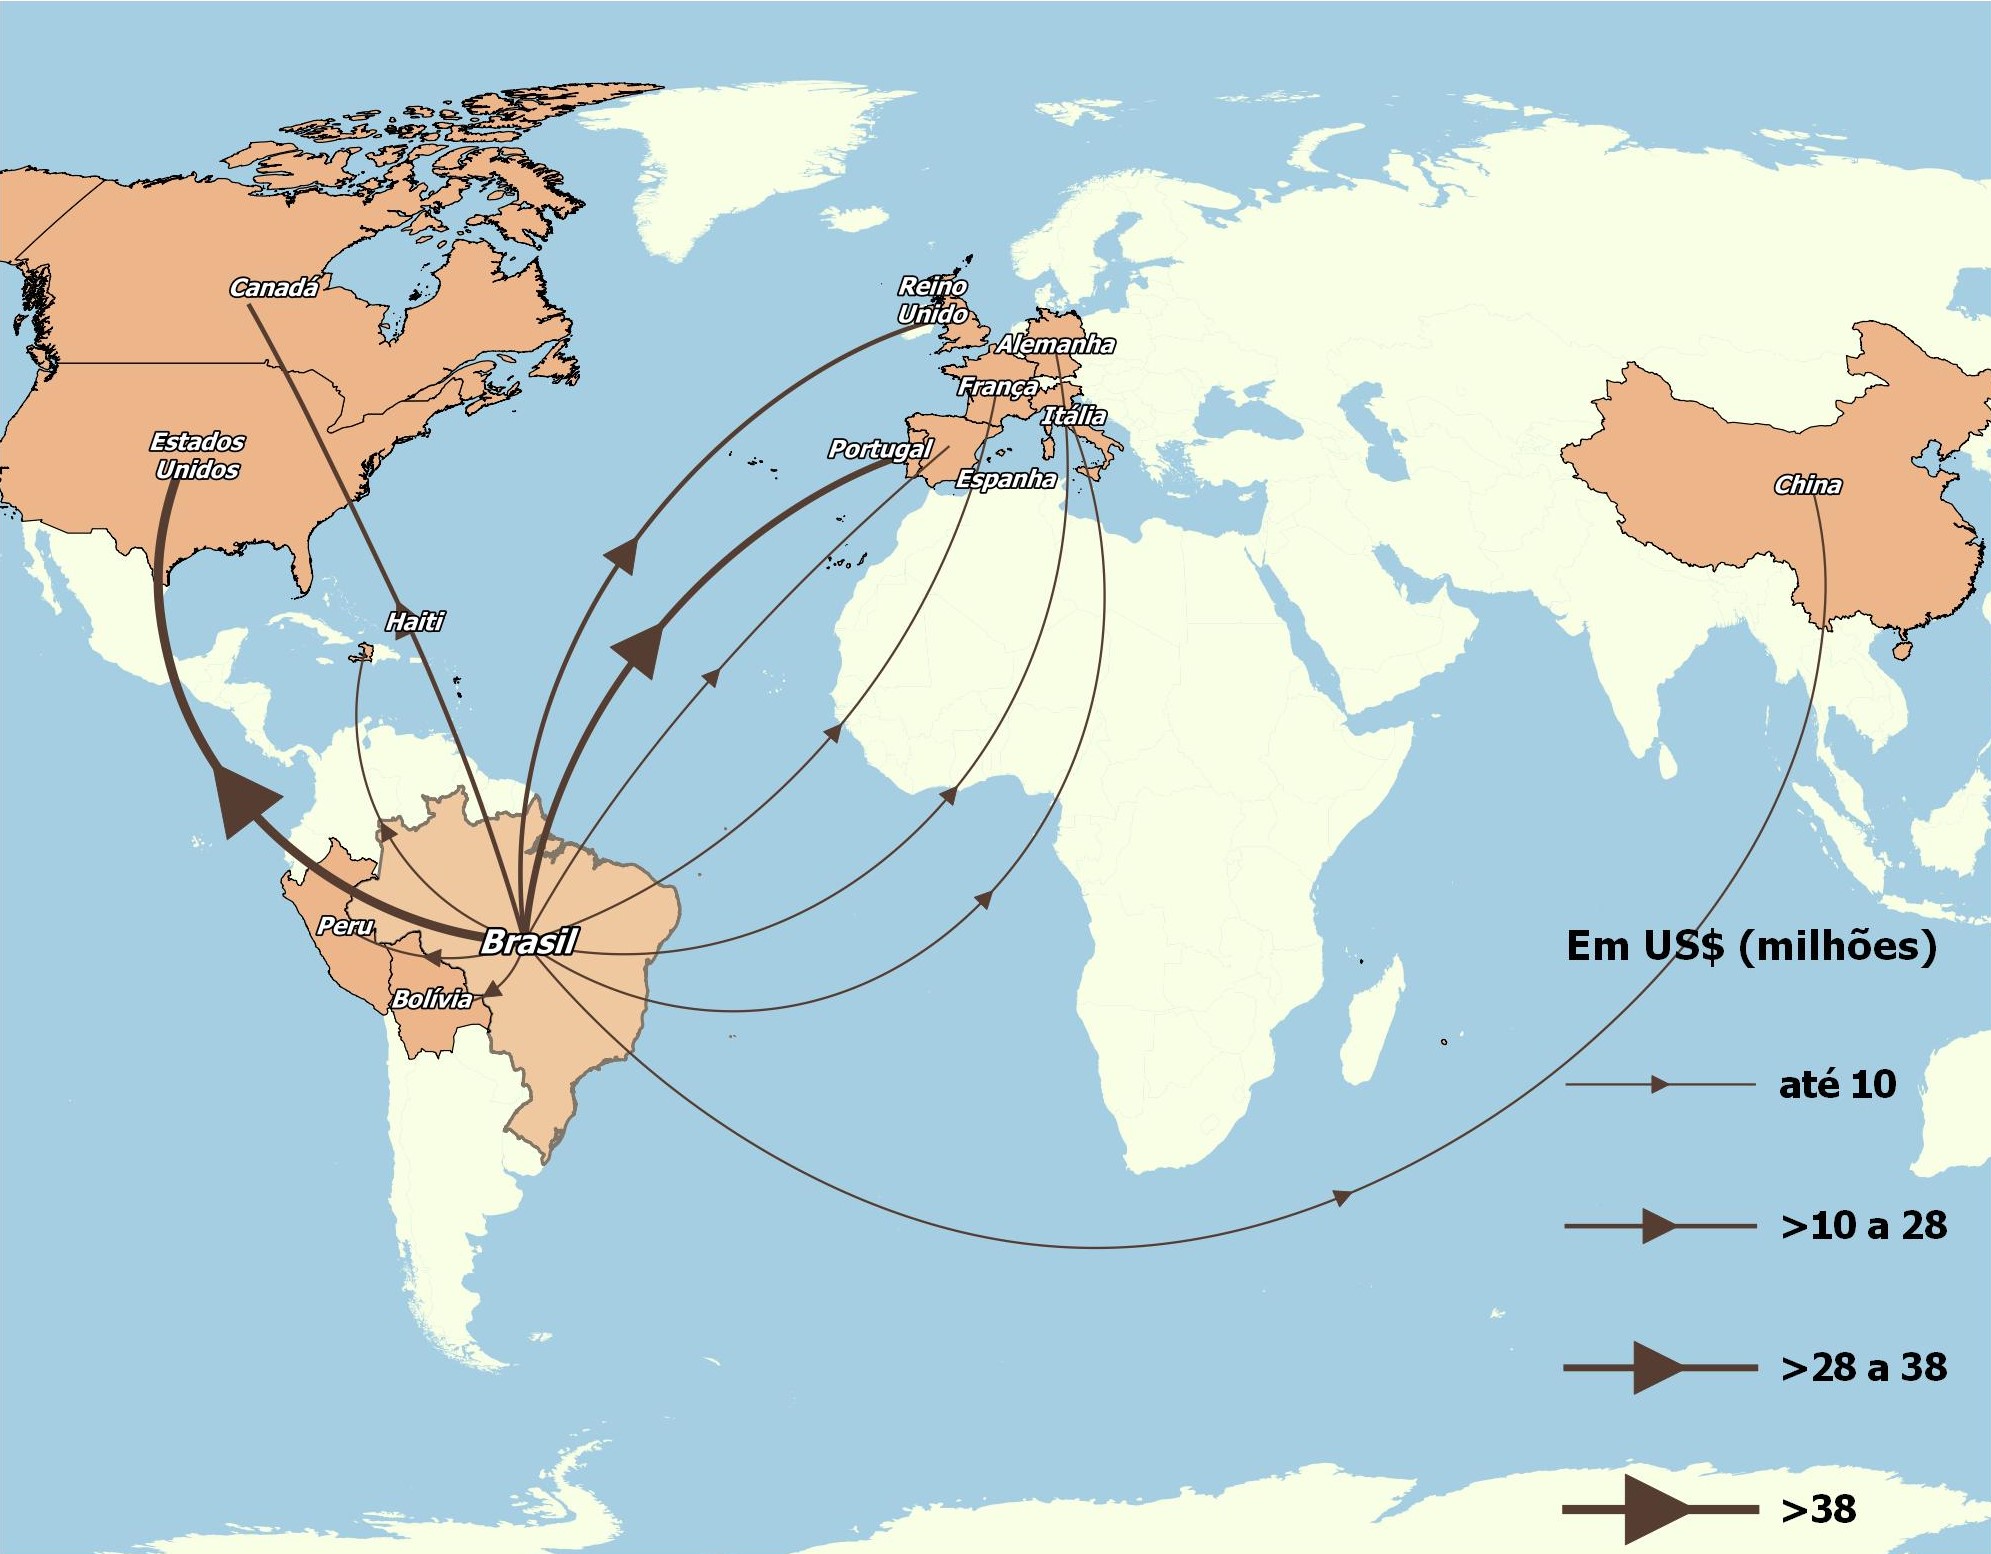
In terms of revenue sources, Canada secured the third position, surpassing the United Kingdom and trailing behind the USA and Portugal (Map 6).
GRAPH 16
Balance of transfers via personal accounts in US$ (millions), by month of remittance - Brazil, 2019-2023.

Source: OBMigra (2023), based on data from the Central Bank of Brazil, Department of Statistics.
Map 5
Transfers via personal accounts in US$ (millions), by inflows and by main countries - Brazil, August 2023.
Source: OBMigra (August 2023), based on data from the Central Bank of Brazil, Department of Statistics.
Map 6
Transfers via personal accounts in US$ (millions), by outflows and by main countries - Brazil, August 2023.
Source: OBMigra (August 2023), based on data from the Central Bank of Brazil, Department of Statistics.
COMO CITAR
The reproduction of this text and the data contained therein is permitted, provided that proper citation of the source is included. Reproduction for commercial use is prohibited.
How to cite this text:
| CAVALCANTI, L; OLIVEIRA, T; FURTADO, A; DICK, P; QUINTINO, F; SILVA, S. Acompanhamento de fluxo e empregabilidade dos imigrantes no Brasil: Relatório Mensal do OBMigra Ano 4, Número 3, março de 2023/ Observatório das Migrações Internacionais; Brasília, DF: OBMigra, 2023.Available at: https://portaldeimigracao.mj.gov.br/pt/dados/relatorios-mensais |


