MRE
HIGHLIGHTS:
MRE - Ministry of Foreign Affairs
The number of visas issued in October continued its upward trend, surpassing September's figures and reaching the highest level since the historical series began in January 2021 (Graph 1).
In relative terms, the monthly increase in visa issuance was more favorable to females (Graph 2).
The nationalities that benefited most from entry permits were Chinese, Haitian, and Indian (Map 1).
GRAPH 1
Number of visas issued by consular offices - Brazil, 2021-2023
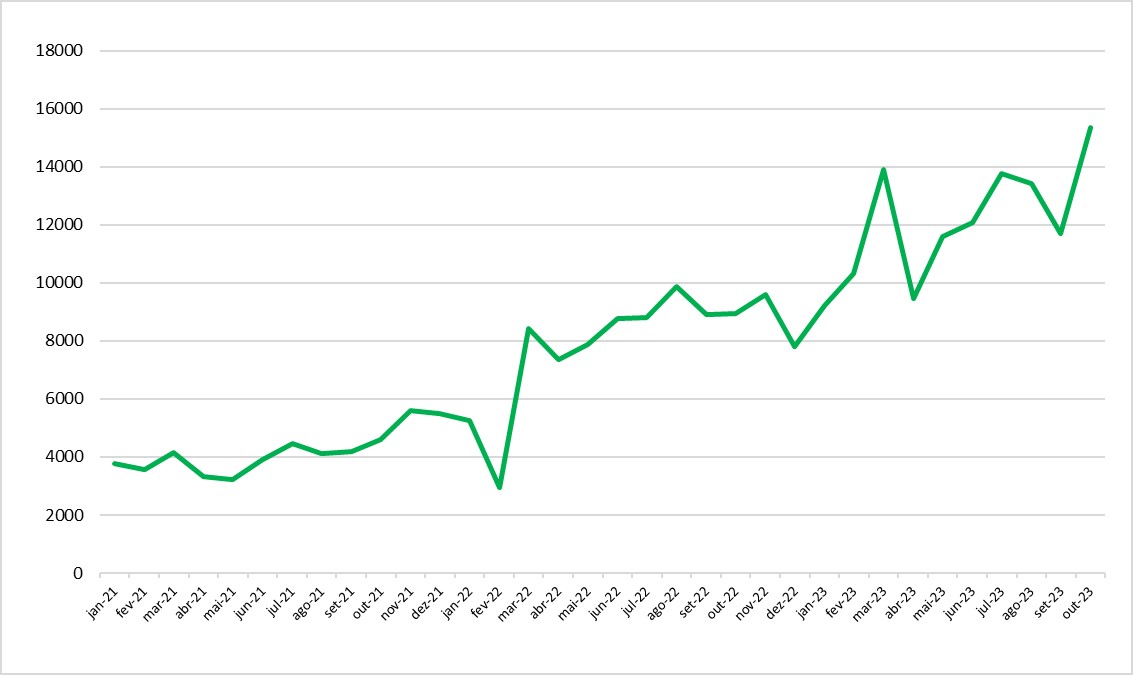
Source: OBMigra (2023), based on data from the Ministry of Foreign Affairs.
GRAPH 2
Relative change in visa emissions, by gender - Brazil, October 2023.
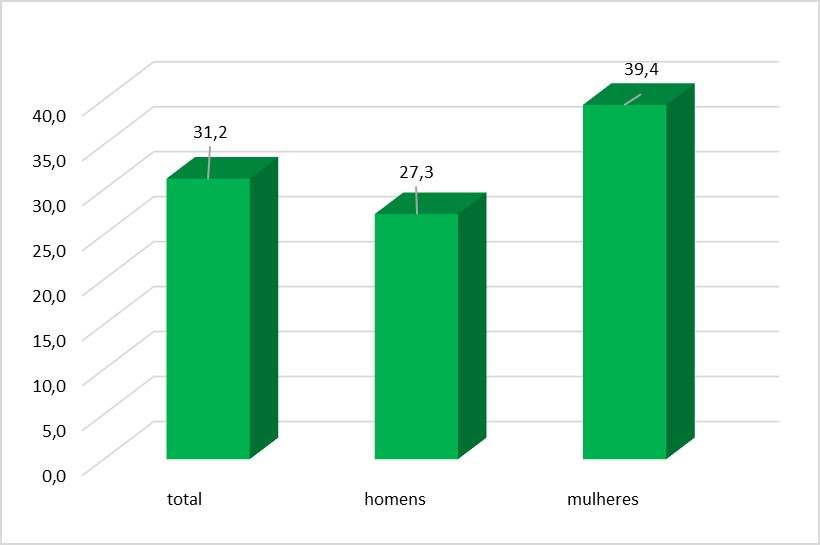
Source: OBMigra (October 2023), based on data from the Ministry of Foreign Affairs.
Map 1
Number of visas granted by main nationalities - Brazil, October 2023.
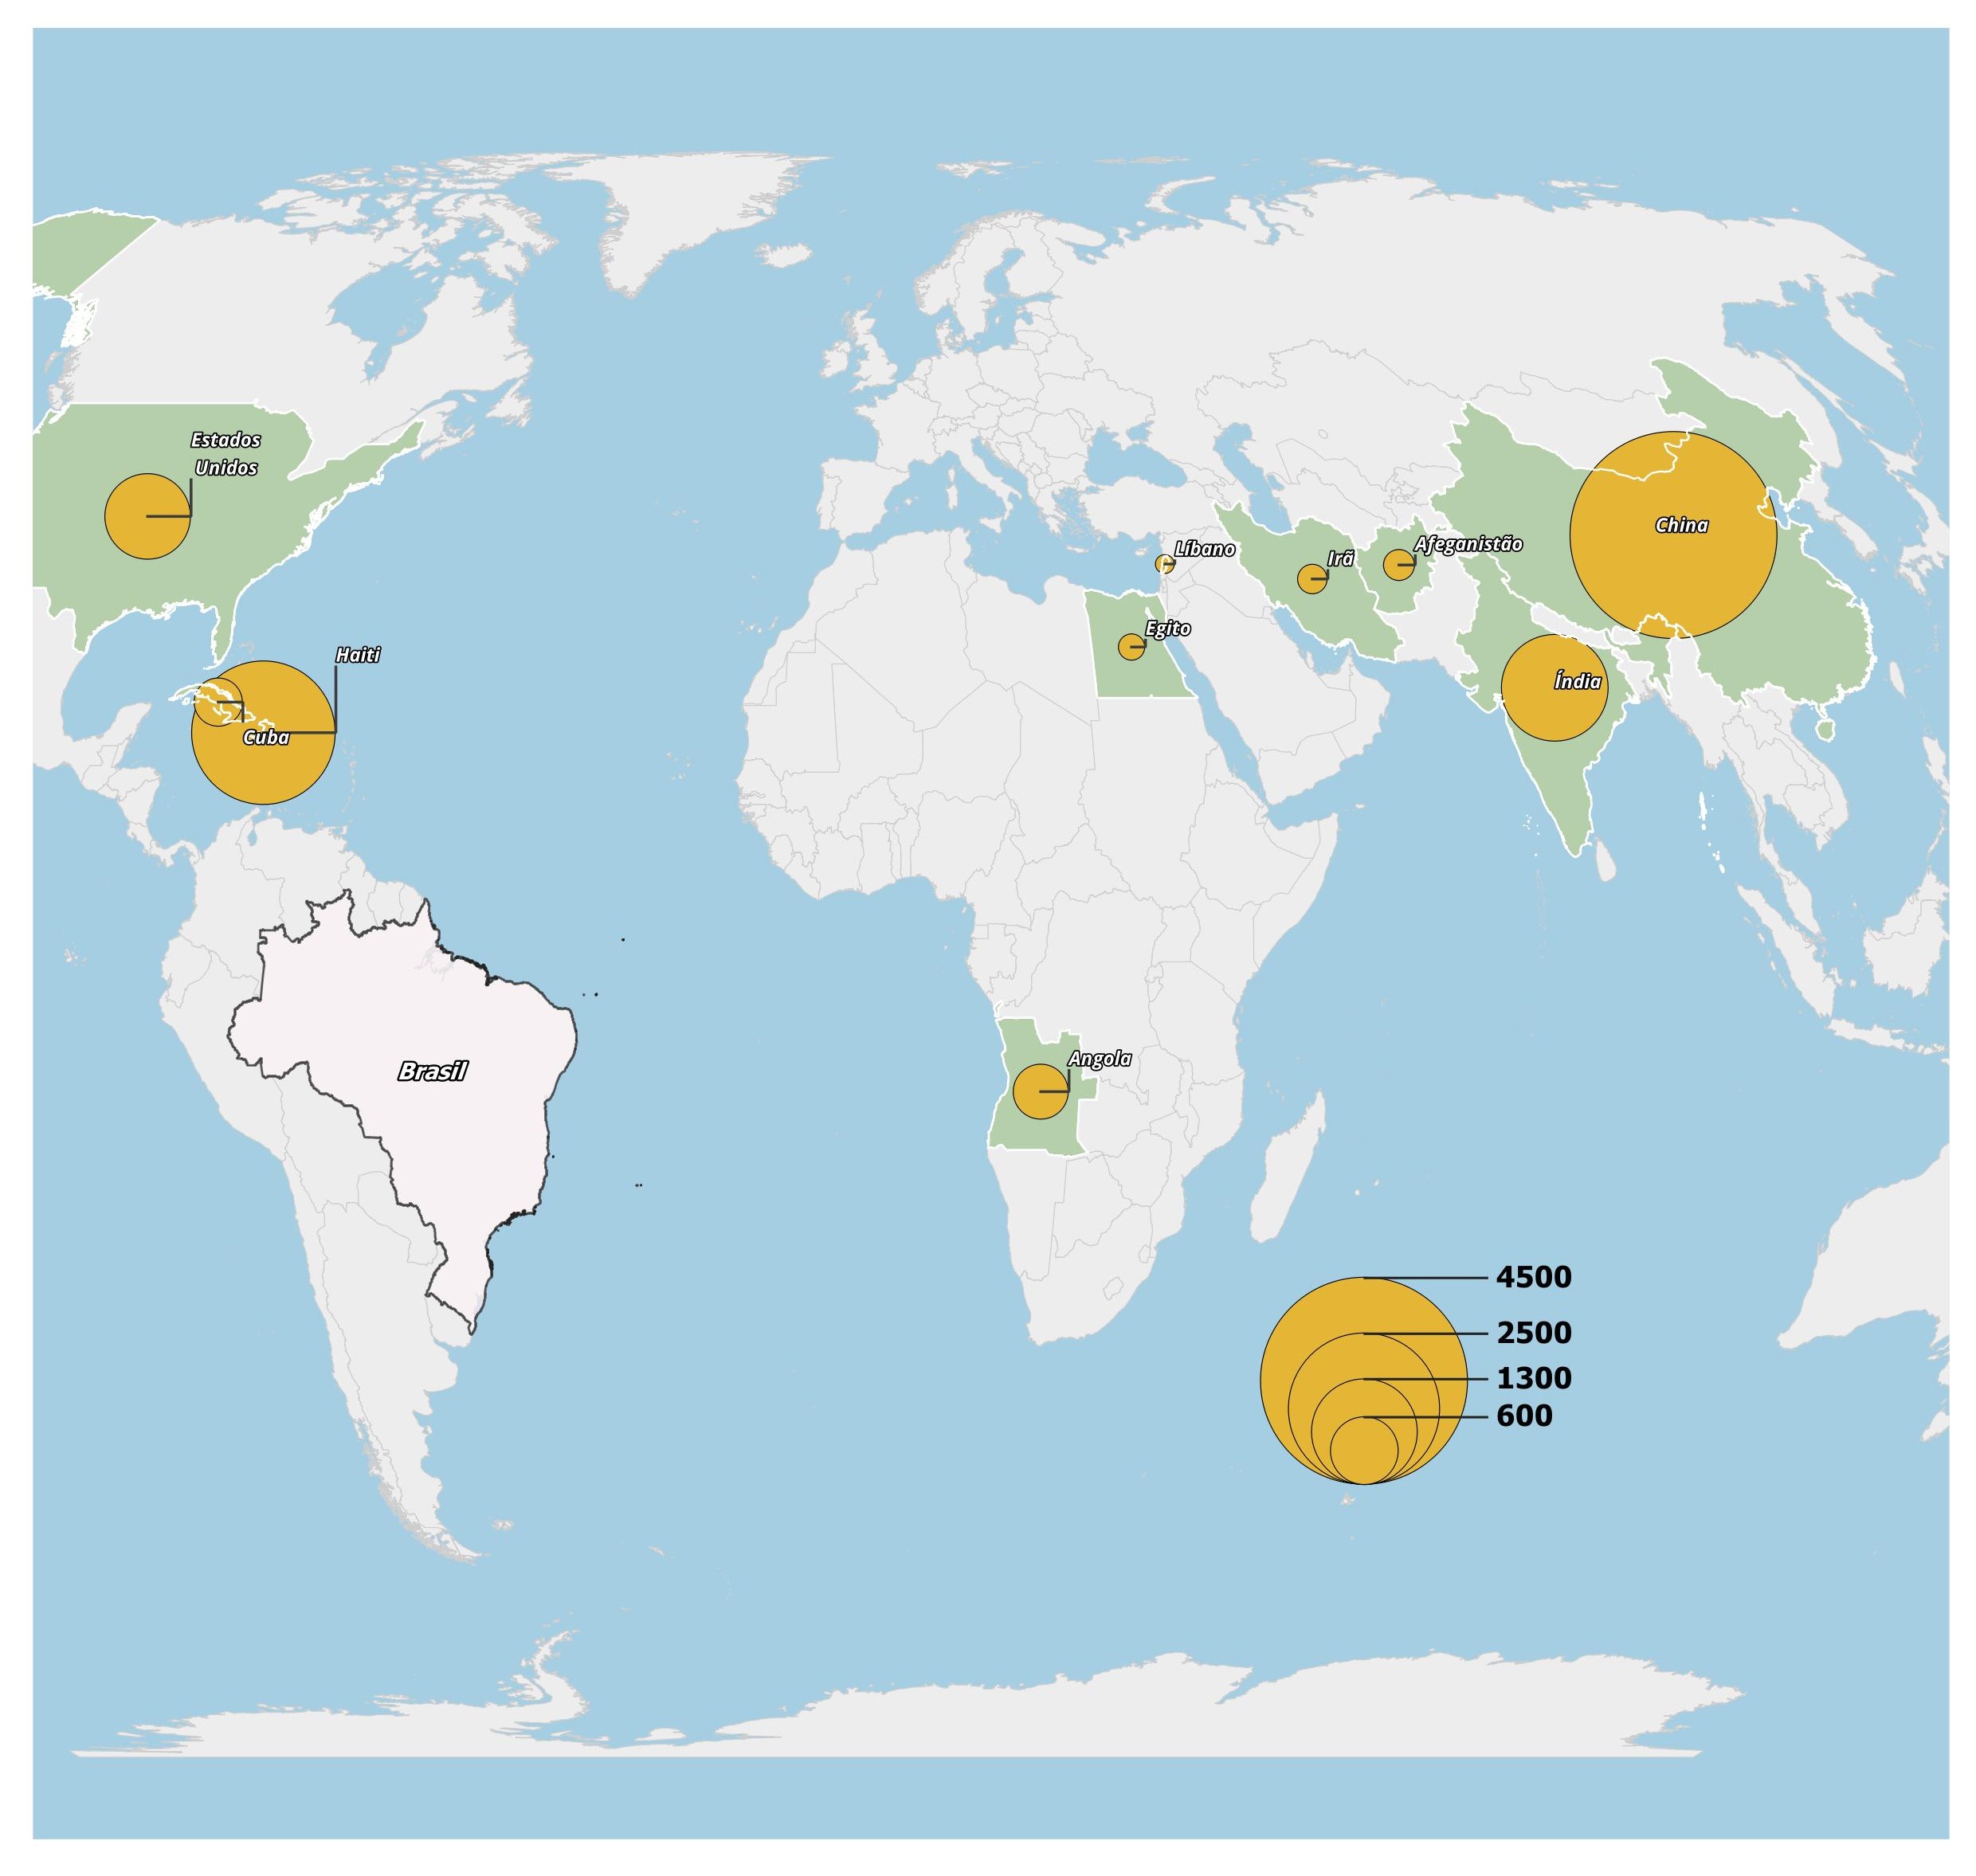
Source: OBMigra (October 2023), based on data from the Ministry of Foreign Affairs.
STI
STI (International Traffic System)
The movement of people through border posts showed a slight increase of 5.0% compared to September, as illustrated in Graph 3.
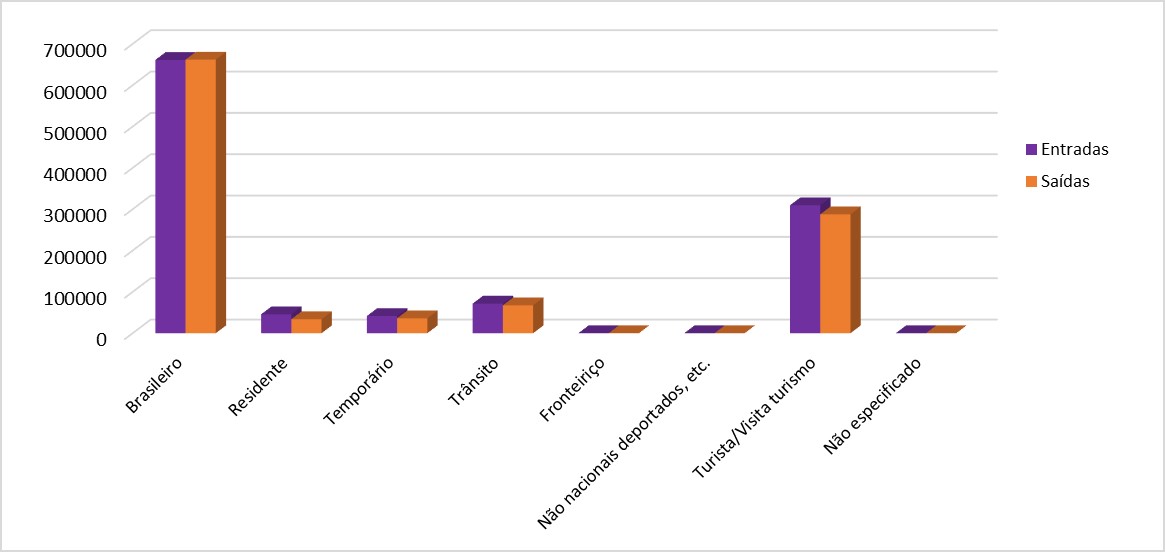
The balance between arrivals and departures in October was positive for almost all categories, except for Brazilians and non-nationals who were deported. However, these differences were very small (Graph 4).
GRAPH 3
Cross-border movements, by month of registration, Brazil 2019/2023.
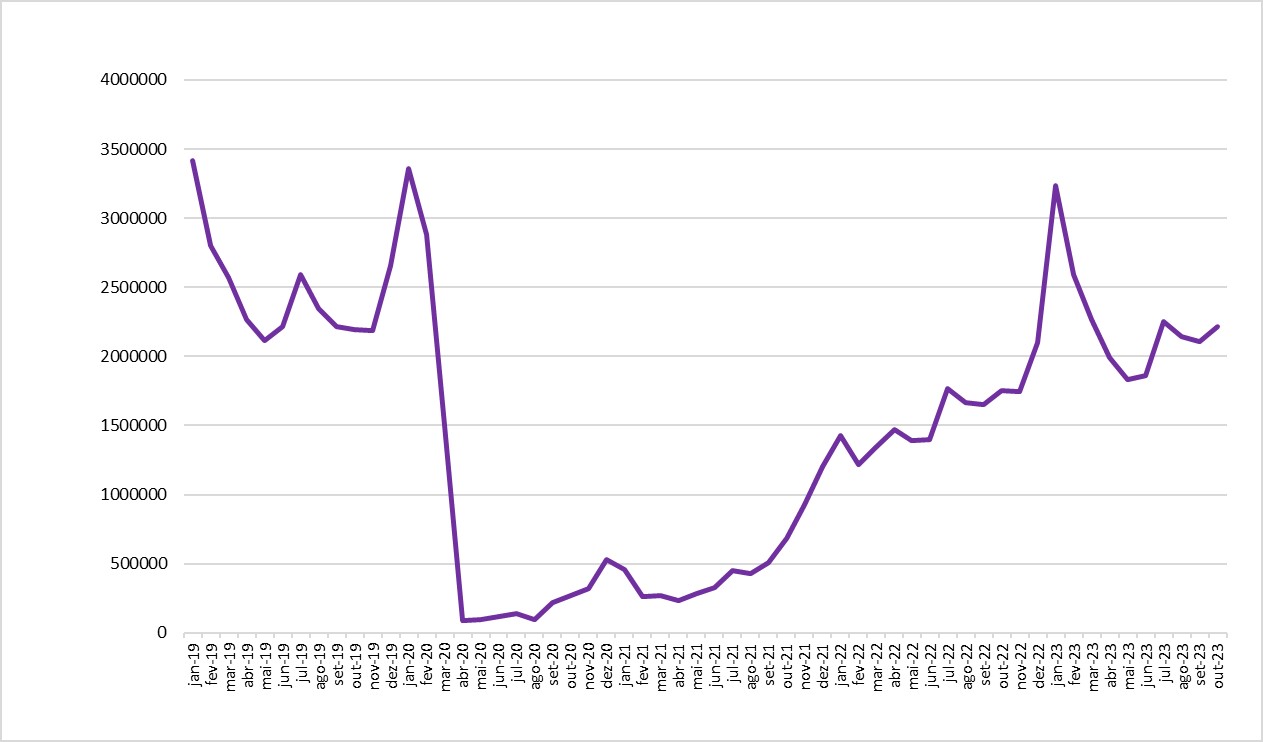
Source: OBMigra (October 2023), based on data from the Brazilian Federal Police, International Traffic System (STI).
GRAPH 4
Cross-border movements of people, according to typology - Brazil, October 2023.
Source: OBMigra (October 2023), based on data from the Brazilian Federal Police, International Traffic System (STI).
SISMIGRA
SisMigra (National Migration Registry System)
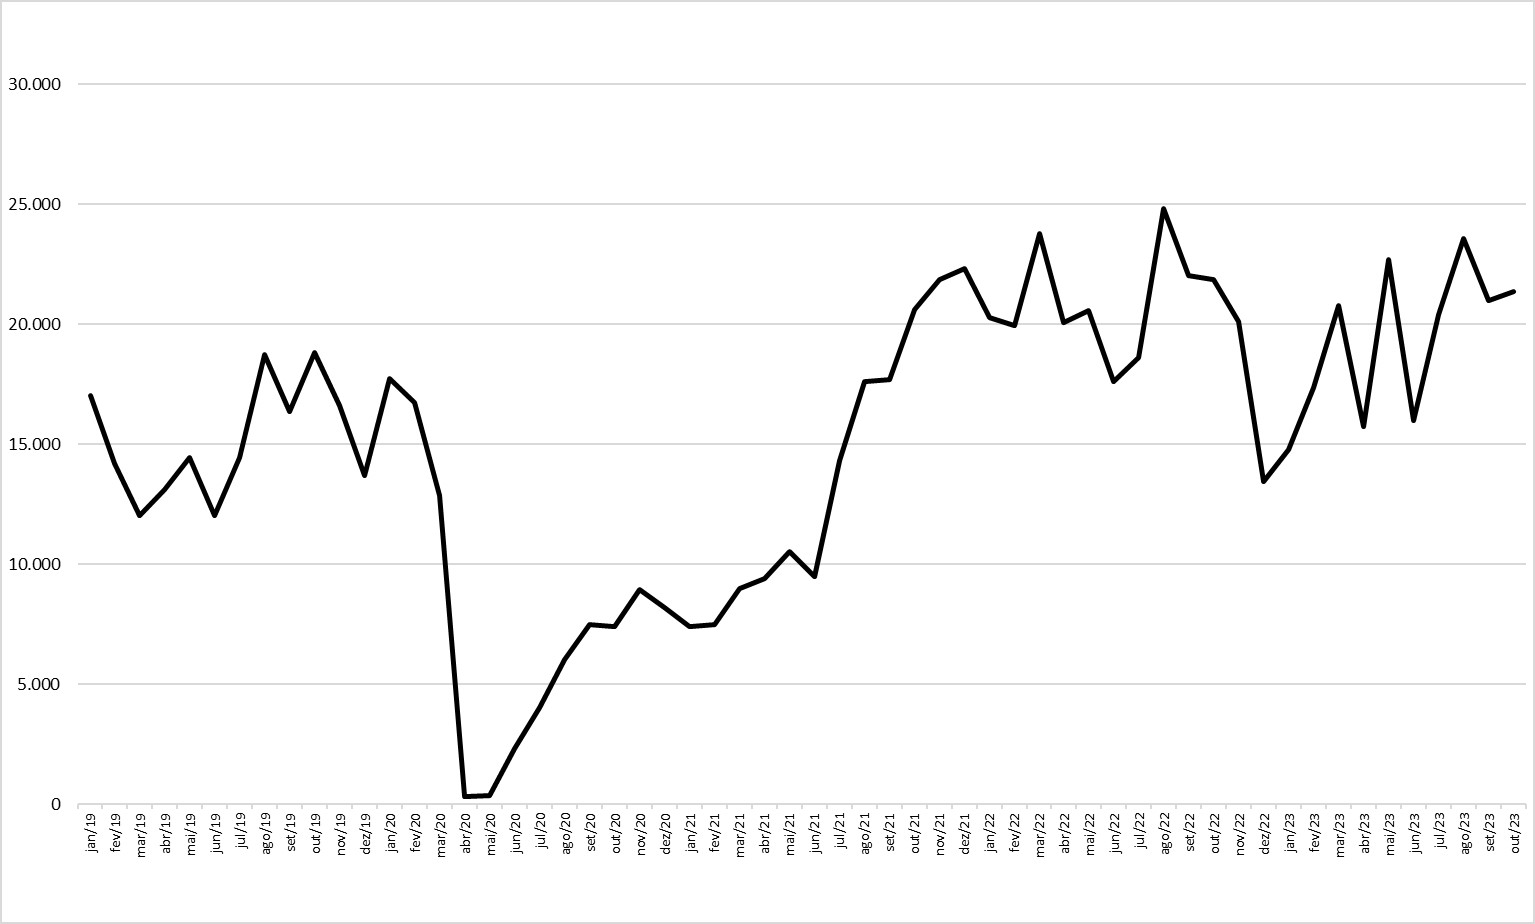
The volume of residence registrations in October remained practically stable compared to the previous month, with a slight increase of 1.9% (Graph 5).
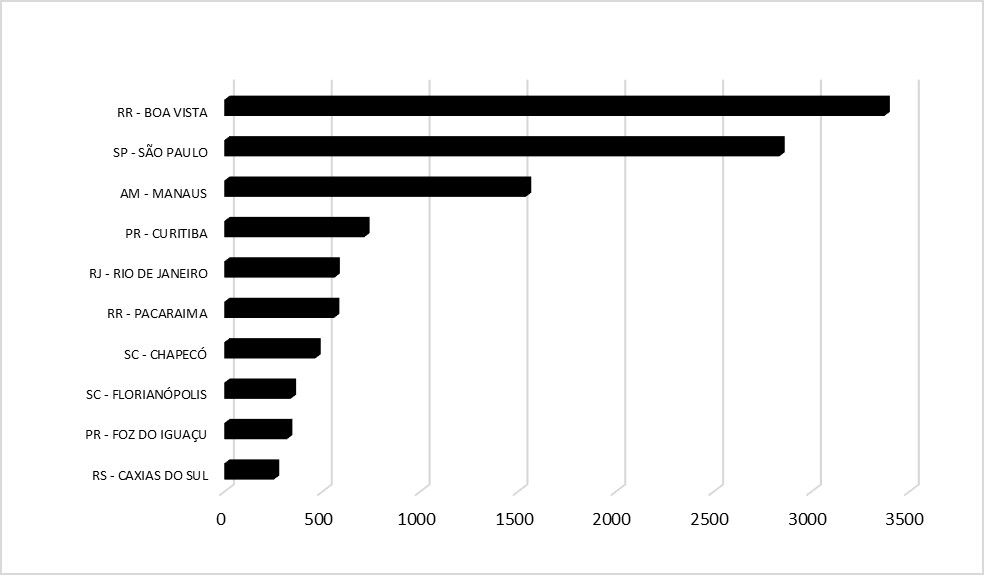
Boa Vista (RR), São Paulo (SP), and Manaus (AM) were the cities that registered the most immigrants in October (Graph 6).
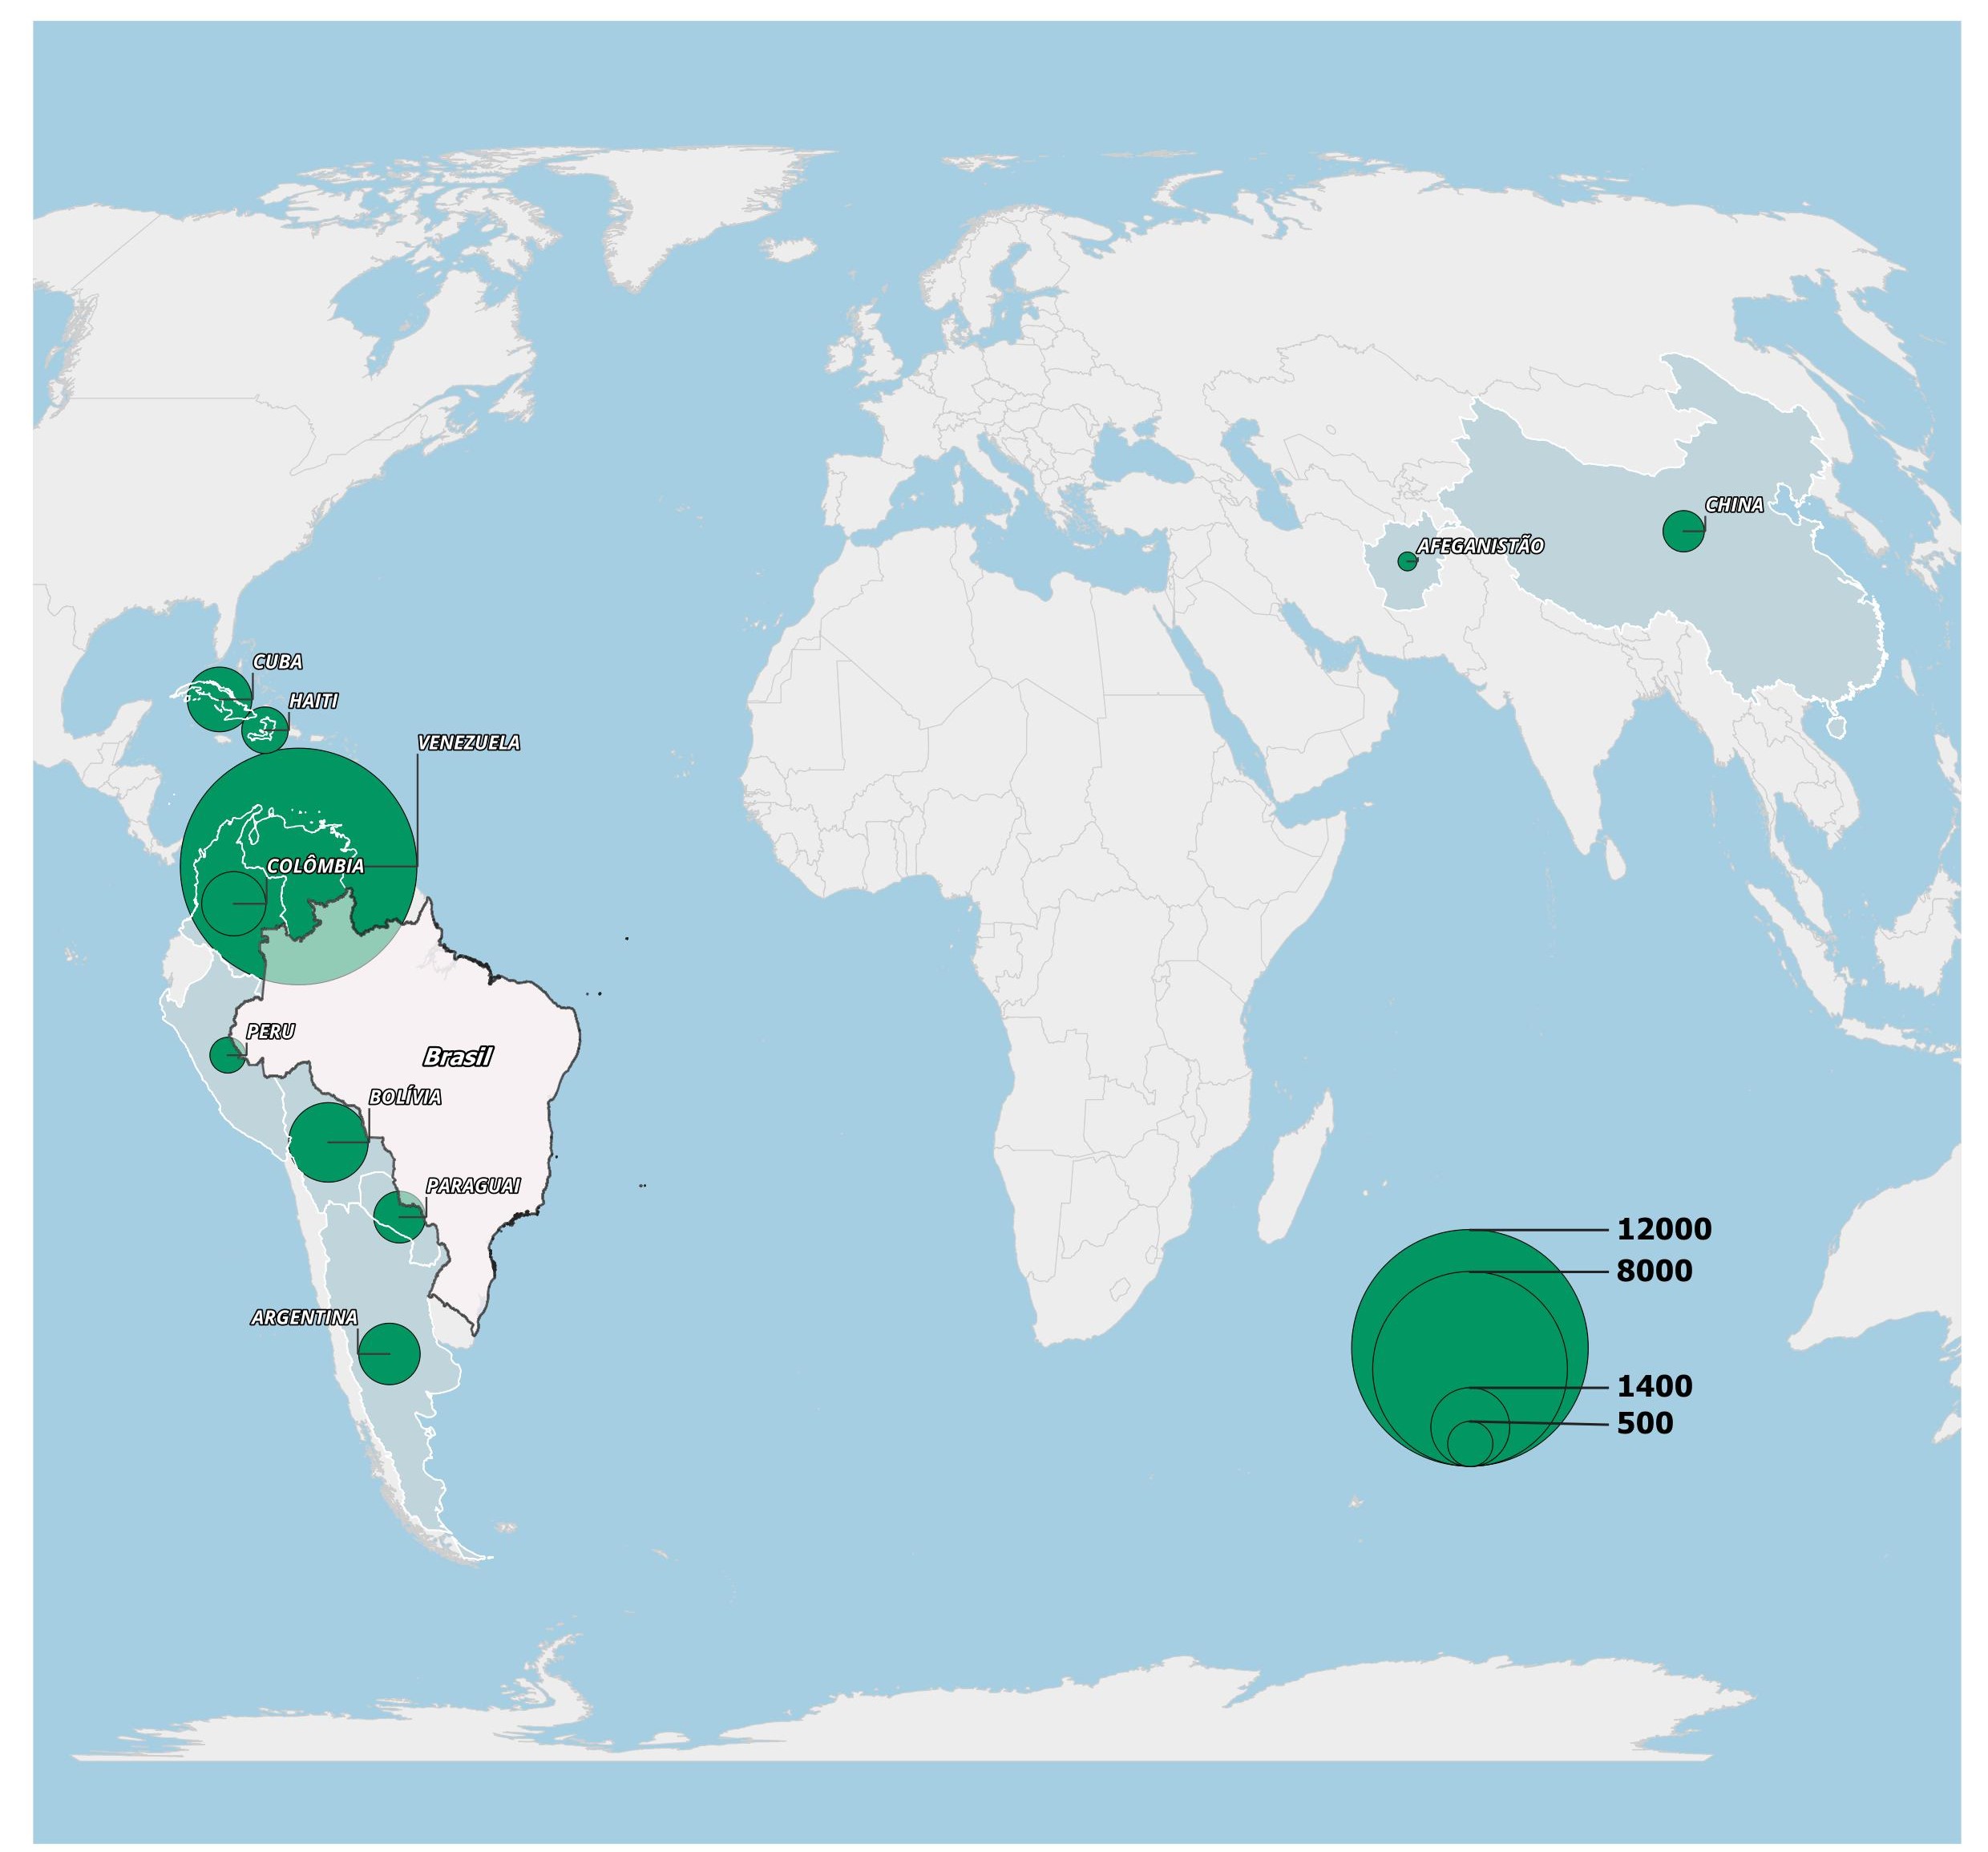
Venezuelans and Bolivians were the nationalities with the most registrations in October. Notably, there was almost no variation in the number of Venezuelan registrations compared to September (Map 2).
GRAPH 5
Number of immigrant registrations, by month of registration - Brazil, 2019/2023.
Source: OBMigra (2023), based on data from the Brazilian Federal Police, National Migration Registry System (SISMIGRA).
GRAPH 6
Number of migrant registrations, by main municipalities, Brazil - October 2023.
Source: OBMigra (2023), based on data from the Brazilian Federal Police, National Migration Registry System (SISMIGRA).
Map 2
Number of immigrant registrations, by main countries of birth, October 2023.
Source: OBMigra (2023), based on data from the Brazilian Federal Police, National Migration Registry System (SISMIGRA).
Solicitantes
Asylum seekers (Sisconare)
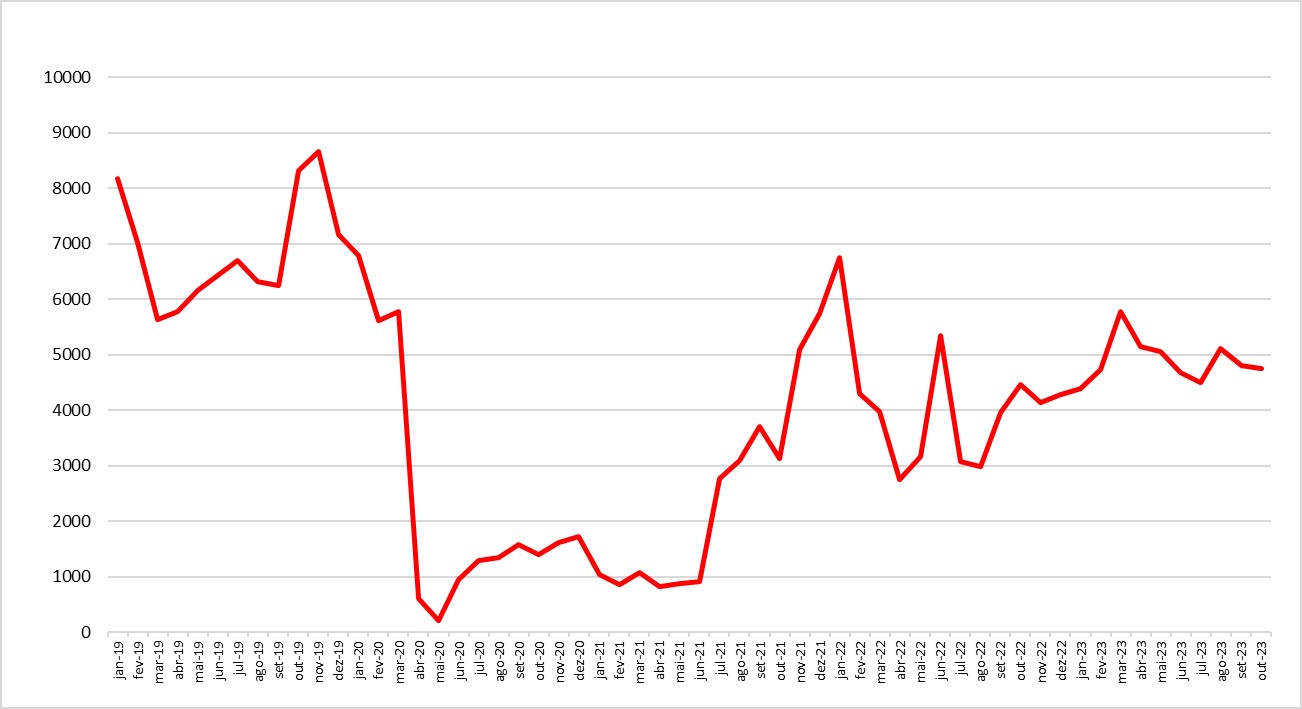
The number of asylum applications fell slightly by 0.9% in October compared to the previous month (Graph 7).
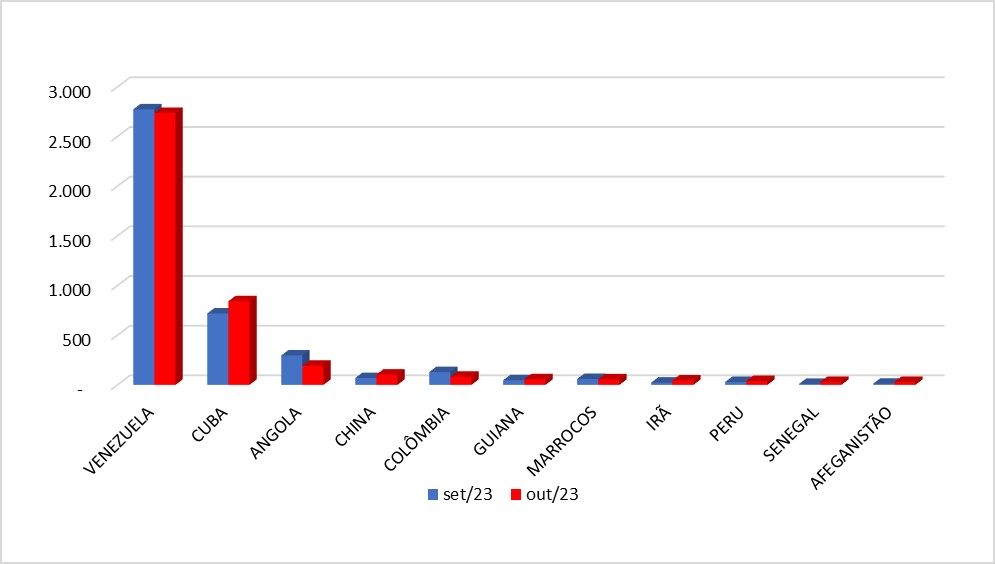
The stability in applications from Venezuelans and the reduction in applications from Angolans help explain the overall result observed for the month (Graph 8).
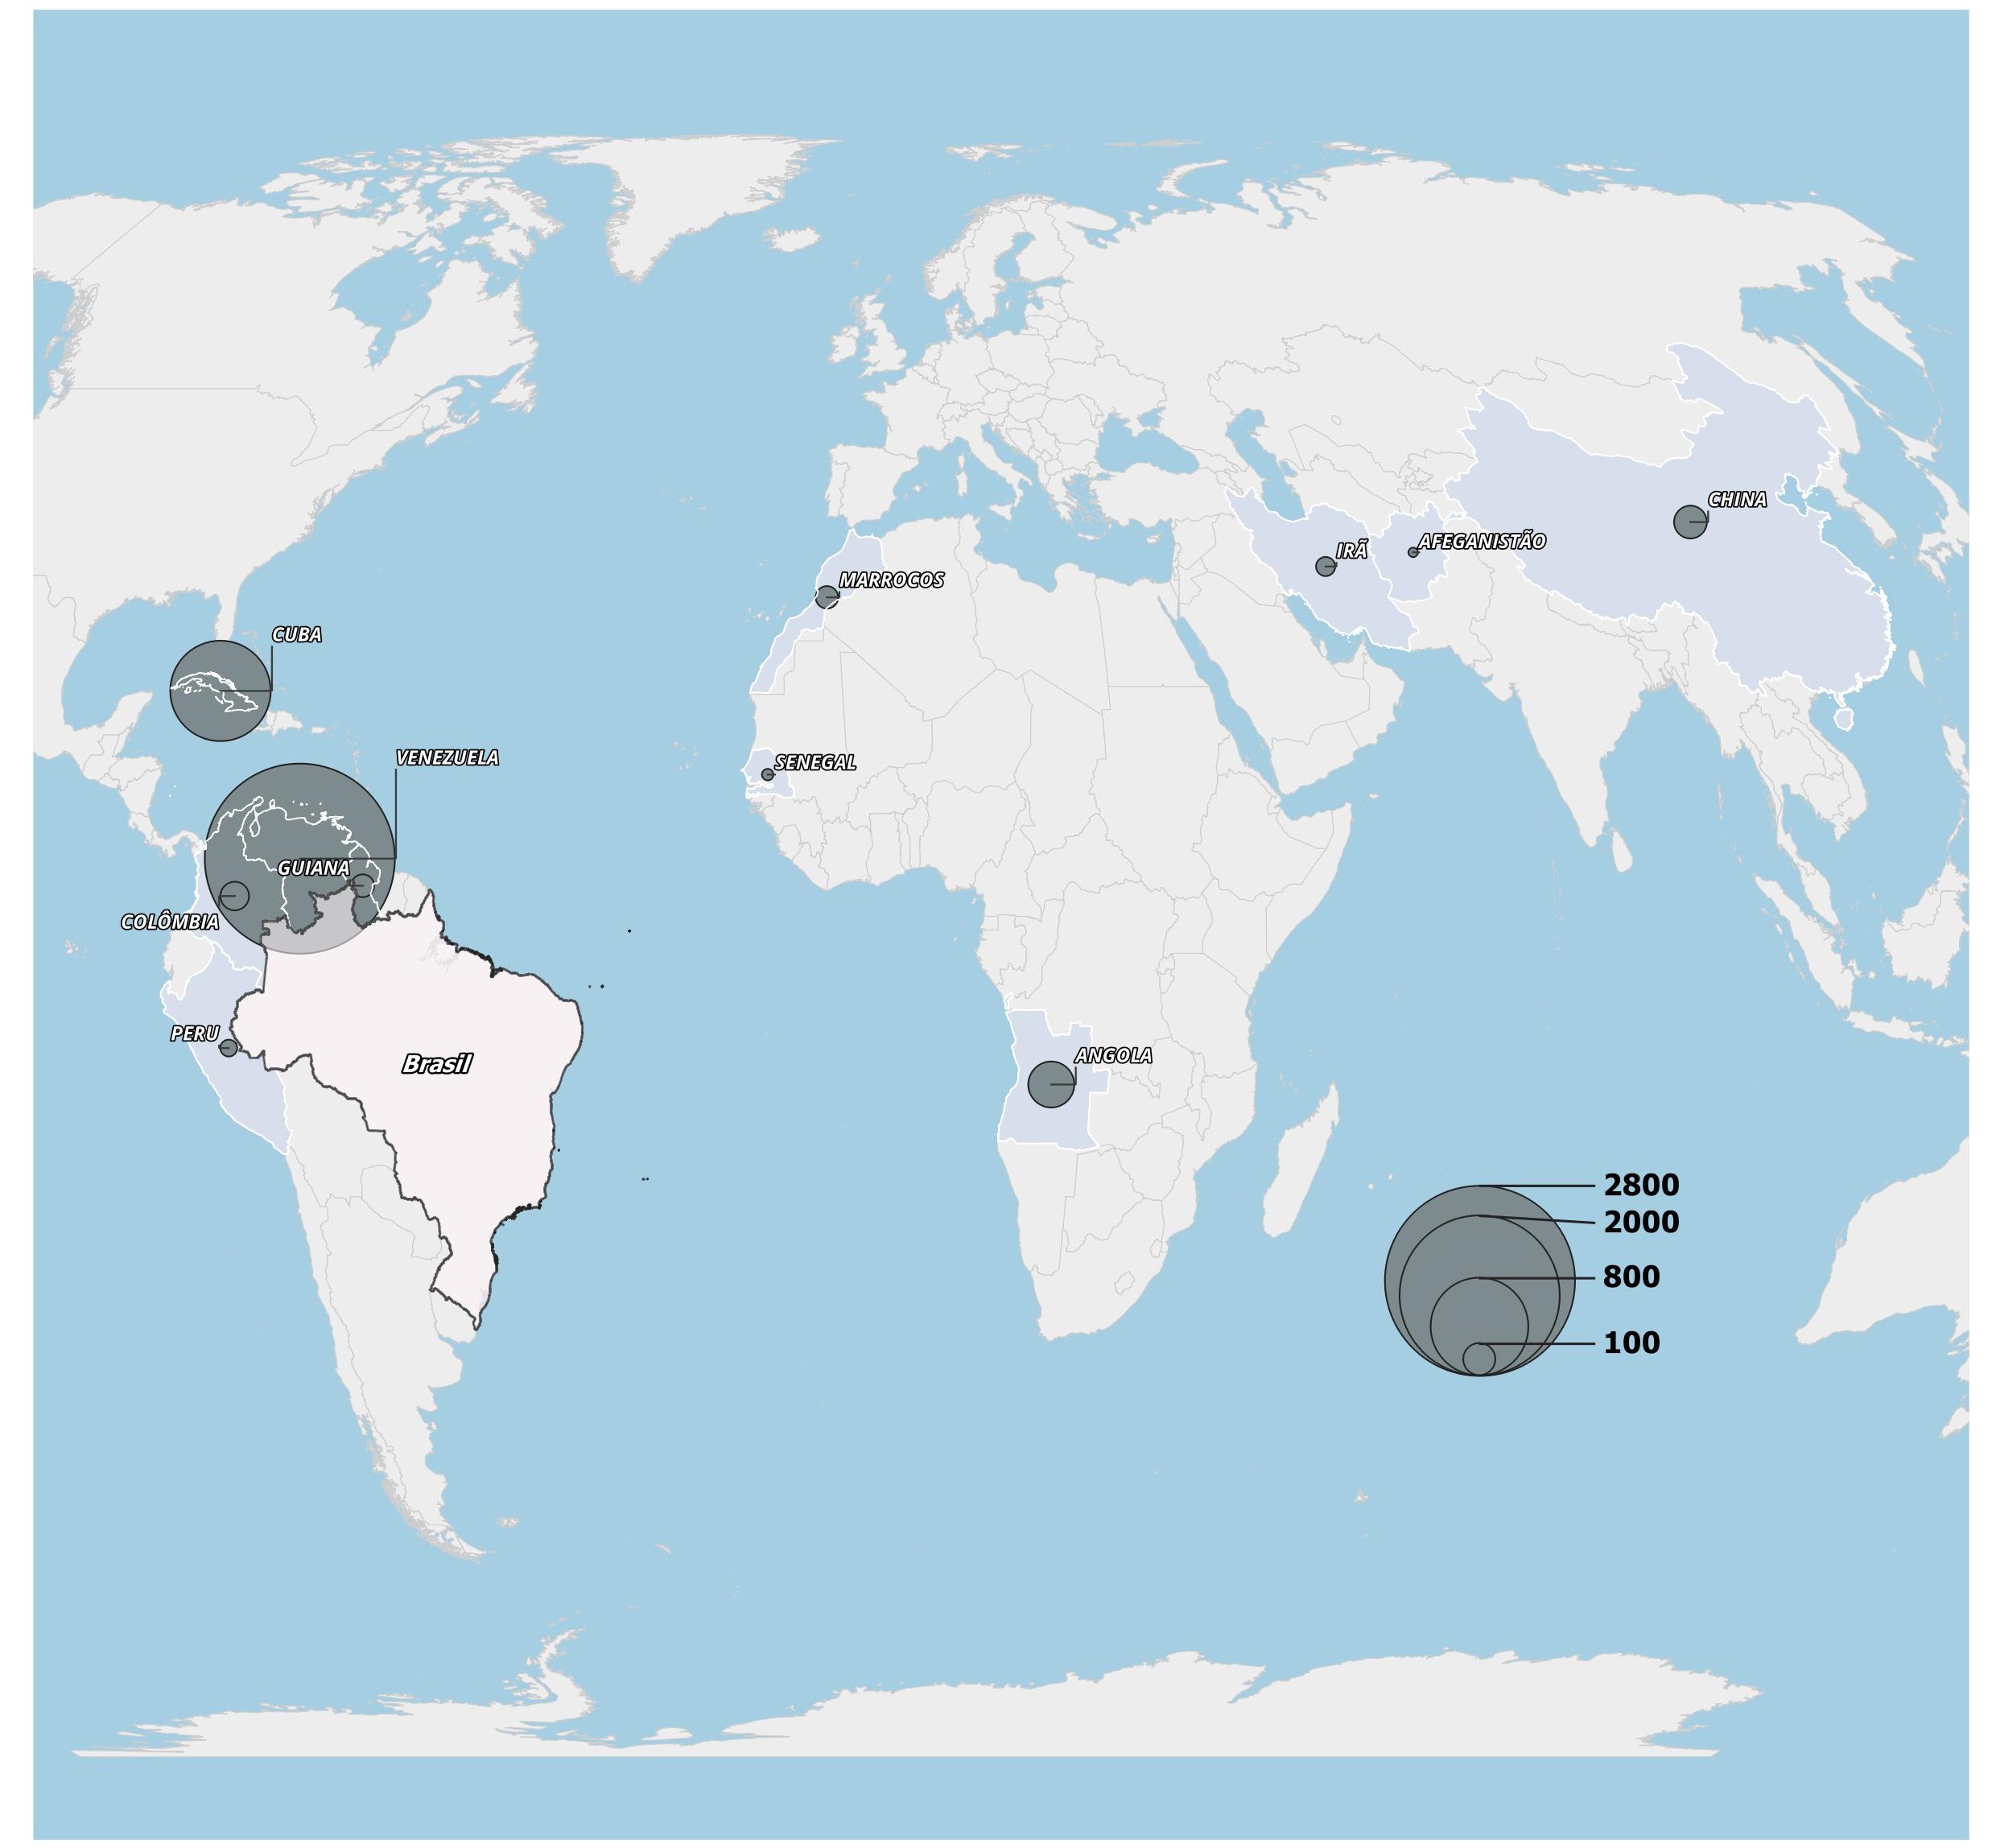
Despite the slight reduction, Venezuelans remained the main nationality applying for asylum in October, followed by Cubans, with Angolans and Colombians trailing further behind (Map 3).
GRAPH 7
Number of applications for recognition of refugee status, by month of registration - Brazil, 2019-2023.
Source: OBMigra (2023), based on data from the General Coordination of the National Committee for Refugees, Asylum Claims.
GRAPH 8
Number of applications for recognition of refugee status, by month and main countries - Brazil, September and October 2023.
Source: OBMigra (2023), based on data from the General Coordination of the National Committee for Refugees, Asylum Claims.
MAP 3
Number of applications for recognition of refugee status, according to country, October 2023
Source: OBMigra (2023), based on data from the General Coordination of the National Committee for Refugees, Asylum Claims.
Decisões
Decisions on asylum applications (Sisconare)
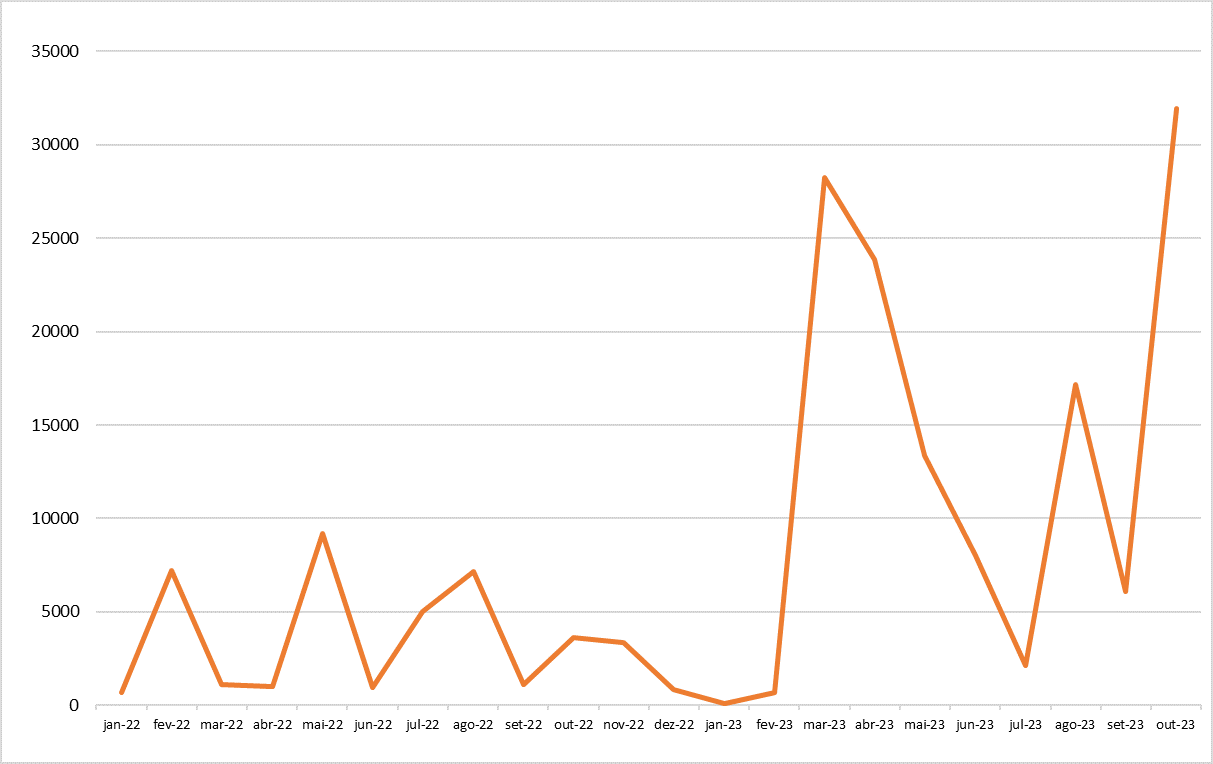
The number of decisions on asylum applications in October was the highest recorded in the entire historical series, which began in January 2022 (Graph 9).
The most commonly adopted decision was to grant asylum, which largely favored Venezuelan applicants (Graph 10).
GRAPH 9
Number of decisions on asylum applications - Brazil, 2022-2023
Source: OBMigra (2023), based on data from the General Coordination of the National Committee for Refugees (SISCONARE).
GRAPH 10
Number of refugees granted asylum, according to main nationalities - Brazil, October 2023
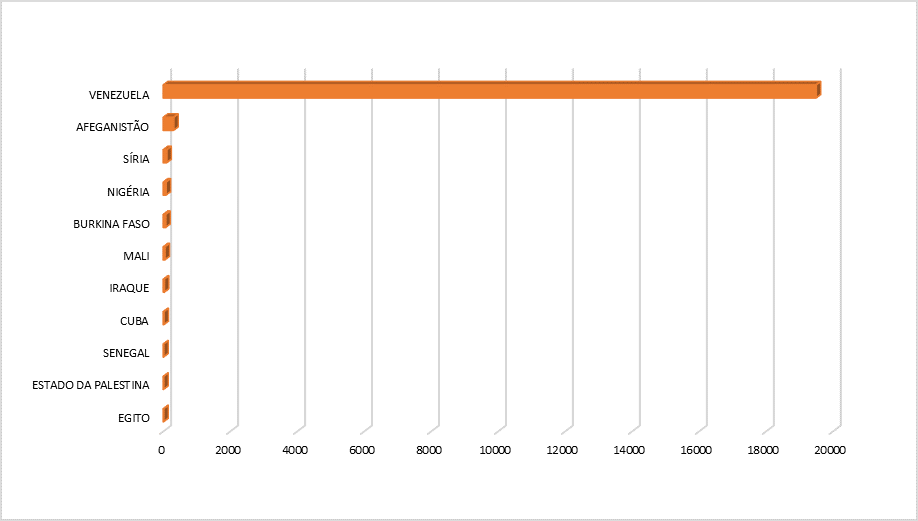
Source: OBMigra (2023), based on data from the General Coordination of the National Committee for Refugees (SISCONARE).
Naturalizações
Naturalizations
Starting in October, OBMigra will publish unprecedented data on naturalization processes. Over the course of 2023, more than 8,000 cases were authorized. Compared to September, there was a 37.0% increase, while the year-on-year variation was a positive 8.6%.
The main nationalities to naturalize as Brazilians were Haitian and Cuban (Graph 11).
These individuals were primarily aged between 25 and 49, with a notable number of people under 15 also obtaining Brazilian nationality (Graph 12). From the perspective of physical distribution, most of these naturalized individuals lived in the Southeast and South regions, particularly in the states of São Paulo, Santa Catarina, Rio Grande do Sul, and Paraná.
GRAPH 11
Number of naturalized Brazilians, according to previous nationality - Brazil, October 2023
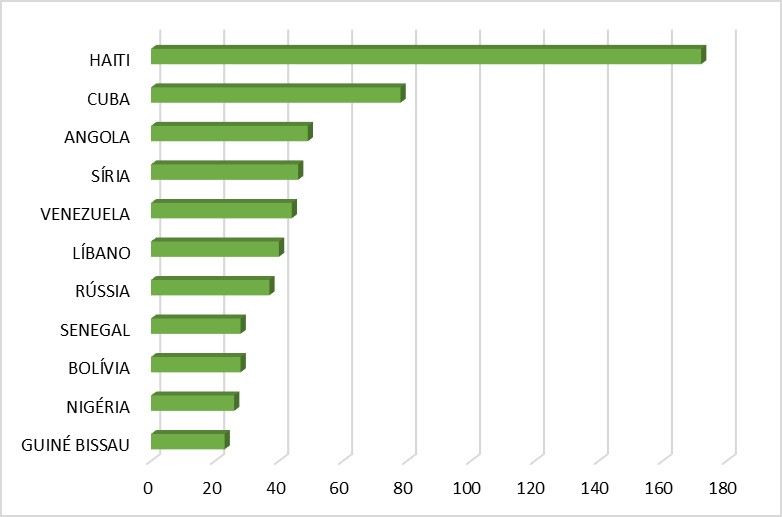
Source: OBMigra (October, 2023), based on data from the General Coordination of Immigration Policy (CGPMIG).
GRAPH 12
Number of naturalized Brazilians, according to age group - Brazil, October 2023
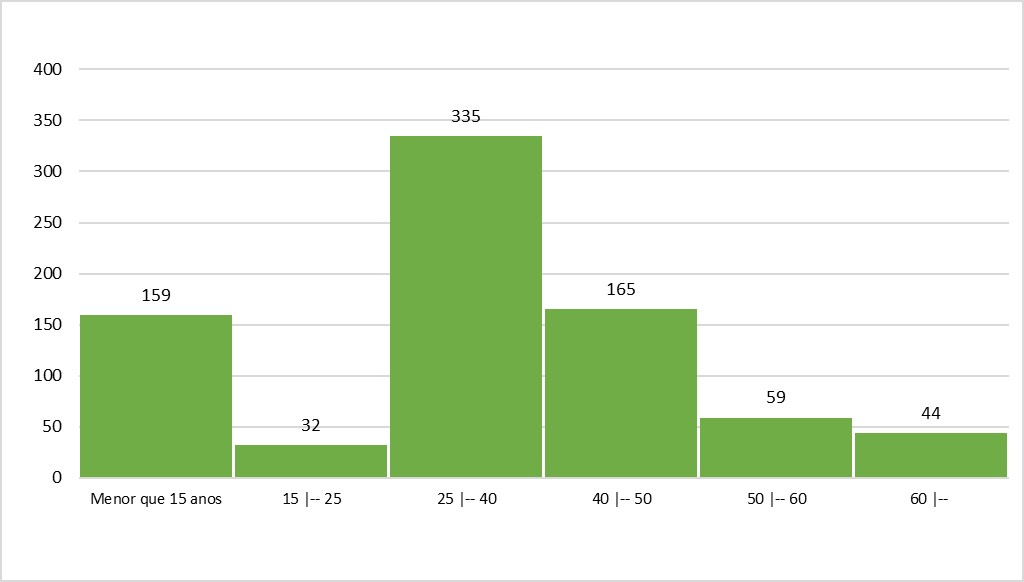
Source: OBMigra (October, 2023), based on data from the General Coordination of Immigration Policy (CGPMIG).
CGIL
CGIL (General Coordination of Labor Immigration)
The volume of residence permits for work and investment purposes in October increased by 51% compared to September. This significant increase was due to the task force created to expedite the analysis of cases. It was also the highest point in the historical series, which began in January 2019 (Graph 13).
Filipino, Indian, Chinese, and Italian nationals benefited the most from the permits granted in October (Graph 14).
Residence permits for work purposes for skilled workers did not follow the general trend. The number of permits granted to this segment remained practically stable compared to September, with a slight decrease of 2.9%, due to the lower number of permits granted to qualified female workers (Graph 15).
GRAPH 13
Number of work permits for labor and investment purposes, by month of registration - Brazil, 2019-2023
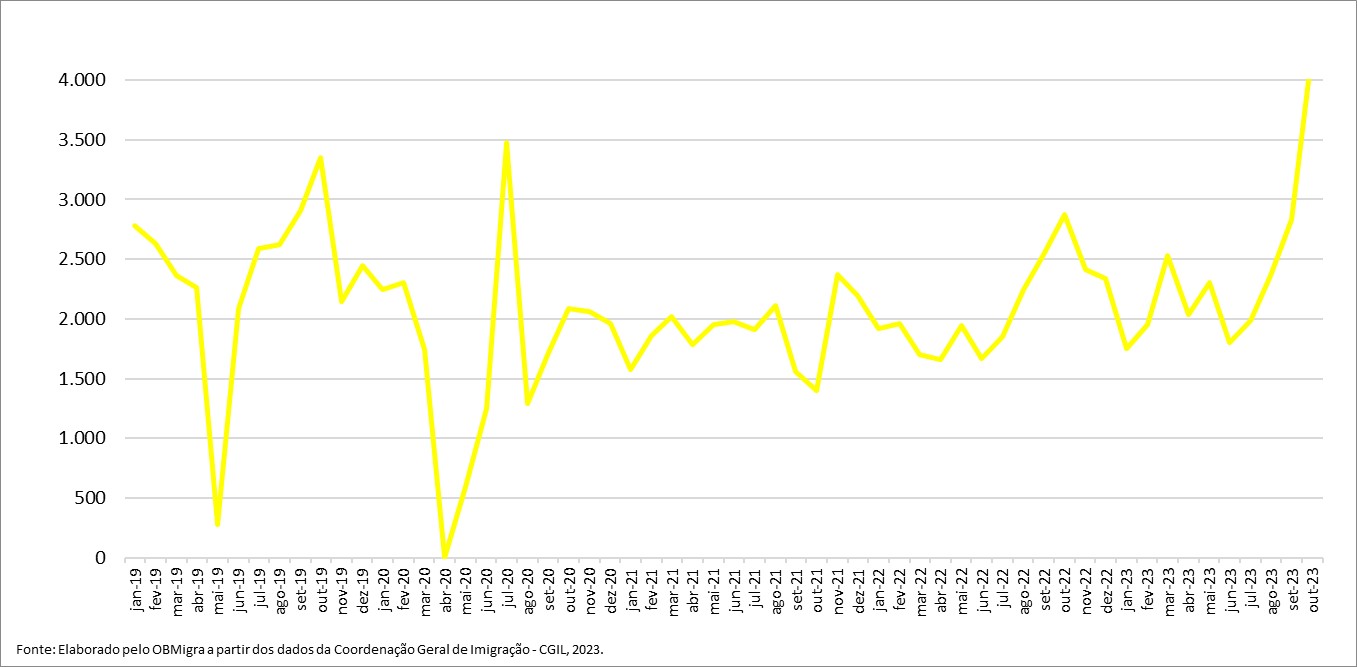
Source: OBMigra (2023), based on data from the General Coordination of Labor Immigration/Ministry of Justice and Public Security.
GRAPH 14
Number of permits granted, by main countries - Brazil, October 2023.
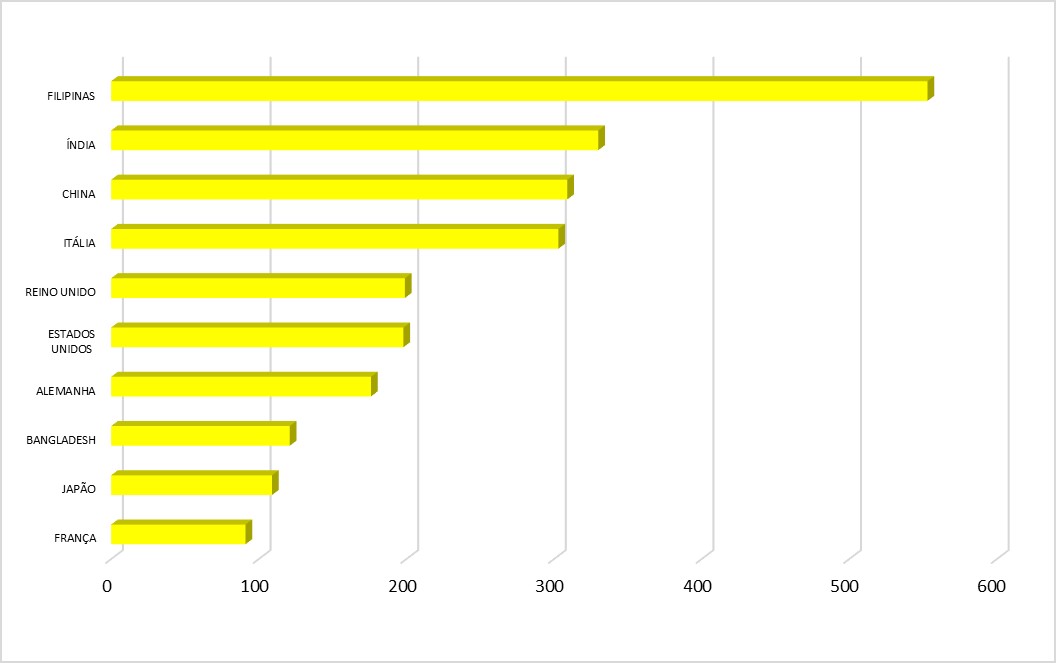
Source: OBMigra (2023), based on data from the General Coordination of Labor Immigration/Ministry of Justice and Public Security.
GRAPH 15
Number of permits granted to skilled workers, by sex, Brazil, September and October, 2023.
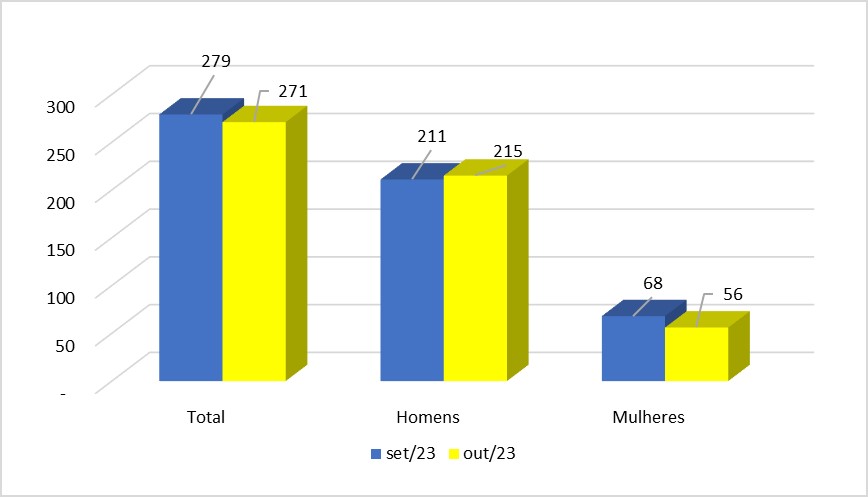
Source: OBMigra (2023), based on data from the General Coordination of Labor Immigration/Ministry of Justice and Public Security.
CTPS/RAIS/NOVO CAGED
Harmonized database CTPS/RAIS/New CAGED
Compared to August, the month of September saw a decrease in the movement of immigrant workers in the formal market. This negative performance was also reflected in the reduction in the number of jobs created, which amounted to -9.3%. However, it's important to note that the balance remains positive and is above the annual average of 3,900 jobs created per month (Graph 16).
Despite the overall reduced dynamism in the month, certain occupations experienced an increase in the number of jobs in the labor market, such as production line feeders, cashiers, snack bar attendants, and retail salespeople (Graph 17).
The South region was where the most jobs were created for immigrant labor, exceeding three times the number in the Southeast, which came in second place (Map 4).
GRAPH 16
Jobs created for immigrants in the formal labor market, by month - Brazil, 2019/2023.
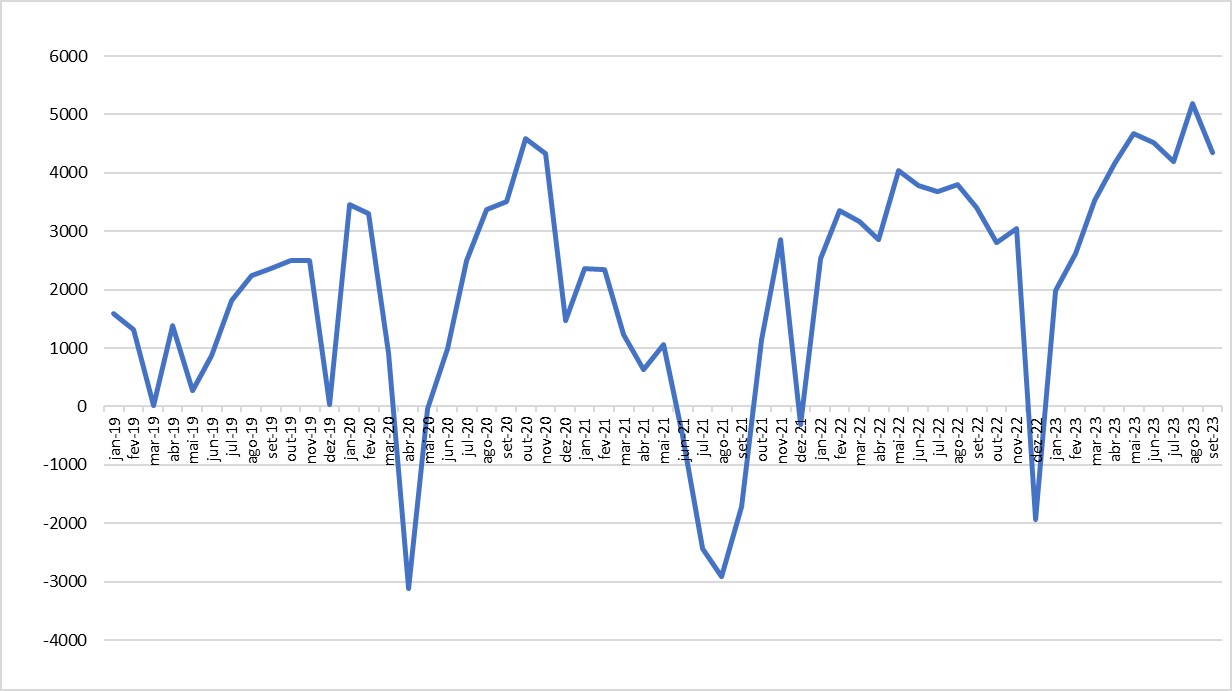
Source: OBMigra (2023), based on data from the harmonized database RAIS-CTPS-CAGED and the Digital System of Tax, Social Security and Labor Obligations (eSocial).
GRAPH 17
Job positions created for migrants in the formal labor market, according to main occupations - Brazil, August and September 2023.
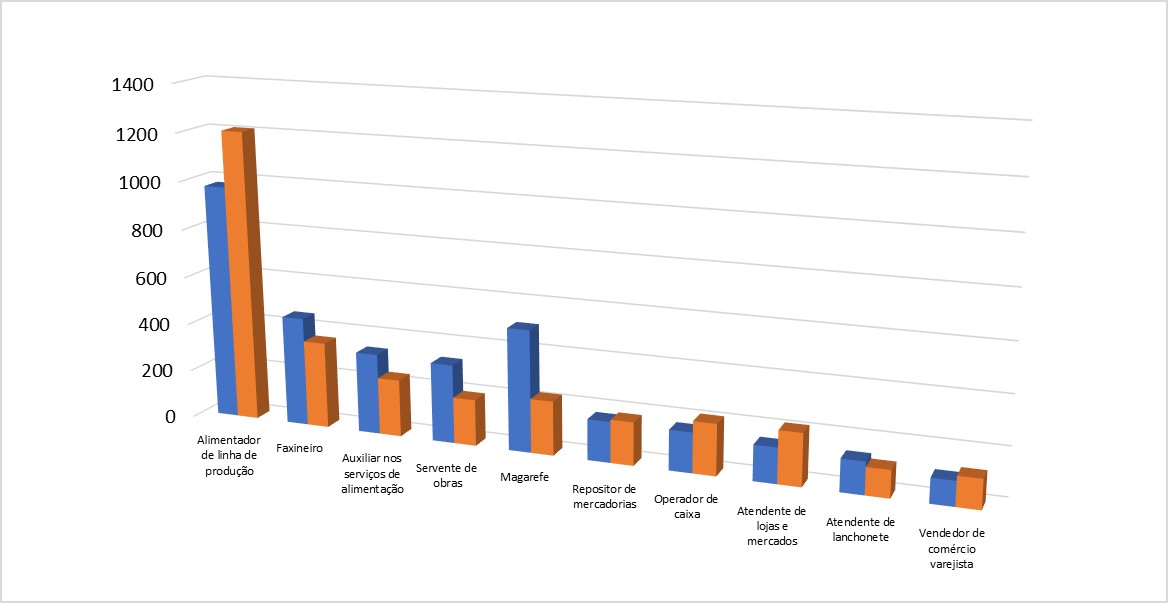
Source: OBMigra (2023), based on data from the harmonized database RAIS-CTPS-CAGED and the Digital System of Tax, Social Security and Labor Obligations (eSocial).
MAP 4
Number of jobs created for immigrants, according to Major Regions, September 2023.
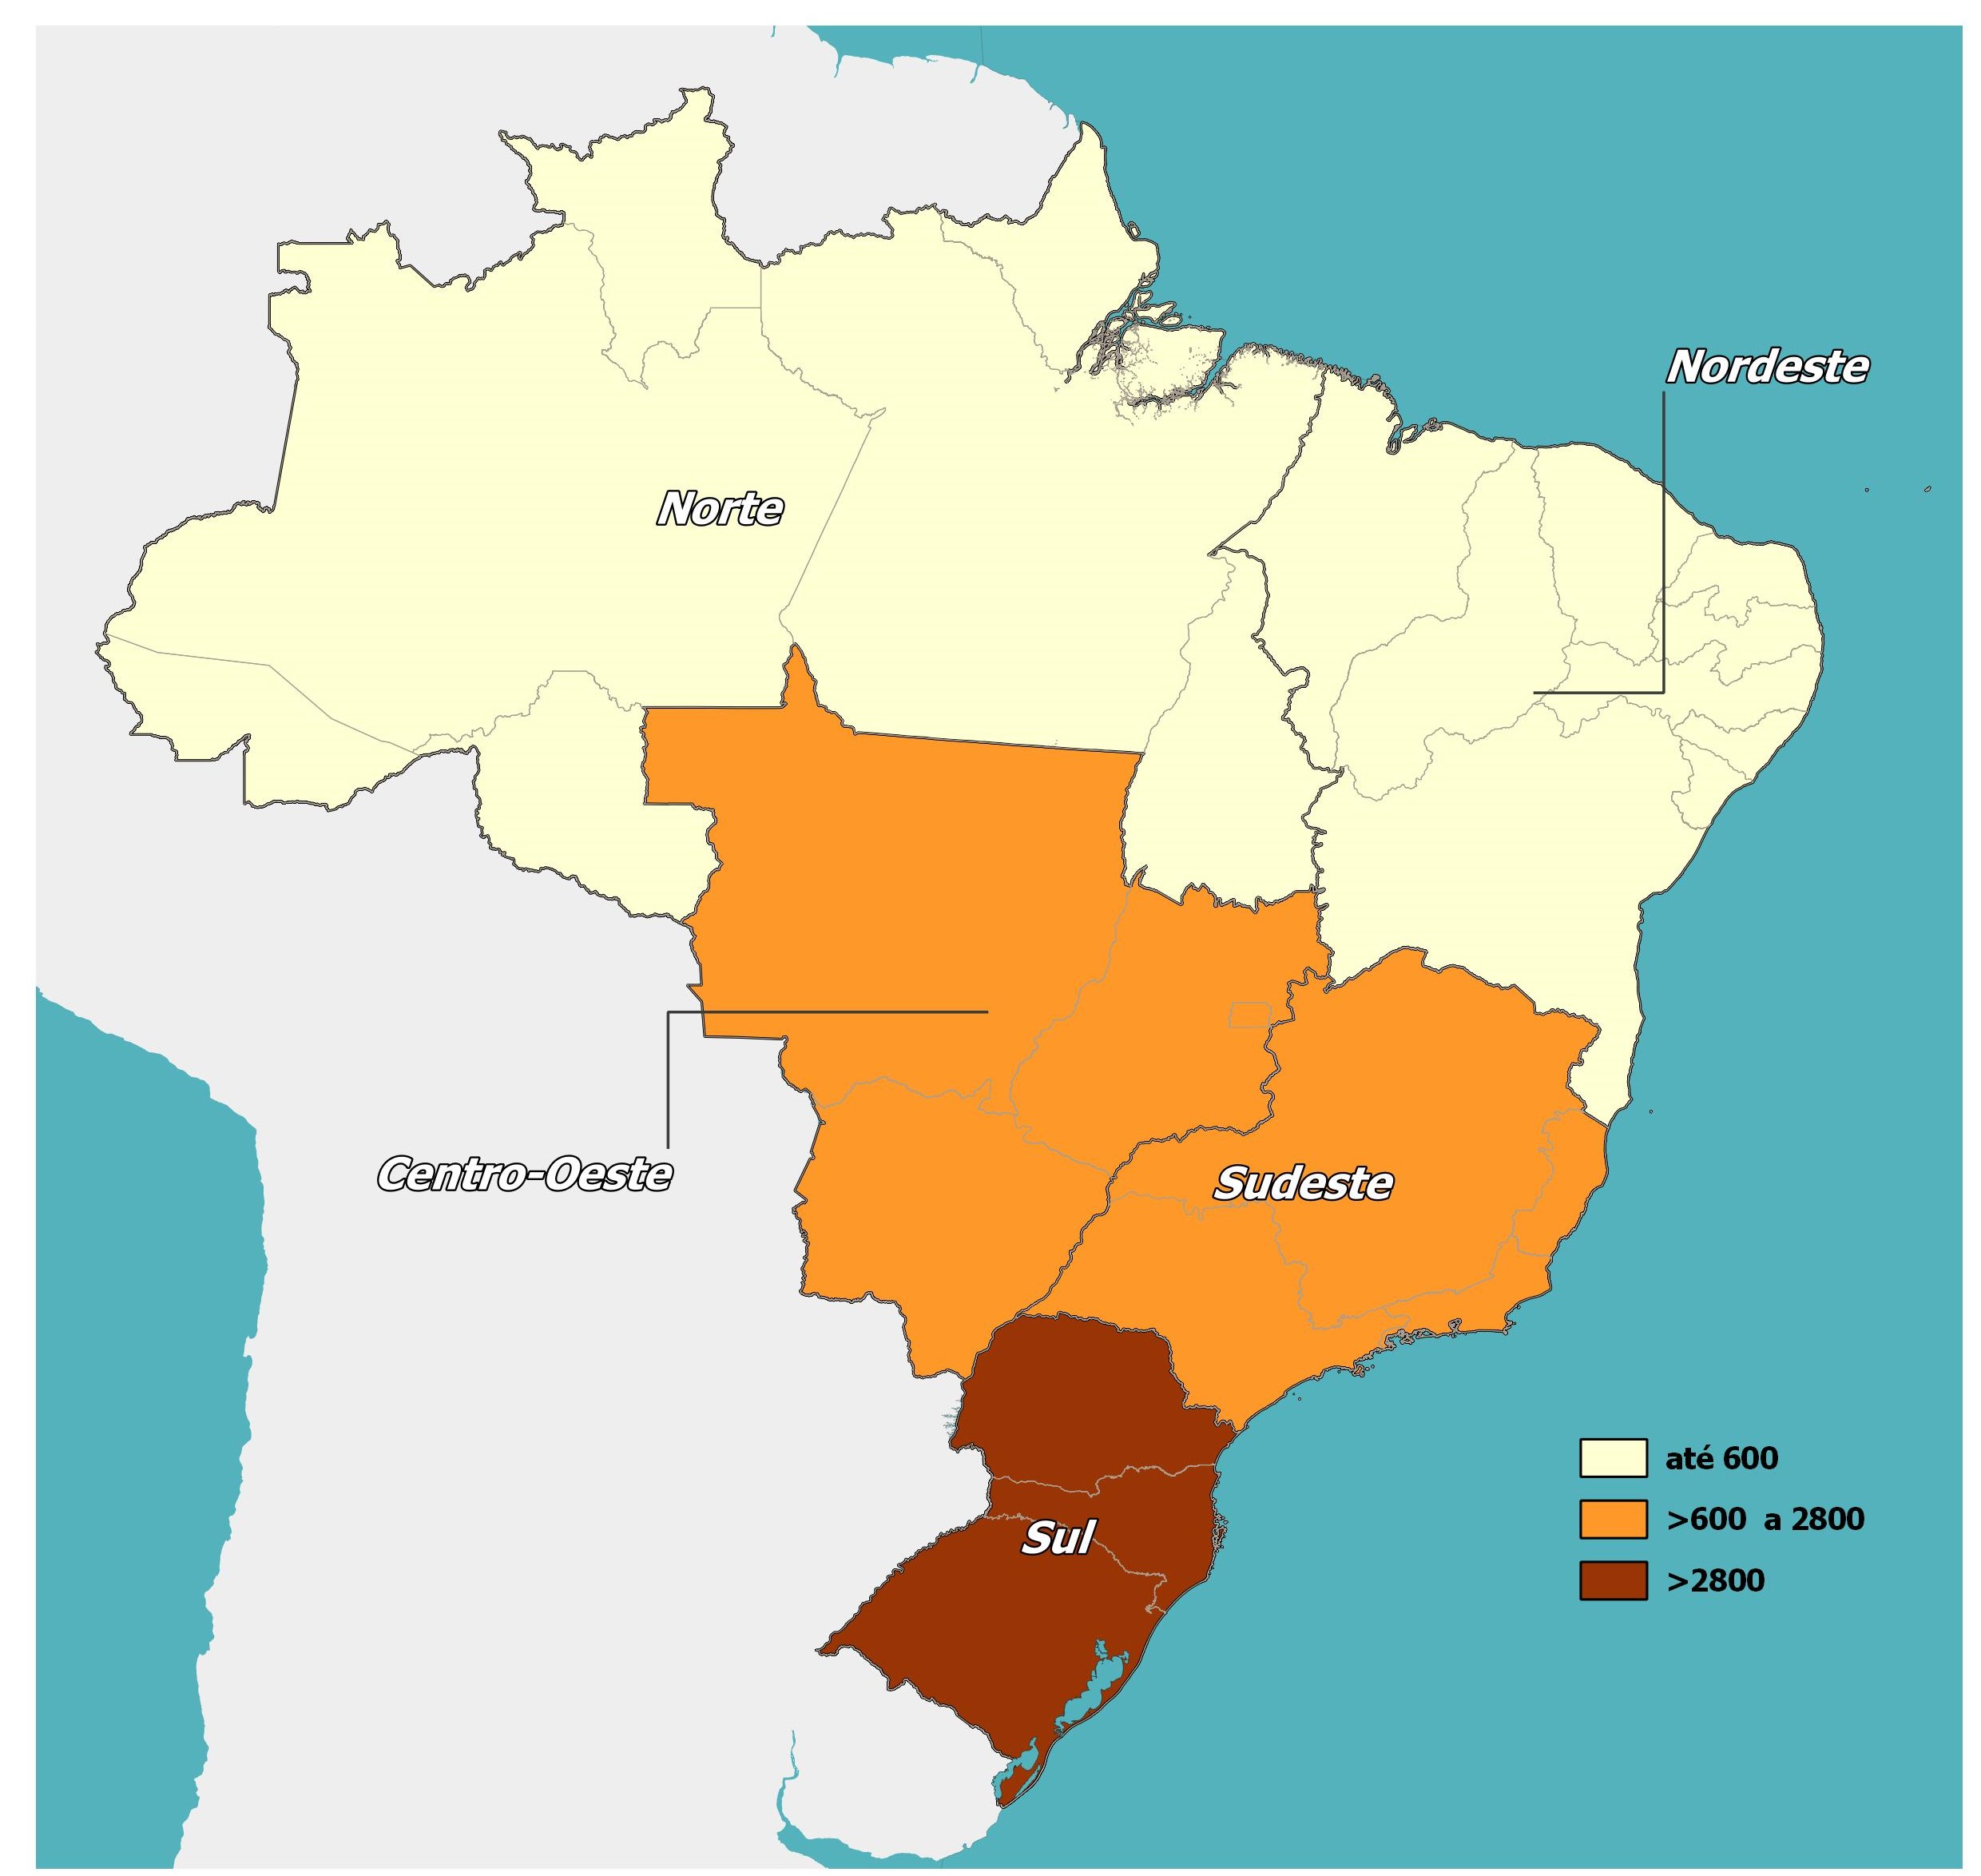
Source: OBMigra (2023), based on data from the harmonized database RAIS-CTPS-CAGED and the Digital System of Tax, Social Security and Labor Obligations (eSocial).
BACEN - Transferências Pessoais
BACEN - Personal Bank Transfer
The balance of personal transfers, which had fluctuated over the period, has been on a negative trend since June 2022. In September, there was a slight drop of -6.5% compared to August (Graph 18). During that month, reductions were observed in both incoming and outgoing transfers, indicating a loss of dynamism in these monetary flows.
The destination of transfers from Brazil remained unchanged, with the USA standing out, followed at a distance by Portugal and the United Kingdom (Map 5).
In terms of resources sent into Brazil, the USA, Portugal, and the United Kingdom hold the top positions, with the latter reclaiming third place in the ranking from Canada, which is now in fourth place (Map 6).
GRAPH 18
Balance of transfers via personal accounts in US$ (millions), by month of remittance - Brazil, 2019-2023.
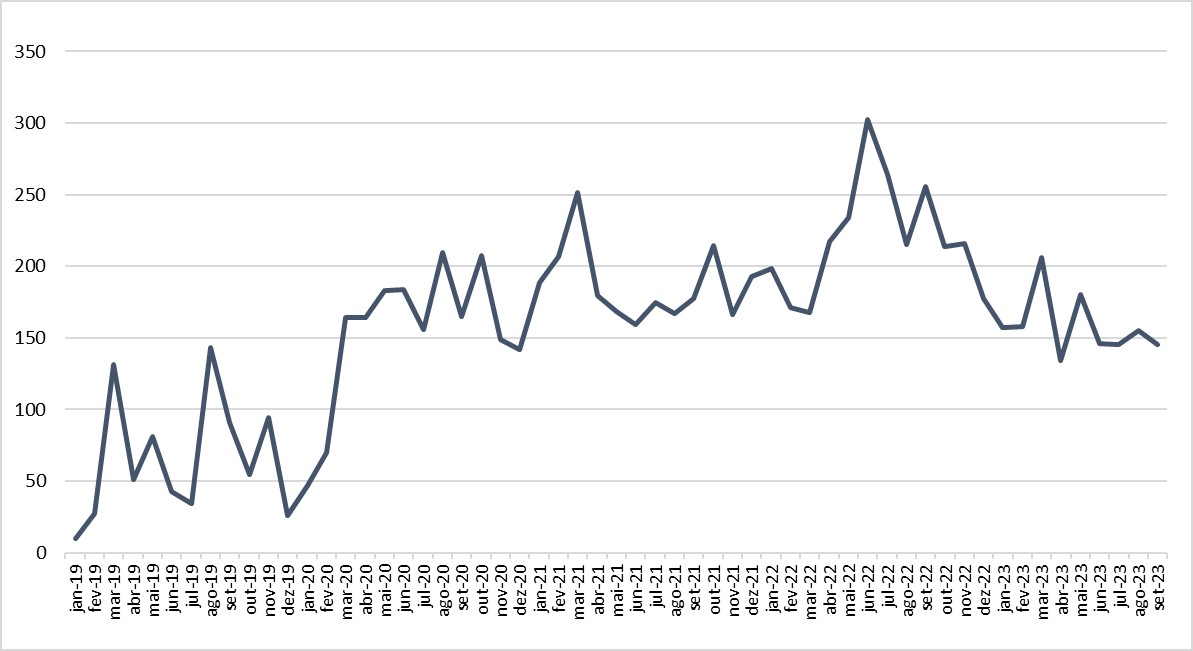
Source: OBMigra (2023), based on data from the Central Bank of Brazil, Department of Statistics.
Map 5
Transfers via personal accounts in US$ (millions), by inflows and by main countries - Brazil, September 2023.
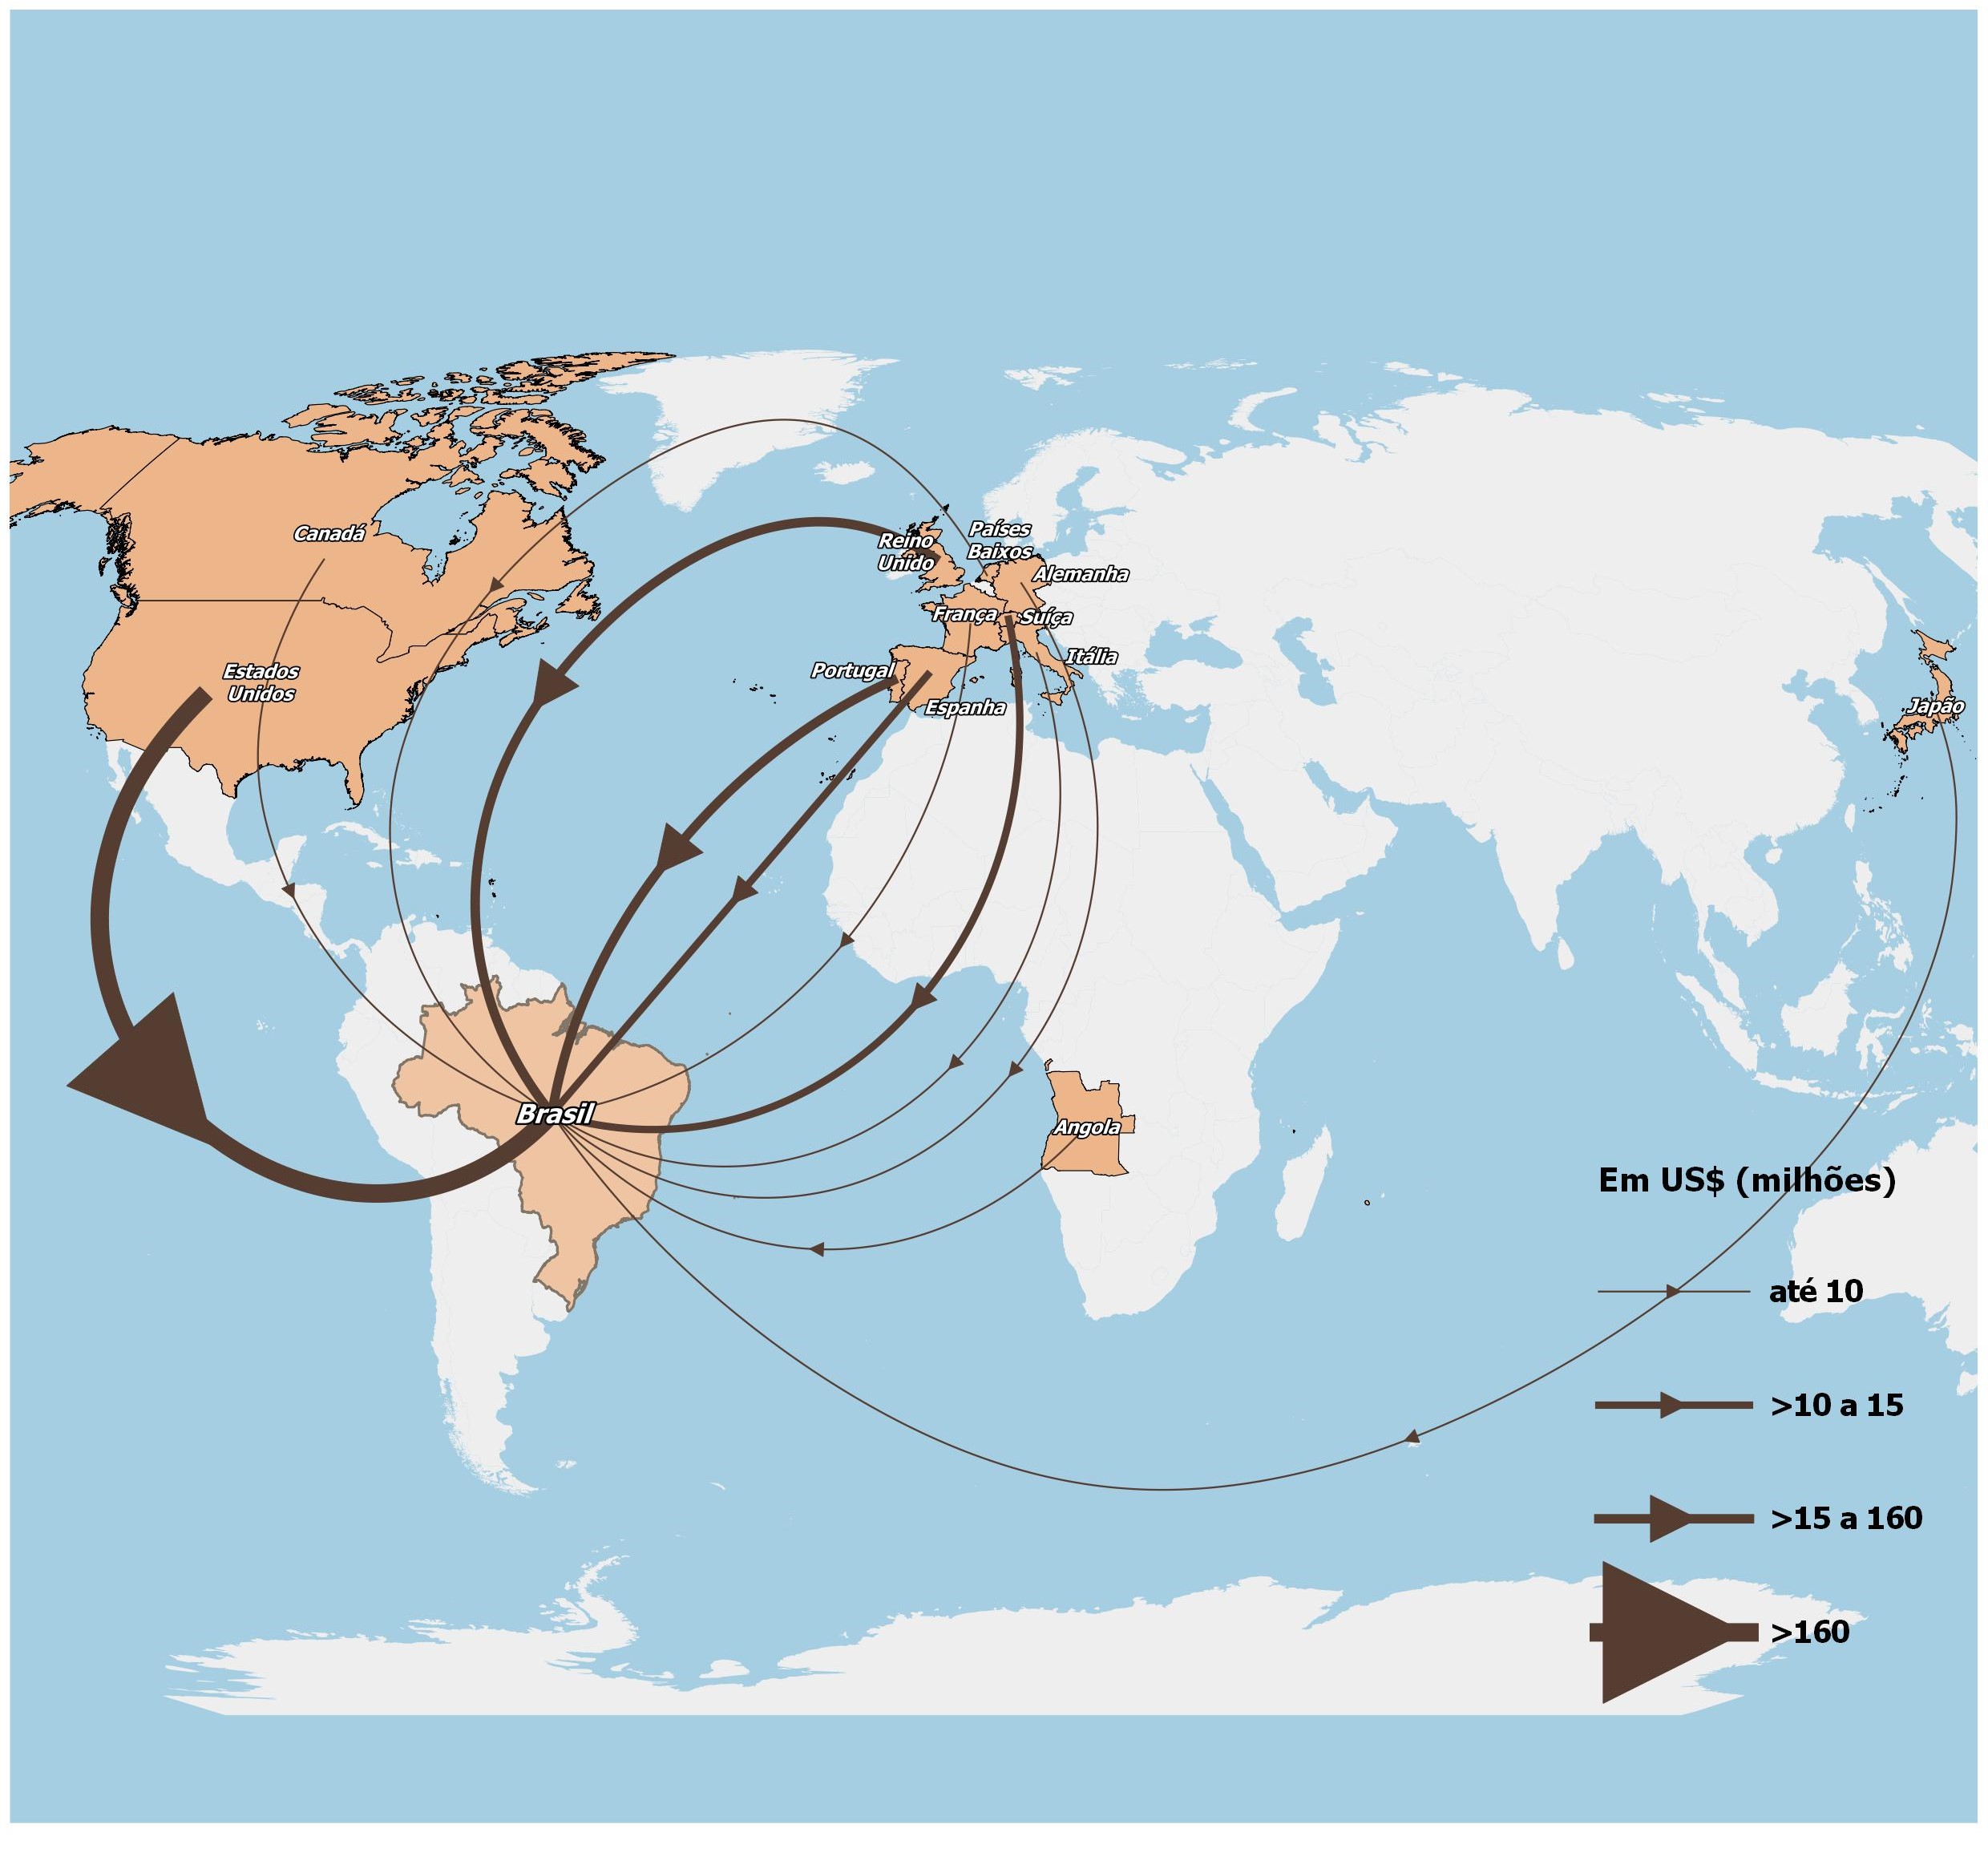
Source: OBMigra (2023), based on data from the Central Bank of Brazil, Department of Statistics.
Map 6
Transfers via personal accounts in US$ (millions), by outflows and by main countries - Brazil, September 2023.
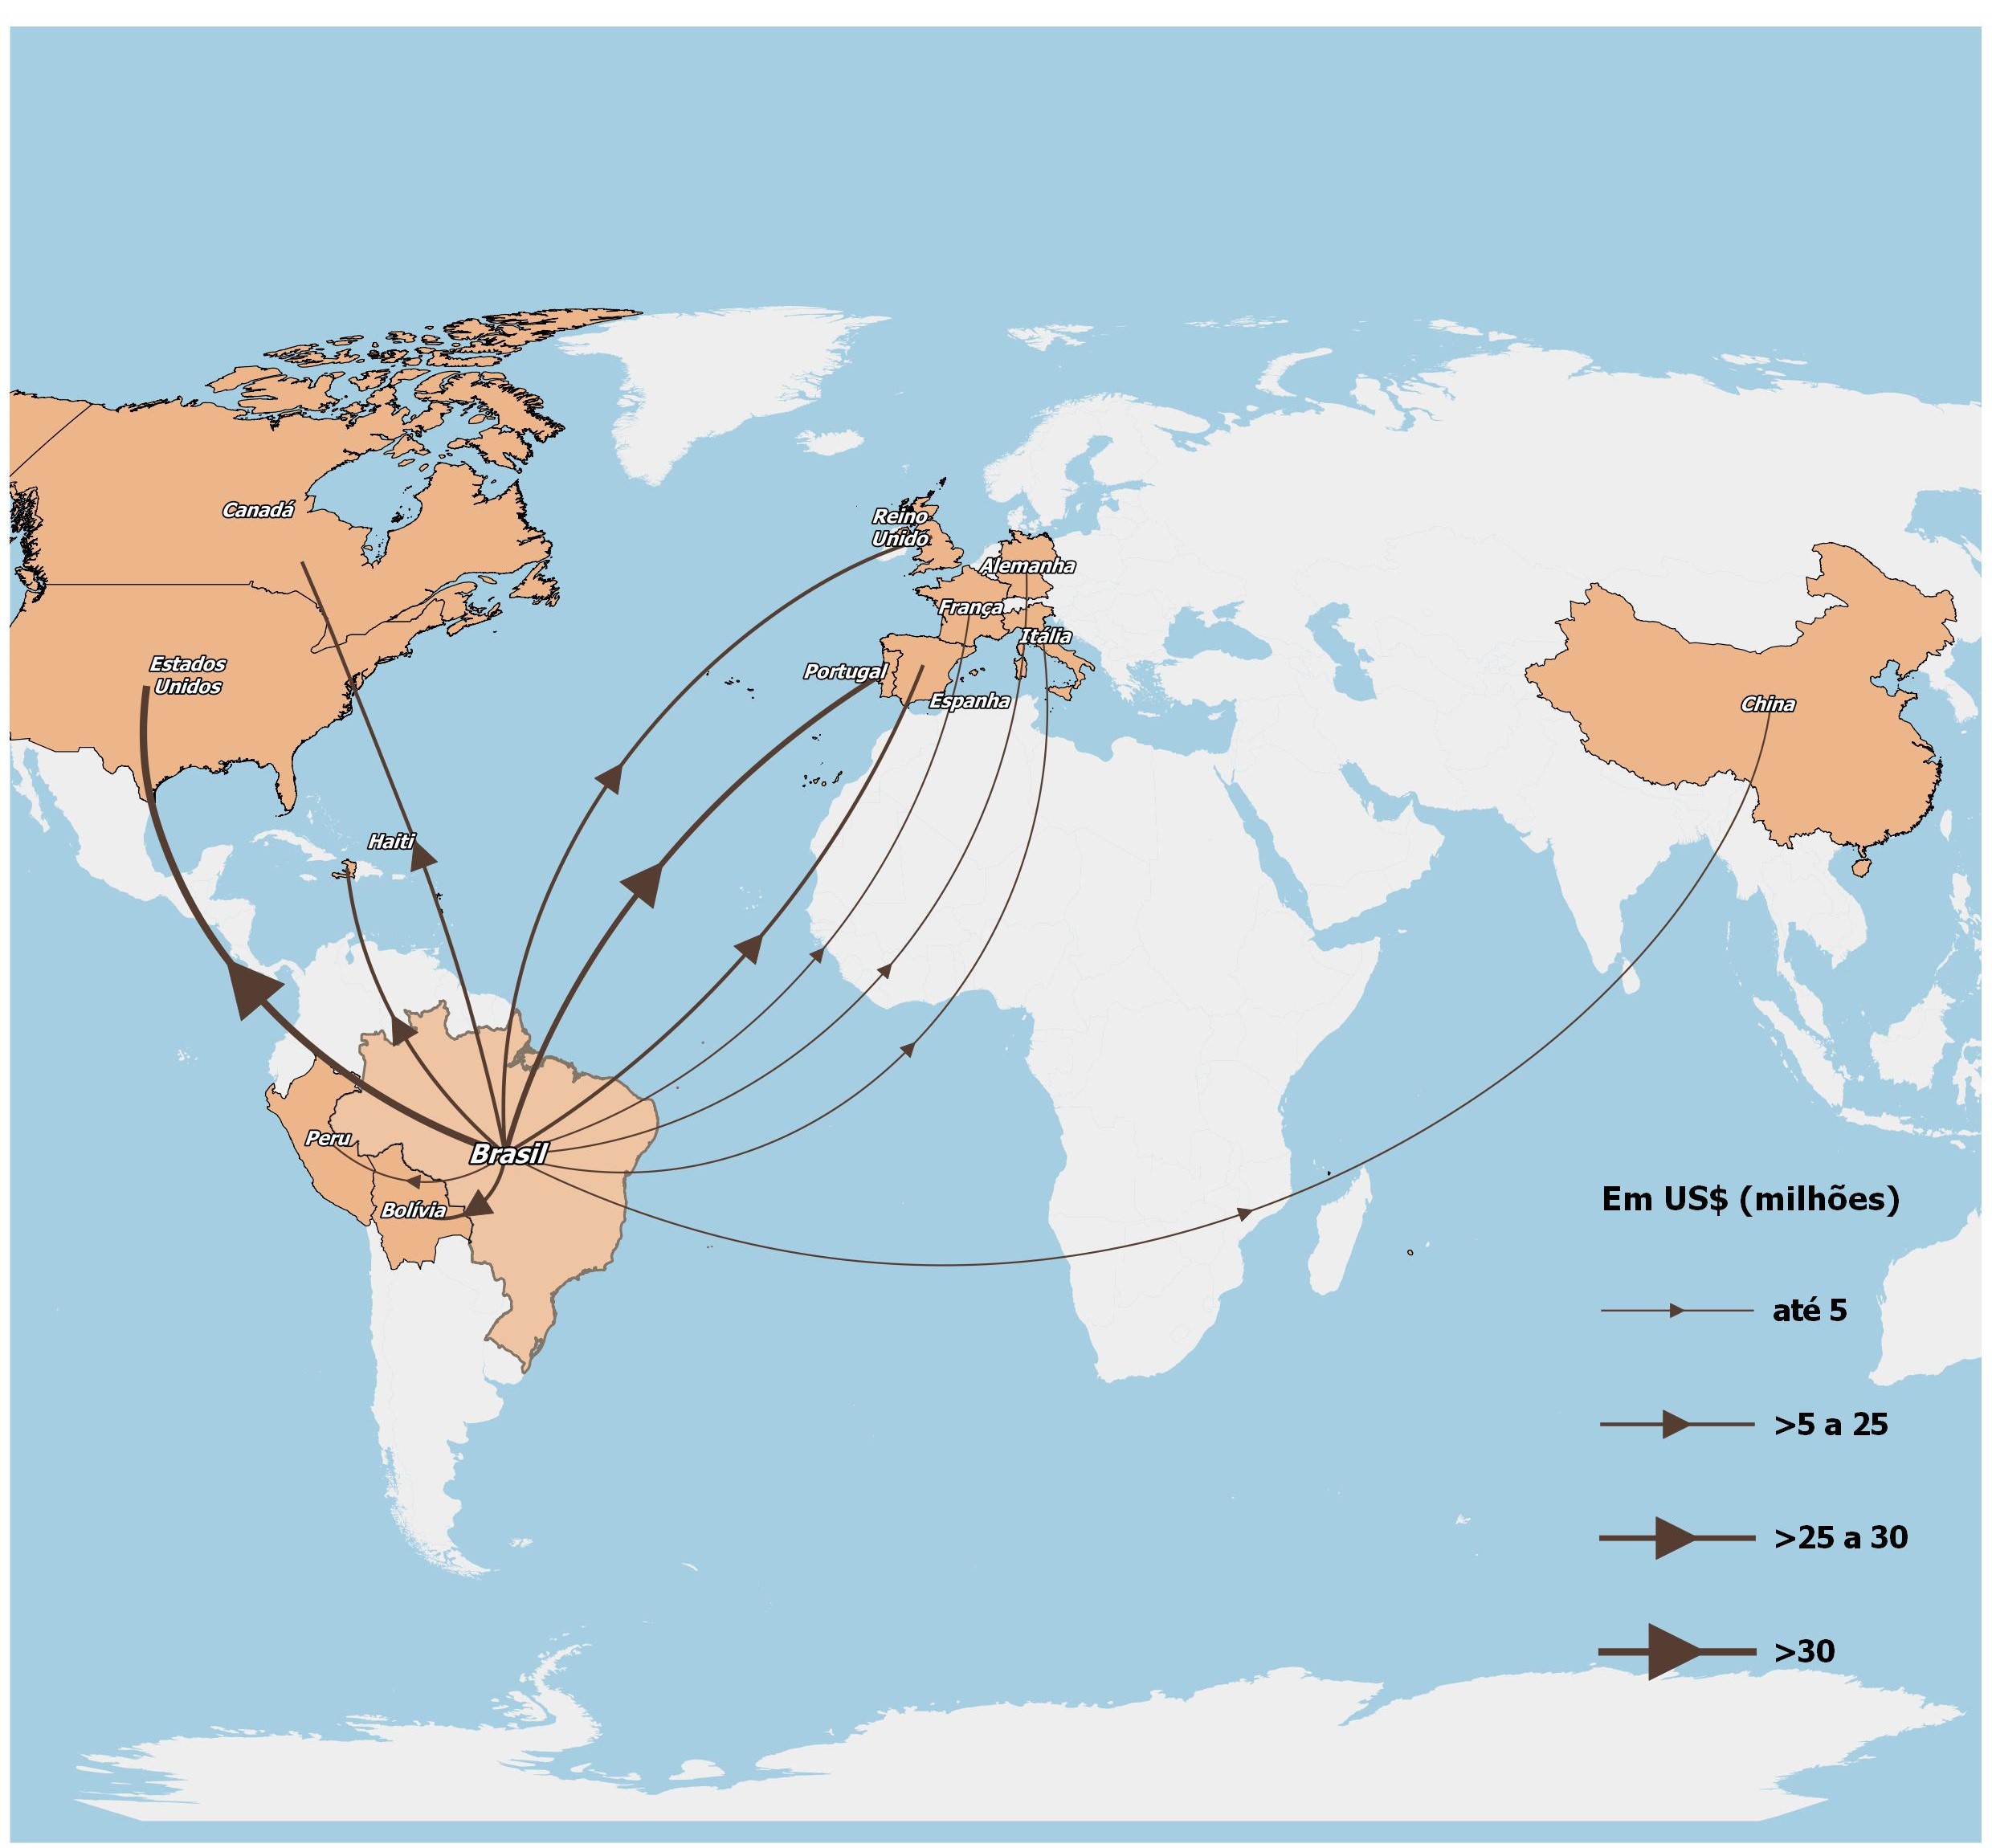 Source: OBMigra (2023), based on data from the Central Bank of Brazil, Department of Statistics.
COMO CITAR
The reproduction of this text and the data contained therein is permitted, provided that proper citation of the source is included. Reproduction for commercial use is prohibited.
How to cite this text:
|
CAVALCANTI, L; OLIVEIRA, T; FURTADO, A; DICK, P; QUINTINO, F; SILVA, B. Acompanhamento de fluxo e empregabilidade dos imigrantes no Brasil: Relatório Mensal do OBMigra Ano 3, Número 3, março de 2023/ Observatório das Migrações Internacionais; Brasília, DF: OBMigra, 2023. Available at: https://portaldeimigracao.mj.gov.br/pt/dados/relatorios-mensais
|


