CGIL
CGIL (General Coordination of Labor Immigration)
In January, there was a significant decline in the number of residence permits granted for work and investment purposes compared to January and December 2020. The decrease was -29.8% and 19.4%, respectively, continuing the downward trend that started in October 2020 (Graph 1).
"Prior Residence" permits was the most used type in January (76.2%), as can be seen in Graph 2.
Among skilled workers, the outcome was even more pronounced, with a -38.0% year-on-year comparison and a -44.4% in relation to the previous month. In this particular segment, the Brazilian Normative Resolution no. 30 (Resolução Normativa nº30, in Portuguese), which pertains to the renewal of work permits for immigrant workers within the country, remained the most frequently utilized measure. This trend indicates the challenges in attracting new skilled workers (Graph 3).
However, there was a positive variation among Italian workers, including those qualified, although in smaller numbers, and those who obtained authorization to engage in work or investment activities in the state of Ceará. This positive variation was observed in comparison to the month of December 2020.
GRAPH 1
Number of work permits granted for labor and investment purposes, by month of registration - Brazil, 2019-2021
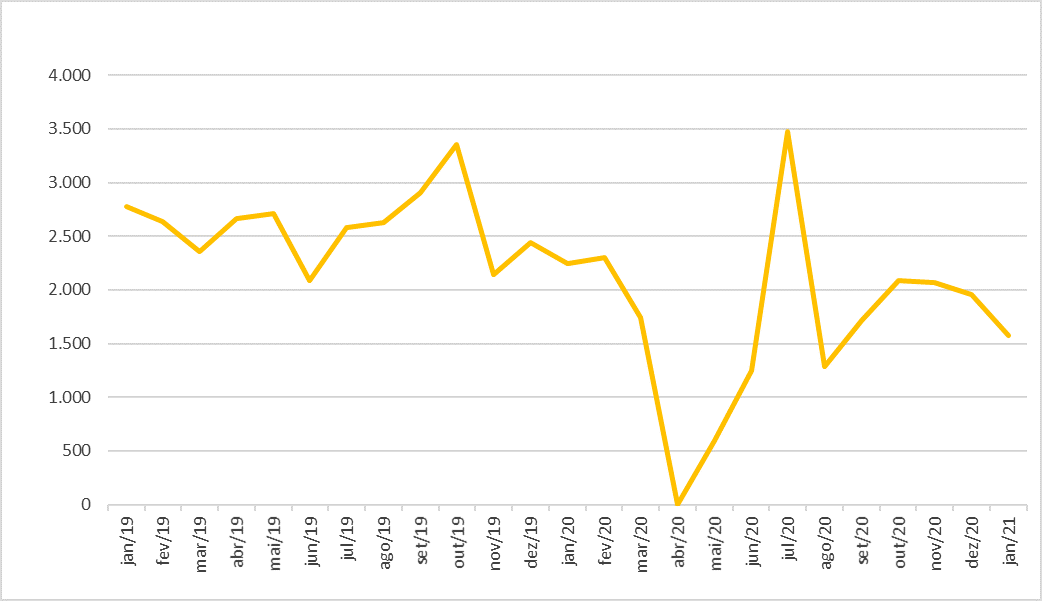 Source: OBMigra (2021), based on data from the General Coordination of Labor Immigration/Ministry of Justice and Public Security.
GRAPH 2
Relative distribution of granted permits by type of permit - Brazil, January 2021.
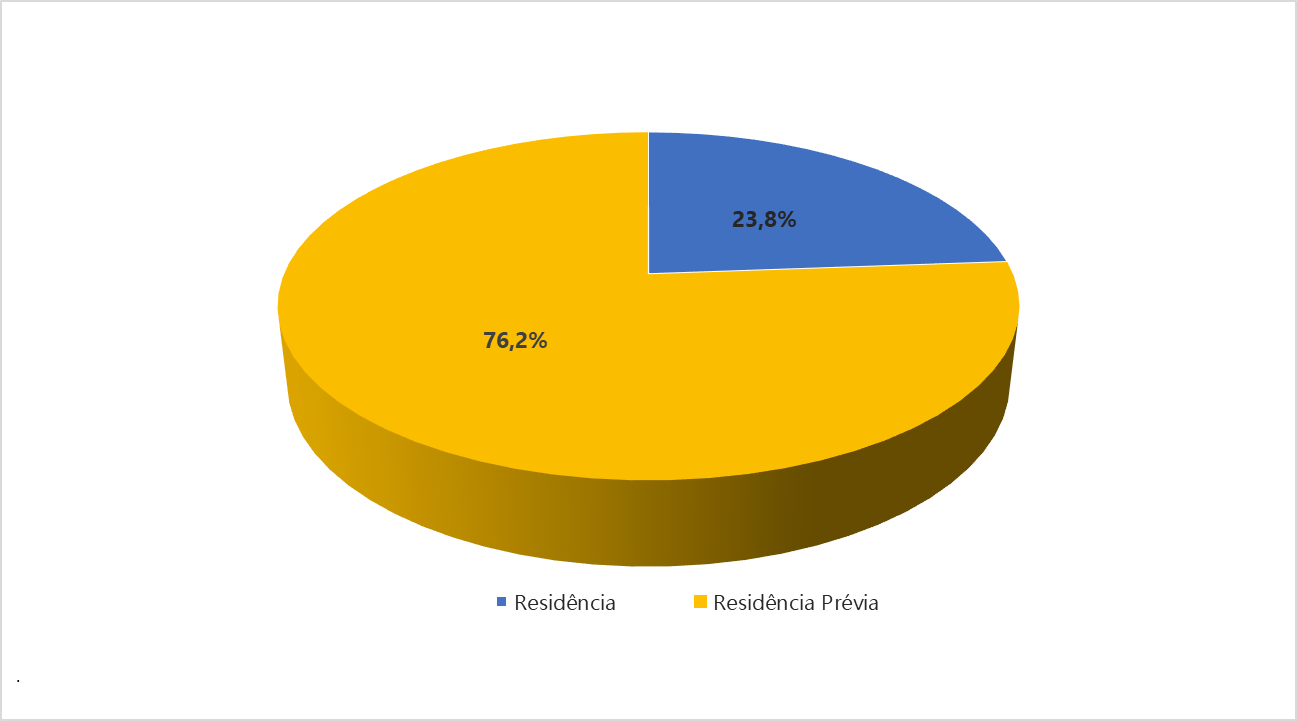
Source: OBMigra (2021), based on data from the General Coordination of Labor Immigration/Ministry of Justice and Public Security.
GRAPH 3
Number of permits granted to skilled workers, by type of permit, Brazil, January 2021.
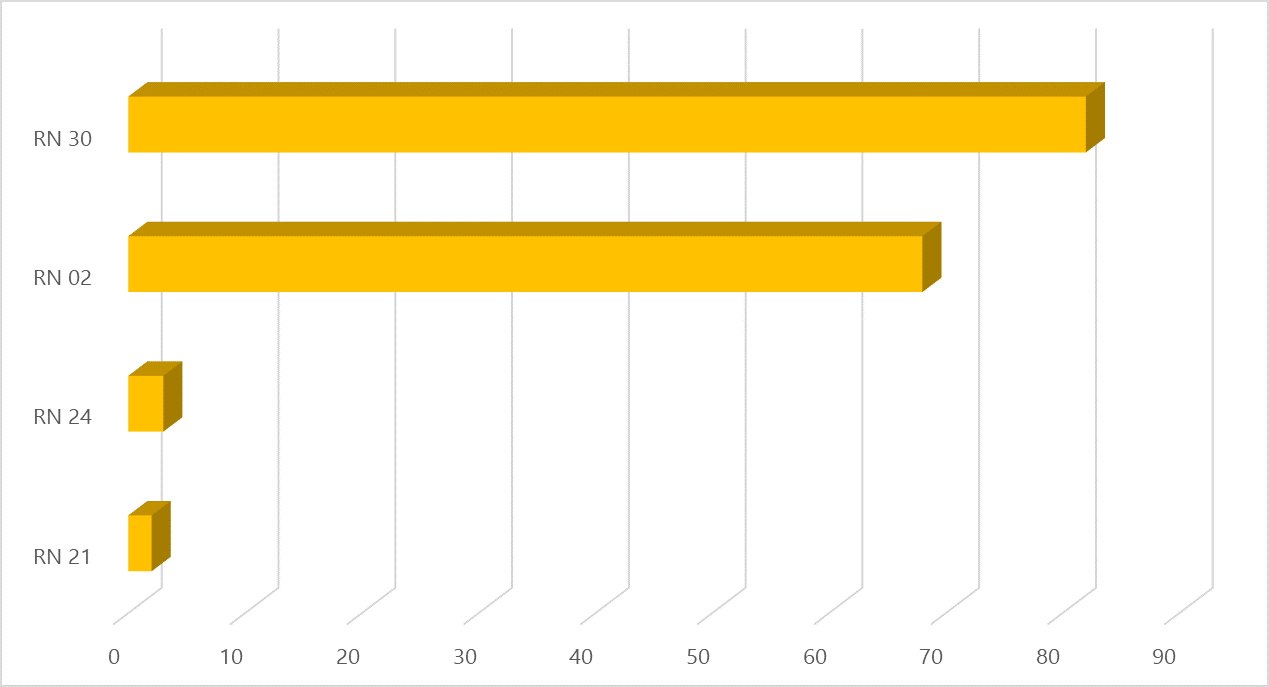
Source: OBMigra (2021), based on data from the General Coordination of Labor Immigration/Ministry of Justice and Public Security.
CTPS/RAIS/NOVO CAGED
Harmonized database Work and Social Security Card (CTPS)/Annual Report of Social Information (RAIS)/New General Register of Employed and Unemployed Persons (CAGED)
In December, new jobs were created for immigrant labor (1,475). However, compared to November, the number of jobs created in December declined after reaching the highest level observed in the entire historical series, which occurred in October 2020 (Graph 4). One striking detail was the fact that female workers benefited most from the creation of new jobs in the month.
GRAPH 4
Jobs created for immigrants, by month - Brazil, 2019/2020
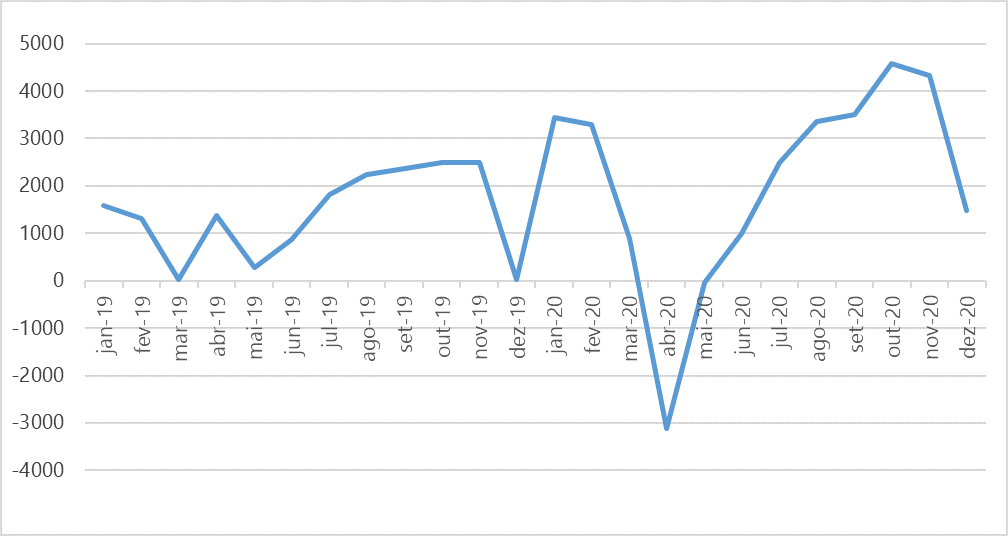
Source: OBMigra (2020), based on data from the harmonized database RAIS-CTPS-CAGED and the Digital System of Tax, Social Security and Labor Obligations (eSocial).
SISMIGRA
SisMigra (National Migration Registry System)
The regularization of residency for immigrants continues to be affected by the repercussions of the health crisis and the subsequent restrictions on international mobility. After experiencing a slight recovery between May and October 2020, the number of residence registrations has been consistently declining (Graph 5).
Although of lesser magnitude, the records based on humanitarian admission (279) and the admission of Venezuelan immigrants (273) were the most frequently utilized, as depicted in Graph 6.
Upon analyzing the primary countries of birth, as depicted on Map 1, the focus remains on Venezuelans and Haitians, who, to a greater extent, entered the country through the northern borders.
GRAPH 5
Number of immigrant registrations, by month of registration - Brazil, 2019-2021
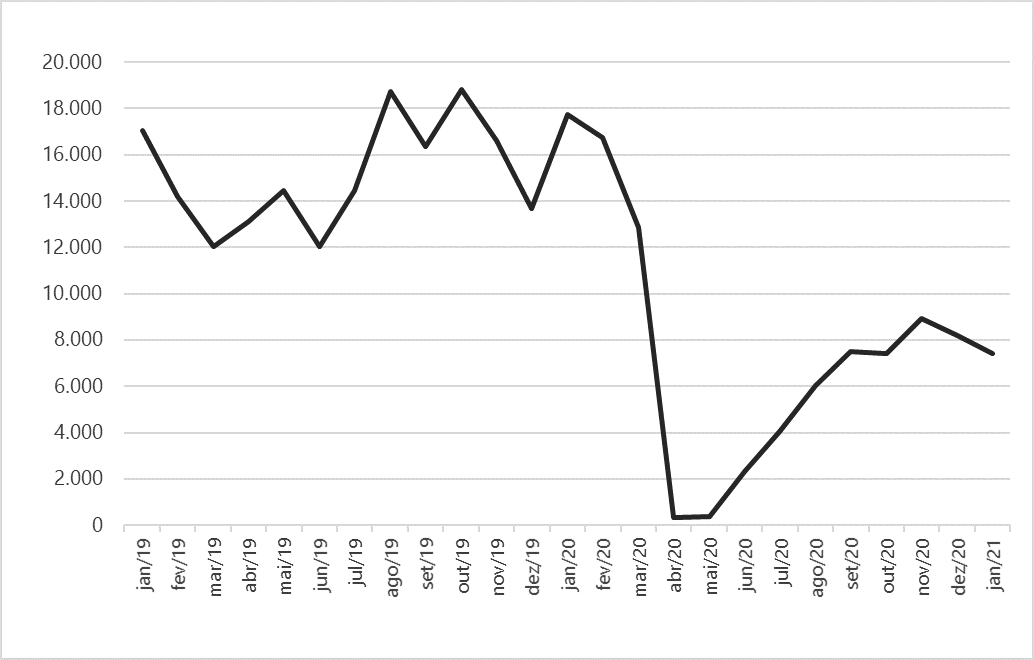
Source: OBMigra (2021), based on data from the Brazilian Federal Police, National Migration Registry System (SISMIGRA).
GRAPH 6
Total number of registrations, according to eligibility grounds, Brazil, January 2021.
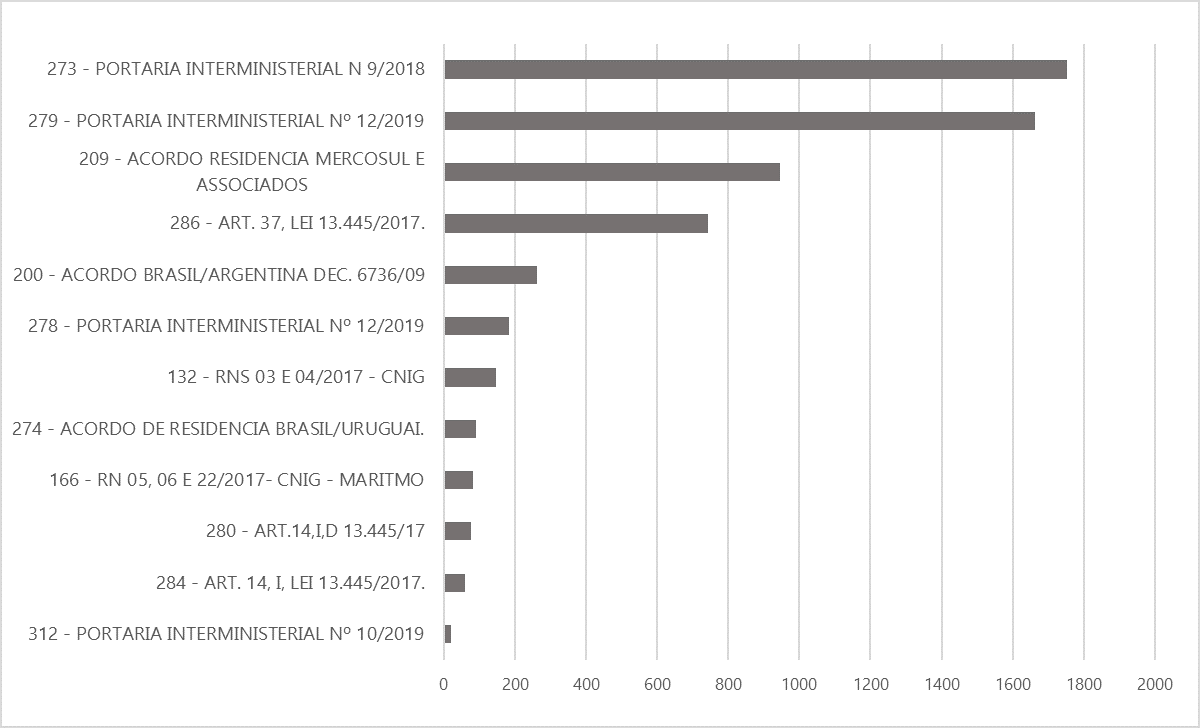
Source: OBMigra (2021), based on data from the Brazilian Federal Police, National Migration Registry System (SISMIGRA).
MAP 1
Number of immigrant registrations, by main countries of birth, January 2021.
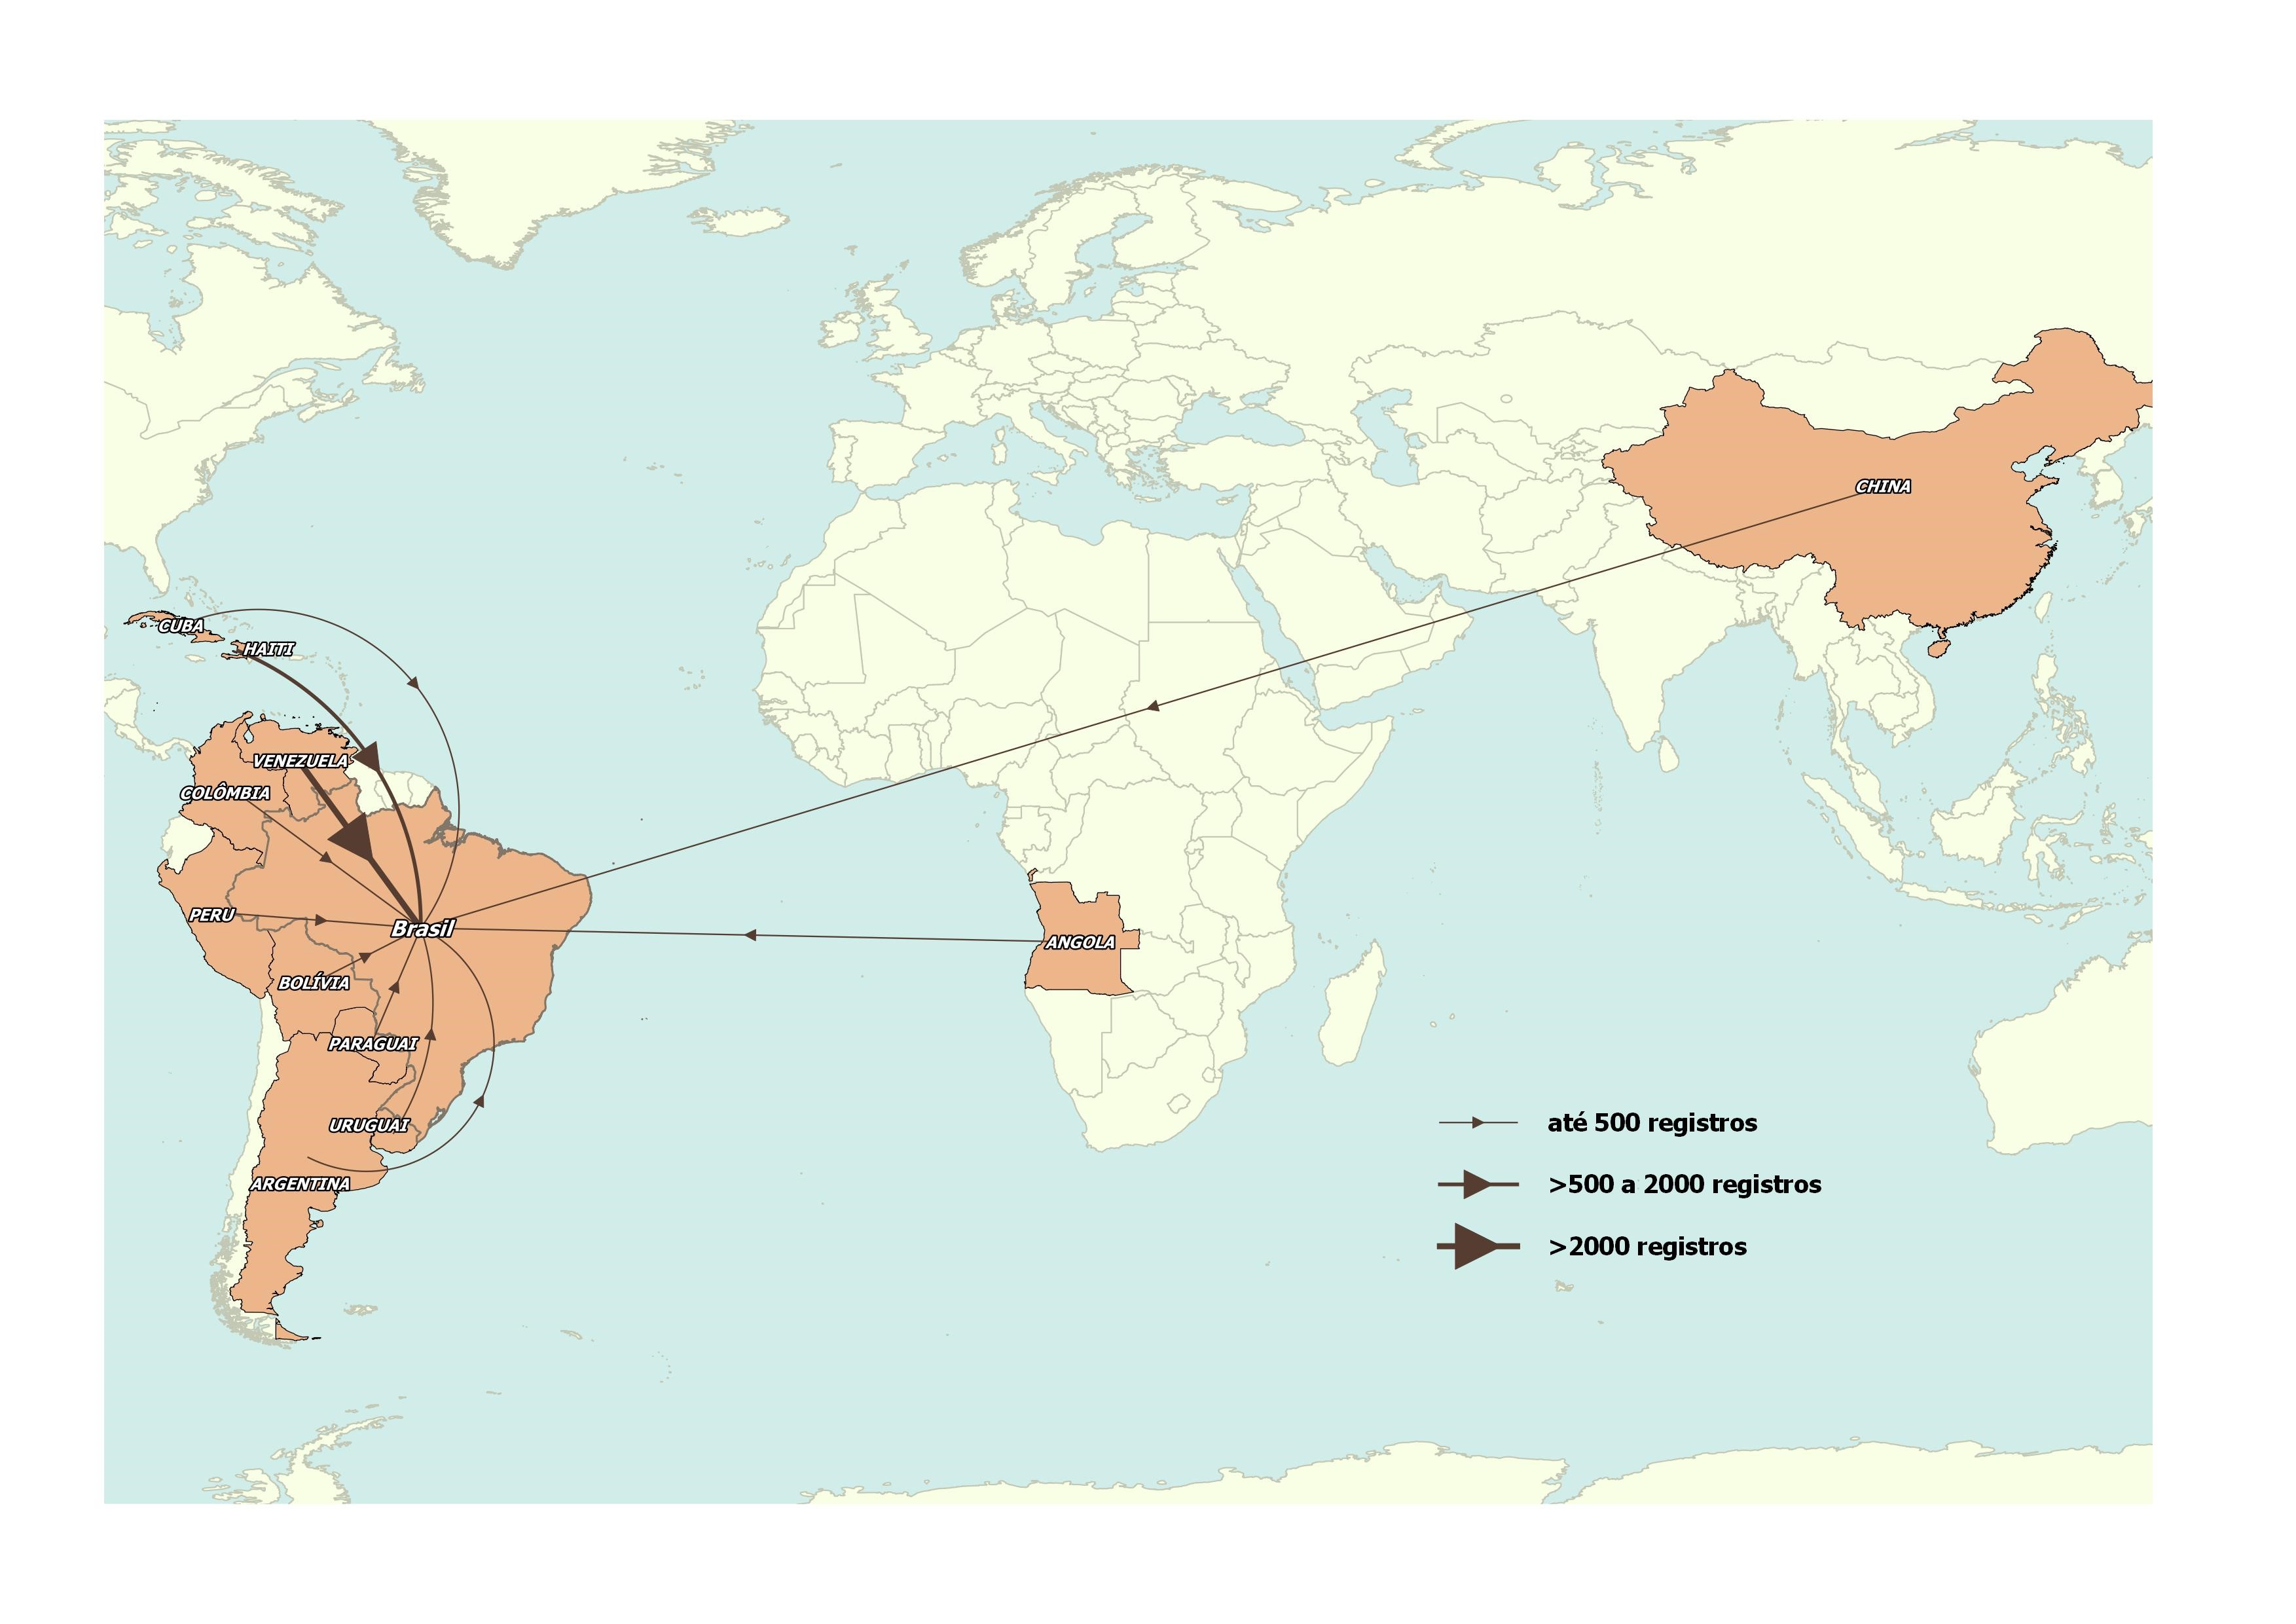
Source: OBMigra (2021), based on data from the Brazilian Federal Police, National Migration Registry System (SISMIGRA).
STI
STI (International Traffic System)
The records of movement through border crossings were severely impacted by the SARS-CoV-2 crisis, with reductions in both entry and exit movement exceeding -80.0% compared to 12 months ago. In January, the tenuous recovery that had begun in August was interrupted, as indicated by a -12.9% decrease compared to the previous month (Graph 7).
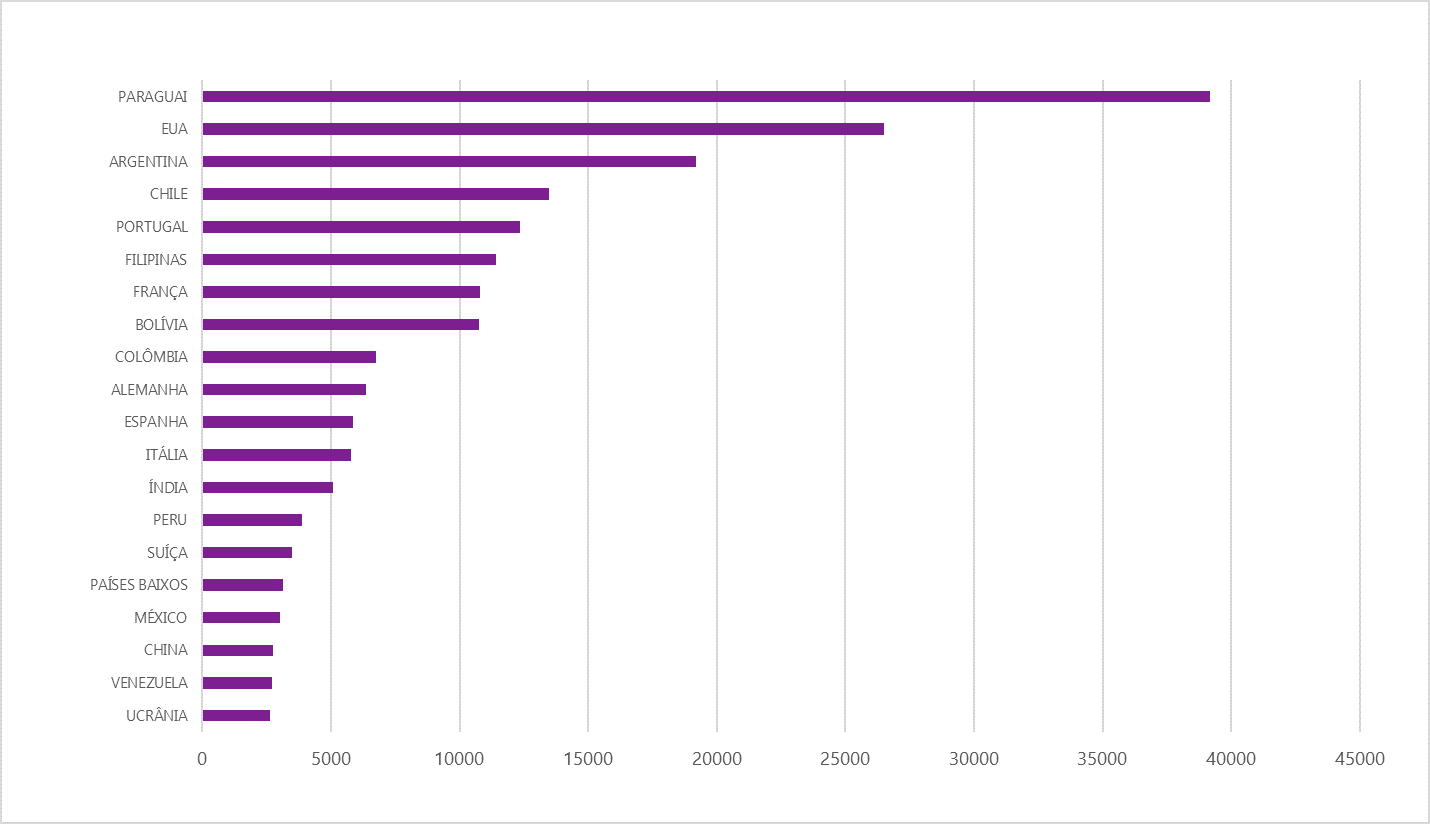
Paraguayans, US citizens, and Argentineans were the ones who moved the most through Brazilian borders in January of this year (Graph 8).
GRAPH 7
Cross-border movements, by month of registration, Brazil 2019/2021
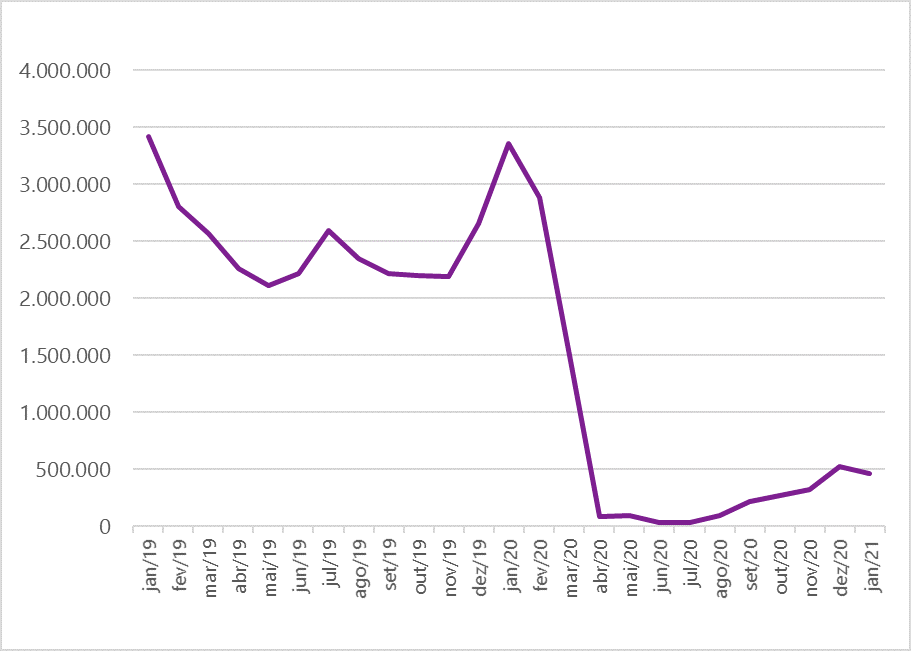
Source: OBMigra (2021), based on data from the Brazilian Federal Police, STI.
GRAPH 8
Cross-border entry into and exit from Brazilian territory, by main nationality countries - Brazil, January 2021
Source: OBMigra (2021), based on data from the Brazilian Federal Police, International Traffic System (STI)
STI-MAR
STI-MAR (International Traffic System - Warning and Restrictions Module)
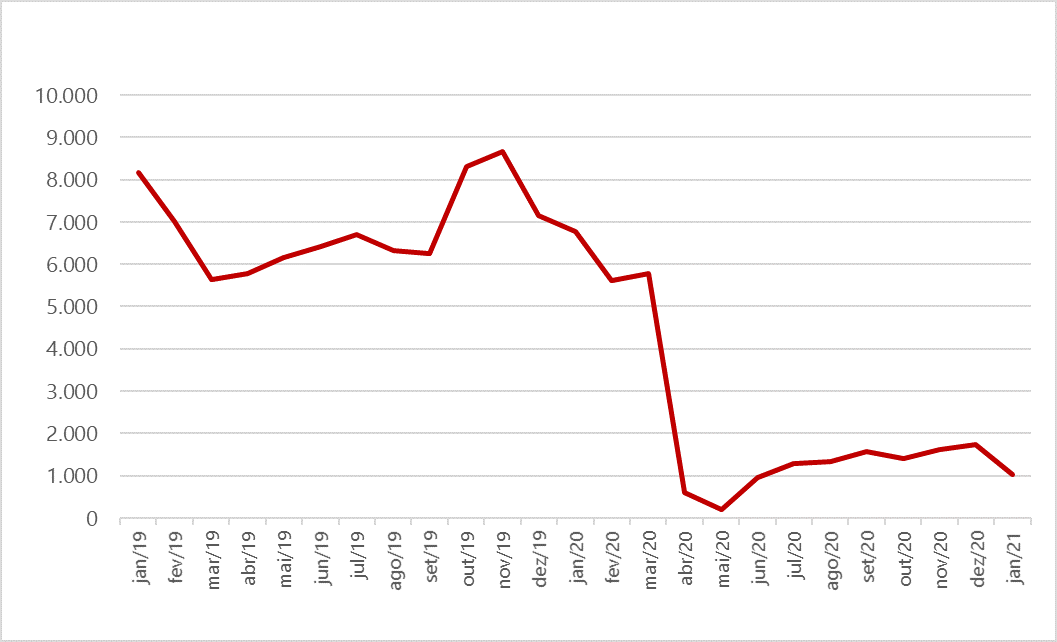
The requests for recognition of refugee status have also been impacted by the ongoing global health emergency, which hinders individuals' mobility. Since June 2020, there has been a stable and gradual recovery in the volume of registrations, with an average of around 1,500 registrations per month (Graph 9).
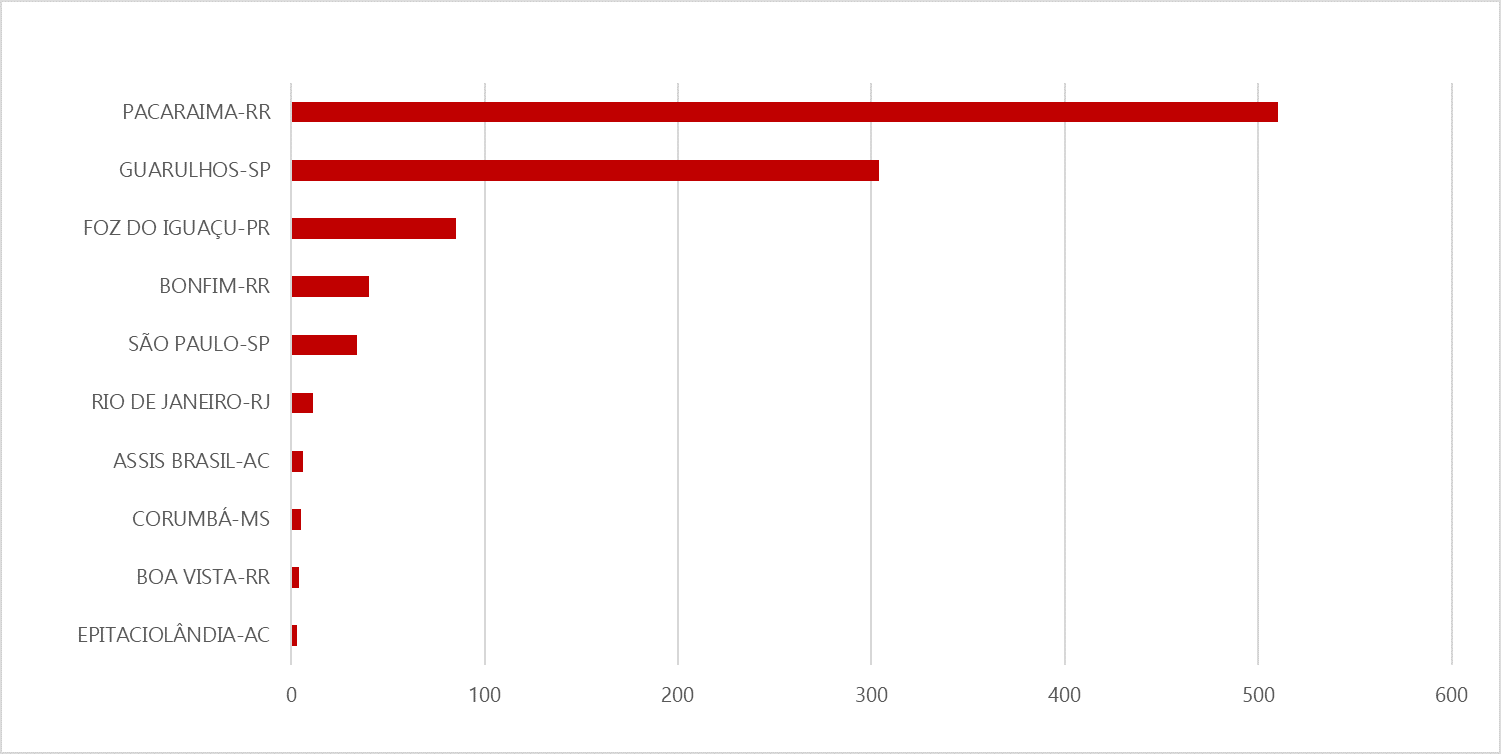
The cities of Pacaraima/RR and Guarulhos/SP had the highest number of asylum claims in January (Graph 10).
The age profile of individuals applying for refugee status shows a concentration within the 25 to 39 age groups and among those under 15 years old. This highlights the significant impact of family displacement on the applicants (Graph 11).
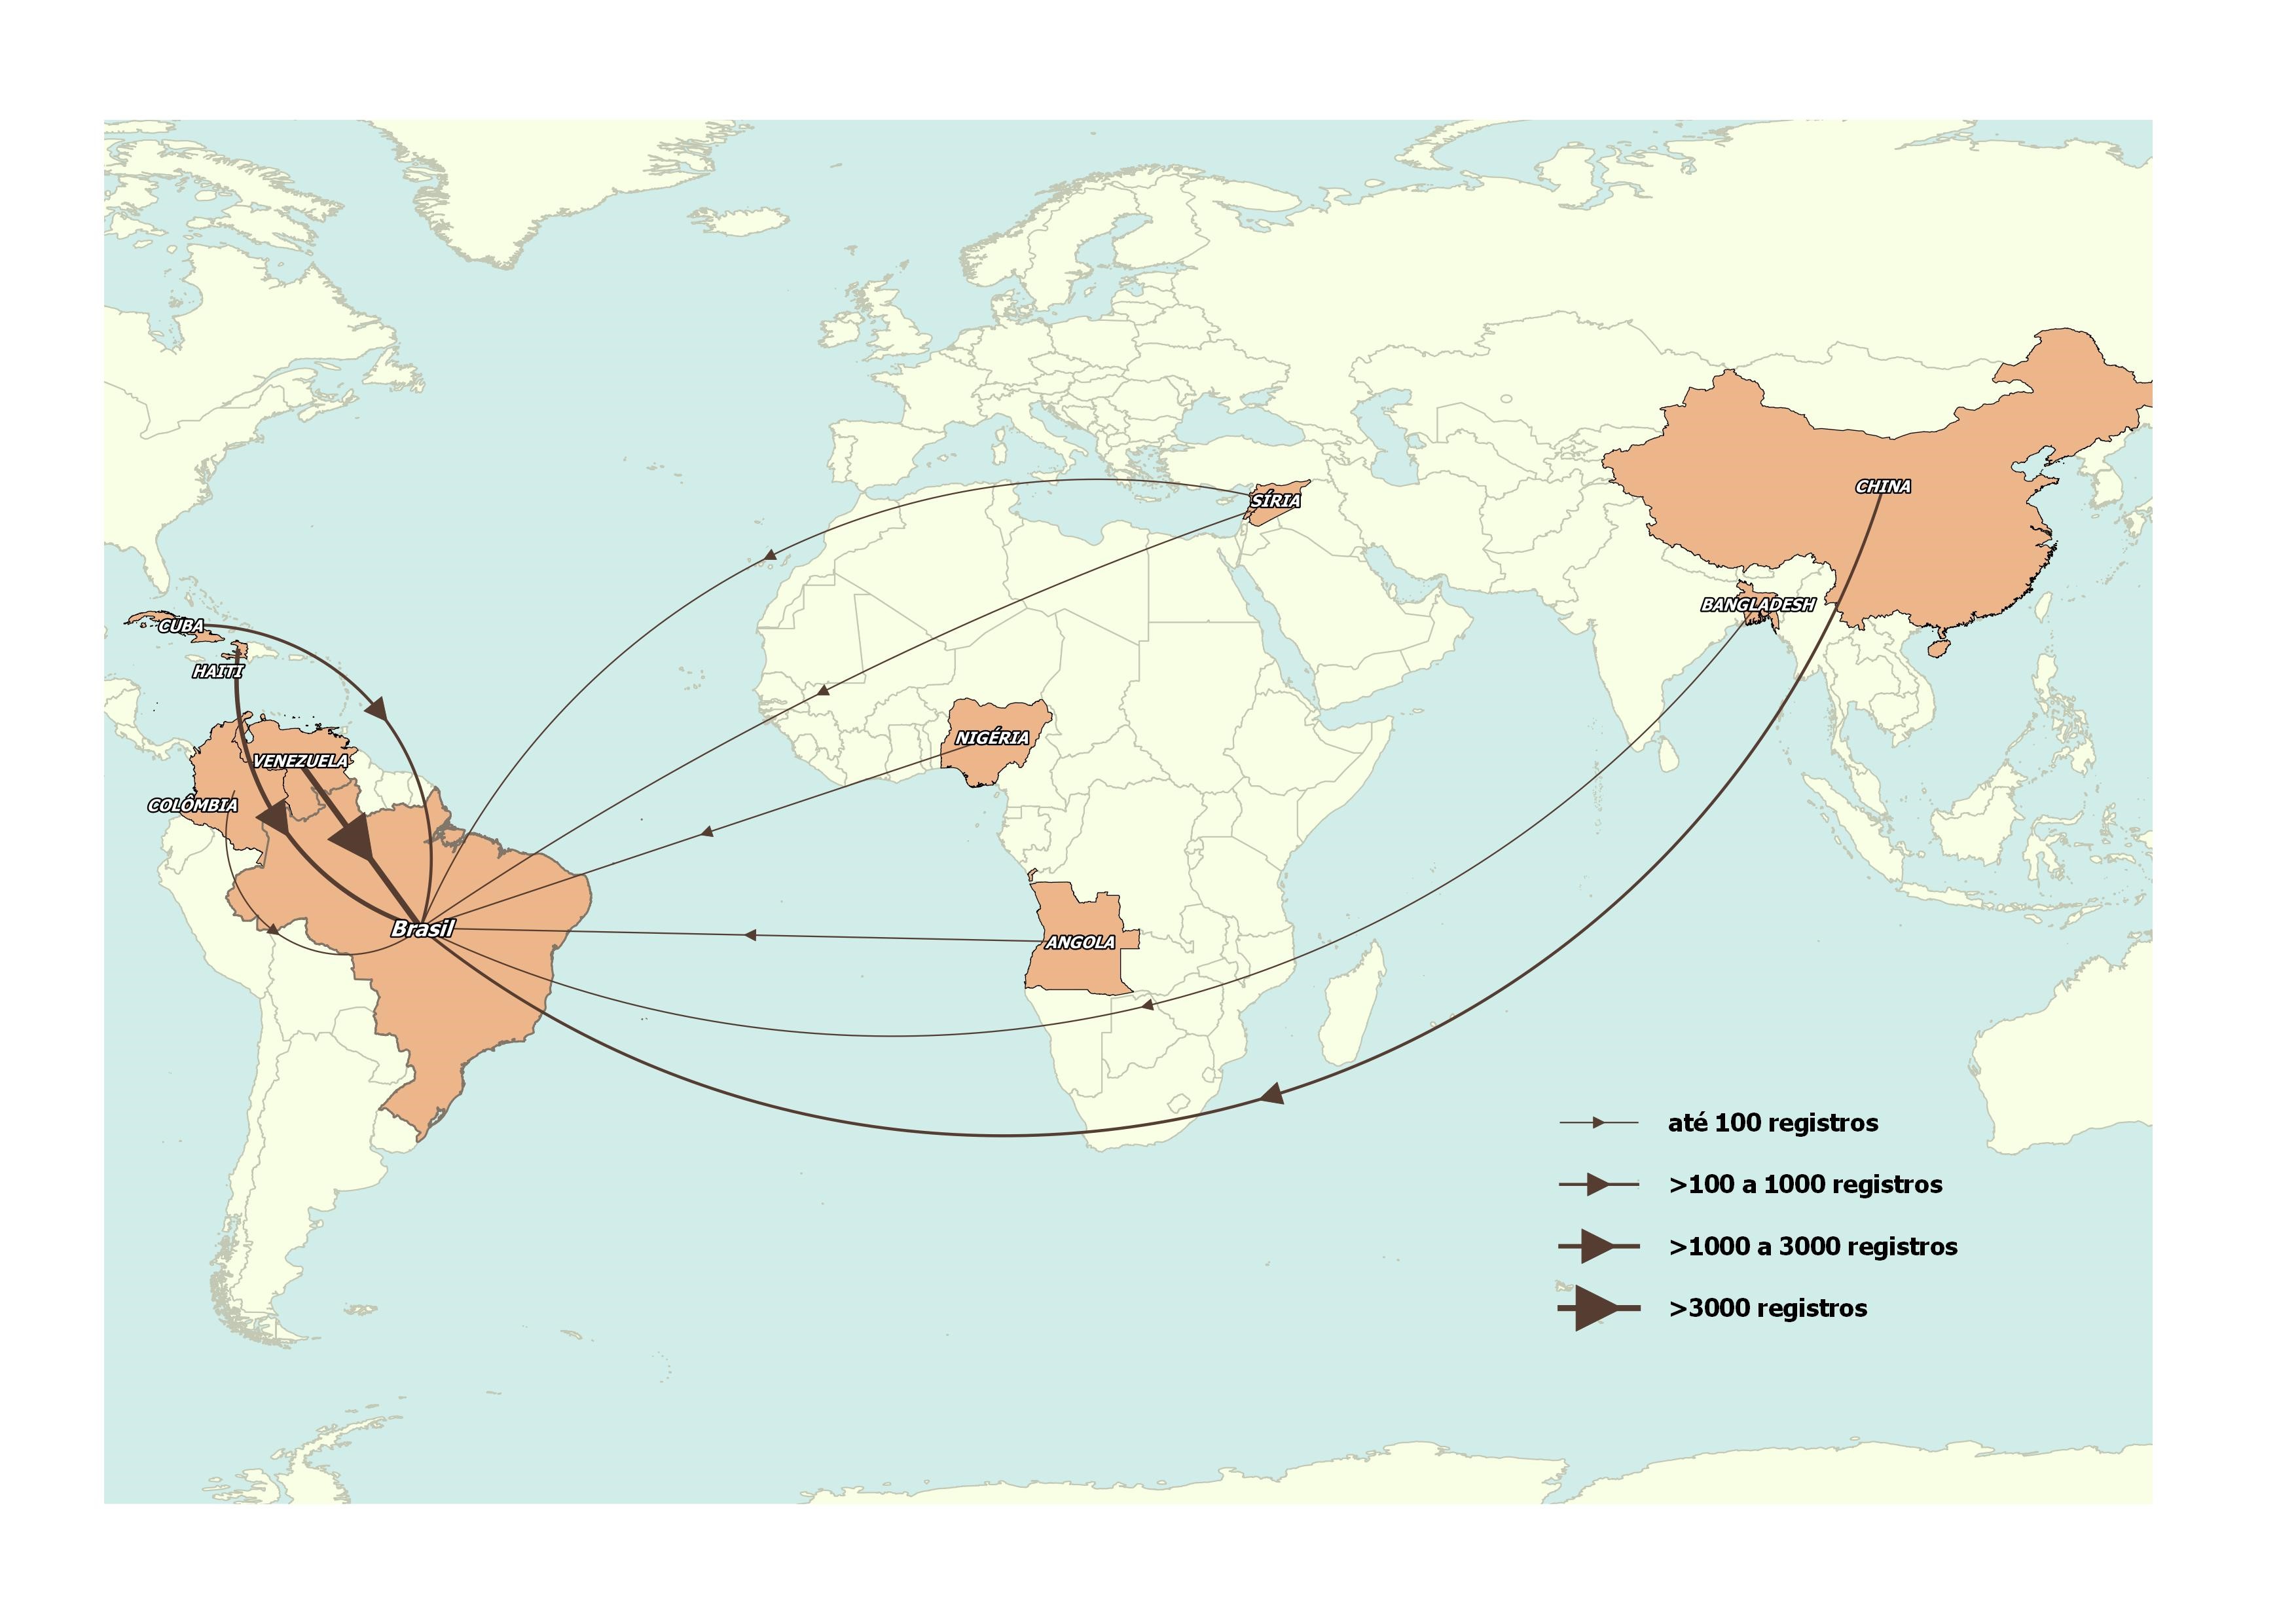
Similar to the residency registrations, Venezuelans and Haitians were the nationalities with the highest number of granted asylum claims(Map 2).
GRAPH 9
Number of asylum claims, by month of registration - Brazil, 2019-2021
Source: OBMigra (2021), based on data from the International Traffic System - Warning and Restrictions Module.
GRAPH 10
Number of asylum claims, according to main municipalities - Brazil, January 2021
Source: OBMigra (2021), based on data from the International Traffic System - Warning and Restrictions Module.
GRAPH 11
Number of asylum claims, according to age groups - Brazil, January 2021.

Source: OBMigra (January 2021), based on data from the Brazilian Federal Police, Asylum Claims.
MAP 2
Number of asylum claims, by main countries of nationality, January 2021
Source: OBMigra (2021), based on data from the General Coordination of Labor Immigration/Ministry of Justice and Public Security.
COMO CITAR
The reproduction of this text and the data contained therein is permitted, provided that proper citation of the source is included. Reproduction for commercial use is prohibited.
How to cite this text:
|
CAVALCANTI, L; OLIVEIRA, T; FURTADO, A; DICK, P; QUINTINO, F; MACEDO, M Acompanhamento de fluxo e empregabilidade dos imigrantes no Brasil: Relatório Mensal do OBMigra Ano 2, Número 1, JANEIRO de 2021/ Observatório das Migrações Internacionais; Brasília, DF: OBMigra, 202. Available at: https://portaldeimigracao.mj.gov.br/pt/dados/relatorios-mensais
|

 Source: OBMigra (2021), based on data from the General Coordination of Labor Immigration/Ministry of Justice and Public Security.


