CGIL
CGIL (General Coordination of Labor Immigration)
The number of work permits for labor and investment purposes has experienced a slight positive variation in relation to the previous month (2.3%), as well
as in the annual period (5.3%). This data reaffirms the stability of the historical series (Graph 1).
Technical, science and arts professionals benefited the most from work permits in February (Graph 2).
Among skilled workers, no major changes were observed in the monthly (3.0%) and yearly (1.3%) comparisons. The standout category remains RN02
(workers employed in Brazil). RN30 governs the renewal or extension of permits for an indefinite term. In other words, these are workers whose permits
have been renewed rather than new workers (Graph 3).
GRAPH 1
Number of work permits for labor and investment purposes, by month of registration - Brazil, 2019-2022

Source: OBMigra (2022), based on data from the General Coordination of Labor Immigration (CGIL).
GRAPH 2
Number of permits granted, by occupational group - Brazil, February 2022

Source: General Coordination of Labor Immigration / Ministry of Justice and Public Security, February 2022.
GRAPH 3
Number of permits granted to skilled workers, by type of permit, Brazil, February 2022.

Source: General Coordination of Labor Immigration / Ministry of Justice and Public Security, February 2022.
CTPS/RAIS/NOVO CAGED
Harmonized database Work and Social Security Card (CTPS)/Annual Report of Social Information (RAIS)/New General Register of Employed and
Unemployed Persons (CAGED)
In January the number of jobs for immigrants in the formal market oscillated positively, returning to the level observed in November 2021. The revival of the
labor market in this sector, which began in September and was interrupted in December, still requires confirmation through the results of the upcoming
months (Graph 4).
Two aspects regarding nationalities have drawn attention. Firstly, the notable increase in job opportunities created for Venezuelans, and secondly, the
remarkable performance of Haitian women, surpassing that of men from the same nationality (Graph 5).
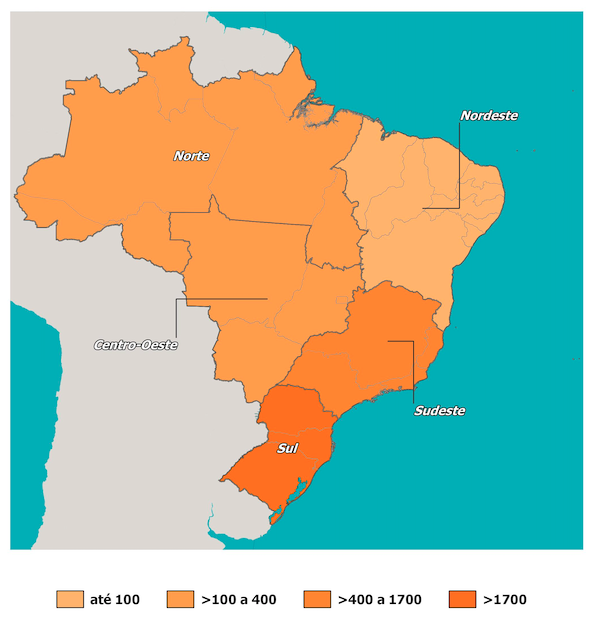
The South Region continued to be the location that not only had the highest number of immigrant workers, but also the one that generated the most jobs
(Map 1).
GRAPH 4
Jobs created for immigrants, by month - Brazil, 2019/2022

Source: OBMigra (2022), based on data from the harmonized database RAIS-CTPS-CAGED and the Digital System of Tax, Social Security and Labor
Obligations (eSocial).
GRAPH 5
Movements of migrant workers in the formal labor market, by sex and main countries - Brazil, January 2022.

Source: OBMigra (January 2022), based on data from the Ministry of Economy, Harmonized database RAIS-CTPS-CAGED
MAP 1
Movements of migrant workers in the formal labor market, by Regions – Brazil, January 2022.

Source: OBMigra (January 2022), based on data from the Ministry of Economy, Harmonized database RAIS-CTPS-CAGED
STI
STI (International Traffic System)
In February, the ongoing trend of increasing movement of people through border crossings, which had been observed since April 2021, was abruptly halted
(Graph 6).
The negative balance observed during the month was primarily driven by a higher number of departures of Brazilians, a trend that has been gradually
becoming a structural characteristic throughout the historical series that began in 2018. This suggests an intensification of Brazilian emigration (Graph 7).
Regarding other nationalities, approximately 30% of the negative balance was contributed by Argentineans, Paraguayans, and Chileans.
GRAPH 6
Cross-border movements, by month of registration, Brazil 2019/2022

Source: OBMigra (2022), based on data from the Brazilian Federal Police, International Traffic System (STI).
GRAPH 7
Cross-border movements of people, according to typology - Brazil, February 2022.

Source: OBMigra (February 2022), based on data from the Brazilian Federal Police, International Traffic System (STI).
SISMIGRA
SisMigra (National Migration Registry System)
The number of residence registrations has been negative for the second consecutive month, although higher than February 2021 (Graph 8). This indicator
should be monitored over the next few years to determine whether or not the trend has changed.
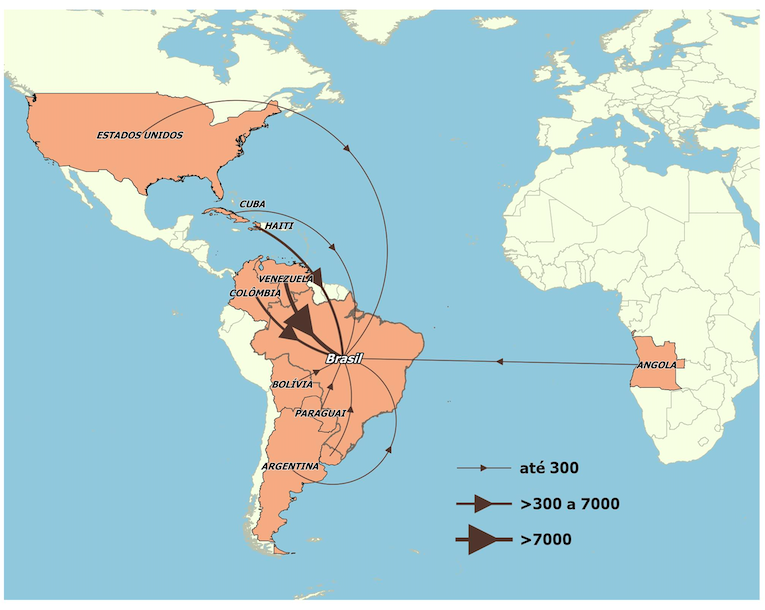
Once again, the reduction in residence registrations occurred due to a decrease in the number of Venezuelan registrations (Map 2) and a decline in children
(Graph 9).
The decrease in residence applications recorded in Boa Vista and Pacaraima indicates a decline in the entry of Venezuelans through the northern borders.
GRAPH 8
Number of immigrant registrations, by month of registration - Brazil, 2019/2022

Source: OBMigra (2022), based on data from the Brazilian Federal Police, National Migration Registry System (SISMIGRA).
GRAPH 9
Number of migrant registrations, by month of registration and age groups - Brazil, February/2022

Source: OBMigra (February 2022), based on data from the Brazilian Federal Police, National Migration Registry System (SISMIGRA).
MAP 2
Number of immigrant registrations, by main countries, February 2022

Source: OBMigra (February 2022), based on data from the Brazilian Federal Police, National Migration Registry System (SISMIGRA).
STI-MAR
STI-MAR (International Traffic System - Warning and Restrictions Module)
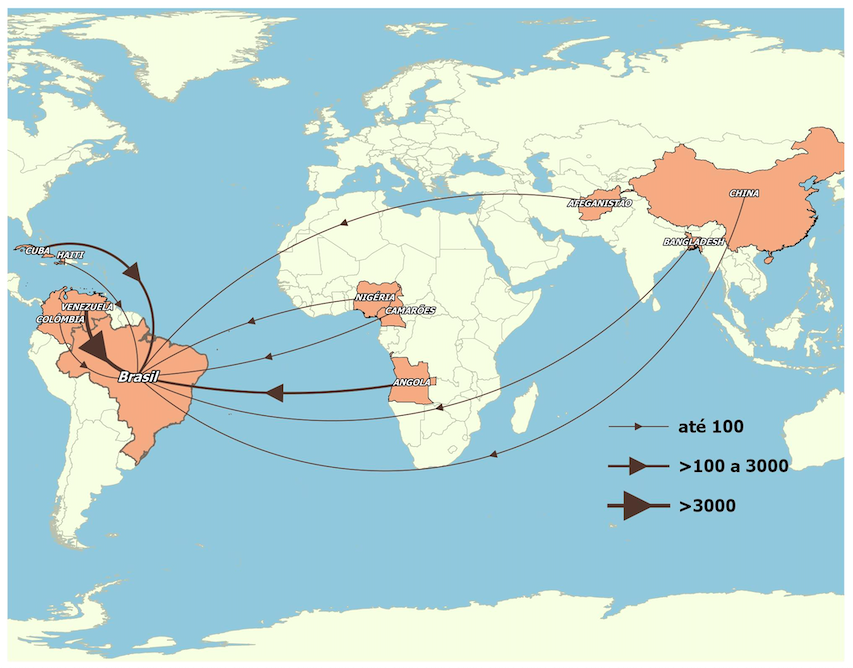
In February, there was a disruption to the positive trend in the evolution of applications for the recognition of refugee status (Graph 10). The drop was
primarily determined by the decrease in the number of applications from Venezuelans (Map 3).
Two characteristics in the applications registered in February must be noted: i) higher participation of people under 15 years old among the applicants; and
ii) resumption of Pacaraima as the main entry point of the applicants (Graph 11).
GRAPH 10
Number of applications for recognition of refugee status, by month of registration - Brazil, 2019-2022
Source: OBMigra (2022), based on data from the International Traffic System - Warning and Restrictions Module.
GRAPH 11
Number of applications for recognition of refugee status, by main municipalities - Brazil, February 2022.
Source: OBMigra (February 2022), based on data from the Brazilian Federal Police, Asylum Claims.
MAP 3
Number of asylum claims, by main countries of nationality, February 2022.
Source: OBMigra (February 2022), based on data from the Brazilian Federal Police, Asylum Claims
COMO CITAR
The reproduction of this text and the data contained therein is permitted, provided that proper citation of the source is included. Reproduction for
commercial use is prohibited.
How to cite this text:
CAVALCANTI, L; OLIVEIRA, T; FURTADO, A; DICK, P; QUINTINO, F; GUIMARÃES, B. Acompanhamento de fluxo e empregabilidade dos imigrantes no Brasil:
Relatório Mensal do OBMigra Ano 3, Número 2, fevereiro de 2022/ Observatório das Migrações Internacionais; Brasília, DF: OBMigra, 2022. Available at:
https://portaldeimigracao.mj.gov.br/pt/dados/relatorios-mensais


